A vibrational spectroscopic study of the silicate mineral lomonosovite
Na
5
Ti
2
(Si
2
O
7
)(PO
4
)O
2
Ray L. Frost
a,⇑, Andrés López
a, Frederick L. Theiss
a, Leonardo M. Graça
b, Ricardo Scholz
baSchool of Chemistry, Physics and Mechanical Engineering, Science and Engineering Faculty, Queensland University of Technology, GPO Box 2434, Brisbane,
Queensland 4001, Australia
bGeology Department, School of Mines, Federal University of Ouro Preto, Campus Morro do Cruzeiro, Ouro Preto, MG 35,400-00, Brazil
h i g h l i g h t s
The mineral lomonosovite was analysed using combination of SEM with EDX and vibrational
spectroscopy.
Lomonosovite was considered as a member of the homonymous group. Qualitative chemical analysis gave Si,
P, Na and Ti as the as major elements. The mineral lomonosovite has a
formula Na5Ti2(Si2O7)(PO4)O2.
Infrared spectroscopy identifies bands in the water stretching and bending regions.
g r a p h i c a l
a b s t r a c t
a r t i c l e
i n f o
Article history: Received 6 March 2014
Received in revised form 27 May 2014 Accepted 3 June 2014
Available online 24 June 2014
Keywords: Lomonosovite Silicate Phosphate Raman spectroscopy Kola Peninsula
a b s t r a c t
The mineral lomonosovite has been studied using a combination of scanning electron microscopy with energy dispersive X-ray analysis and vibrational spectroscopy. Qualitative chemical analysis gave Si, P, Na and Ti as the as major elements with small amounts of Mn, Ca, Fe and Al. The mineral lomonosovite has a formula Na5Ti2(Si2O7)(PO4)O2. Raman bands observed at 909, 925 and 939 cm 1are associated with
phosphate units. Raman bands found at 975, 999, 1070, 1080 and 1084 cm1are attributed to siloxane
stretching vibrations.
The observation of multiple bands in both the phosphate stretching and bending regions supports the concept that the symmetry of the phosphate anion in the structure of lomonosovite is significantly reduced. Infrared spectroscopy identifies bands in the water stretching and bending regions, thus suggesting that water is involved with the structure of lomonosovite either through adsorption on the surface or by bonding to the phosphate units.
Ó2014 Elsevier B.V. All rights reserved.
Introduction
Lomonosovite is rare multi-anion mineral. The general chemical formula can be written as Na5Ti2(Si2O7)(PO4)O2[1]. In a previous study, lomonosovite was considered as a member of the
homony-mous group, including murmanite, epistolite, innelite, vuonnemite, b-lomonosovite, quadruphite, polyphite and sobolevite[2]. These minerals show structure similarity with seidozerite building blocks and sandwiches made by a central brucite layer and two identical nets of associated [TiO6] octahedra and [Si2O7] groups with Na atoms in the net voids. This kind of blocks is parallel to the ab planes in all minerals of the group[2]. In a recent study published by Camara et al.[3], the murmanite group was dismembered from the lomonosovite group.
http://dx.doi.org/10.1016/j.saa.2014.06.005 1386-1425/Ó2014 Elsevier B.V. All rights reserved.
⇑ Corresponding author. Tel.: +61 7 3138 2407; fax: +61 7 3138 1804. E-mail address:[email protected](R.L. Frost).
Contents lists available atScienceDirect
Spectrochimica Acta Part A: Molecular and
Biomolecular Spectroscopy
Lomonosovite was first described in the Lovozero alkaline com-plex, Kola Peninsula, Russia. The mineral as triclinic system, space group P1/and with unit cell parameters give as: a= 5.49 Å, b= 7.11 Å,c= 14.5 Å,
a
= 101°,b= 96°,c
= 90°[1].The lomonosovite is product of low-temperature hydrothermal activity, occurring in syenite pegmatites[1], and occurs in associa-tion with a complex paragenesis[1,4–6].
The aim of this paper is to report the Raman spectra of well-defined natural hydrated silicate–phosphate minerals, lomonoso-vite, and to relate the spectra to this molecular and the crystal structure. The paper follows the systematic research of the large group of oxyanion containing minerals, and especially their molec-ular structure using IR and Raman spectroscopy.
Experimental
Samples description and preparation
The lomonosovite sample studied in this work forms part of the collection of the Geology Department of the Federal University of Ouro Preto, Minas Gerais, Brazil, with sample code SAC-090. The sample is from the Kirovskii apatite mine, Kukisvumchorr Mt, Khibiny Massif, Kola Peninsula, Russia[7].
The Kola Peninsula is the northeastern segment of the Precam-brian Baltic Shield, and is characterized by complicated block structures, which were reactivated during several tectono-mag-matic episodes. During the Devonian, numerous ultramafic, alka-line and carbonatitic intrusions were emplaced over an area of more than 100,000 km2 which extends from eastern Finland to the eastern Kola Peninsula, and comprise the Kola Alkaline Prov-ince (KAP). These various ultramafic and alkaline silicate rocks found in Kovdor are considered to have been formed from several batches of a carbonated olivine melanephelinite parental magma by a mechanism involving fractional crystallization, magma mix-ing and/or contamination[8].
The Khibiny massif was emplaced during the Devonian (Kramm and Sindern 2004)[9]simultaneously with the subsidence of the NE–SW trending Khibiny-Kontozero-Graben and is the largest agpaitic, nepheline syenite body in the Kola Alkaline Province. In general, Khibiny consists of a variety of nepheline syenites (khibi-nite, rischorrite, lujavrite and foyaite), foidalites (ijolite and urtite) and minor alkali syenite plus a small carbonatite stock[10].
The lomonosovite sample studied occurs in association with aegirina and lamprophyllite. The sample was gently crushed and the associated minerals were removed under a stereomicroscope Leica MZ4. The lomonosovite studied in this work occurs in associ-ation with siderite. Scanning electron microscopy (SEM) in the Energy Dispersive Spectroscopy (EDS) mode was applied to sup-port the mineral characterization.
Scanning electron microscopy (SEM)
Experiments and analyses involving electron microscopy were performed. Lomonosovite cleavage fragment was coated with a 5 nm layer of evaporated carbon. Secondary Electron and Backscat-tering Electron images were obtained using a JEOL JSM-6360LV equipment. Qualitative and semi-quantitative chemical analyses in the EDS mode were performed with a ThermoNORAN spectrom-eter model Quest and were applied to support the mineral characterization.
Raman spectroscopy
The crystals of lomonosovite were placed and oriented on the stage of an Olympus BHSM microscope, equipped with 10x and
50xobjectives and part of a Renishaw 1000 Raman microscope system, which also includes a monochromator, a filter system and a Charge Coupled Device (CCD). Raman spectra were excited by a HeNe laser (633 nm) at a nominal resolution of 2 cm 1 in the range between 100 and 4000 cm 1. The spatial resolution of the instrument is 1
l
m. Thus, if crystals are less than this value, a mixture of crystals will be measured. However, the crystals of lomonosovite used in this experiment were >1.1l
m.Infrared spectroscopy
Infrared spectra of analcime were obtained using a Nicolet Nexus 870 FTIR spectrometer with a smart endurance single bounce diamond ATR cell. By using this technique, the sample may be preserved. Spectra over the 4000–525 cm 1range were obtained by the co-addition of 128 scans with a resolution of 4 cm 1 and a mirror velocity of 0.6329 cm/s. Spectra were co-added to improve the signal to noise ratio.
Spectral manipulation such as baseline adjustment, smoothing and normalisation were performed using the Spectracalc software package GRAMS (Galactic Industries Corporation, NH, USA). Band component analysis was undertaken using the Jandel ‘Peakfit’ soft-ware package which enabled the type of fitting function to be selected and allows specific parameters to be fixed or varied accordingly. Band fitting was done using a Lorentz–Gauss cross-product function with the minimum number of component bands used for the fitting process. The Gauss–Lorentz ratio was main-tained at values greater than 0.7 and fitting was undertaken until reproducible results were obtained with squared correlations of r2greater than 0.995.
Results and discussion
Chemical characterization
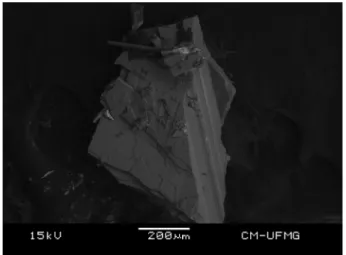
The SEM image of lomonosovite sample studied in this work is shown inFig. 1. The sample corresponds to a cleavage fragment up to 1.0 mm. The SEM image shows a homogeneous phase. Qualita-tive chemical analysis gave Si, P, Na and Ti as the as major ele-ments. Small amounts of Mn, Ca, Fe and Al were also observed (Fig. 2).
Fig. 1.Backscattered electron image (BSI) of a lomonosovite single crystal up to 1.0 mm in length.
Vibrational spectroscopy of lomonosovite
The Raman spectrum of lomonosovite in the 100–4000 cm 1 spectral range is displayed in Fig. 3a. This spectrum shows the position and relative intensities of the Raman bands. It is noted that there are large parts of the spectrum where no intensity or minimal intensity is observed. Thus, the spectrum is subdivided into subsections depending upon the type of vibration being stud-ied. The infrared spectrum of lomonosovite in the 500–4000 cm 1 spectral region is shown inFig. 3b. This figure shows the position of the infrared bands and their relative intensities. This spectrum dis-plays the position and relative intensities of the infrared bands. As for the Raman spectrum, there are parts of the spectrum where lit-tle or no intensity is observed. It is noted that in the Raman spec-trum, no intensity in the OH stretching region was observed, however considerable intensity is found in the infrared spectrum over the OH spectral region.
The Raman spectrum of lomonosovite in the 750–1150 cm 1 spectral range is reported inFig. 4a. The mineral lomonosovite Na 5-Ti2(Si2O7)(PO4)O2 from a chemistry point of view has complex chemistry. The mineral is a sodium titanium silicate with phos-phate units.
Intense Raman bands are observed at 909, 925 and 939 cm 1. These bands are associated with the phosphate units. The band at 939 cm 1is assigned to the PO
4
3 symmetric stretching mode
and the bands at 909 and 925 cm 1are attributed to the HOPO 3 2
symmetric stretching vibration. Raman bands are observed at 1070, 1080 and 1084 cm 1. These bands are assigned to SiO anti-symmetric stretching vibrations. The Raman bands at 975 and 999 cm 1may be assigned to the SiO symmetric stretching vibra-tions. Dowty showed that the –SiO3units had a unique band posi-tion of around 980 cm 1[11]. Dowty also showed that Si
2O5units had a Raman peak at around 1100 cm 1. The infrared spectrum of lomonosovite over the 650–1150 cm 1spectral range is reported inFig. 4b. This infrared spectrum is complex with many overlap-ping bands. Any attempt to assign these bands is fraught with dan-ger. What this work shows is how powerful Raman spectroscopy in the study of minerals such as lomonosovite. Raman spectroscopy offers greater band separation. The infrared bands resolved at 917, 945, 957, 977 and 998 cm 1may be associated with phos-phate stretching vibrations. The infrared bands at 1035, 1067 and 1100 cm 1are assigned to siloxane stretching vibrations.
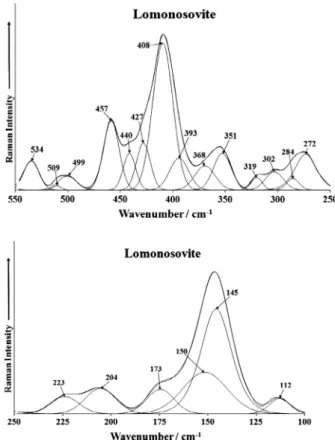
The Raman spectra of lomonosovite in the 250–550 cm 1and 100–250 cm 1spectral range are displayed inFig. 5a and b. The Raman bands at 499, 509 and 534 cm 1are assigned to the PO
4 3
m
4bending modes. The series of Raman bands at 408, 427, 440 and 457 cm 1 are assigned to the PO4 3
m
2 bending modes. The observation of multiple bands in both the phosphate stretching and bending regions supports the concept that the symmetry of Fig. 2.EDS analysis of lomonosovite.
Fig. 3.(a) Raman spectrum of lomonosovite (upper spectrum) and (b) infrared spectrum of lomonosovite (lower spectrum).
Fig. 4.(a) Raman spectrum of lomonosovite (upper spectrum) in the 750–1150 m 1
the phosphate anion in the structure of lomonosovite is severely reduced. Raman bands at 272, 284, 302, 319, 351 and 368 cm 1 are thought to be related to metal oxygen (TiO) stretching vibra-tions. Raman bands in the 100–250 cm 1spectral range are consid-ered to be external vibrations.
It is interesting that the formula of lomonosovite contains no water or hydroxyl groups, yet a spectrum as illustrated inFig. 6a, shows intensity over the 2900–3800 cm 1spectral range. A broad spectral profile is observed in this spectrum with resolved infrared bands at 3189, 3373, 3486 and 3590 cm 1. These bands are attrib-uted to water stretching vibrations. The water may simply be adsorbed on the surface of the lomonosovite or may be bonded to the phosphate units in the structure of lomonosovite. Further evidence for the involvement of water on the surfaces of lomono-sovite is confirmed by the infrared spectrum over the 1300– 1800 cm 1 spectral range as reported in Fig. 6b. Infrared bands are observed at 1591, 1616 and 1671 cm 1. These bands are assigned to the water bending modes. The observation of three bands implies that water exists in different molecular environ-ments with differing hydrogen bond strengths.
Conclusions
Lomonosovite is rare multi-anion mineral of formula Na5Ti2(Si 2-O7)(PO4)O2. The mineral contains both phosphate and siloxane units and the Raman and infrared spectroscopy reflects the pres-ence of these units. The SEM image shows a homogeneous phase. Qualitative chemical analysis gave Si, P, Na and Ti as the as major elements.
Raman bands observed at 909, 925 and 939 cm 1are associated with different types of phosphate units. Raman bands observed at 1070, 1080 and 1084 cm 1 are assigned to SiO antisymmetric stretching vibrations. Raman bands at 975 and 999 cm 1 are assigned to the SiO symmetric stretching vibrations. The series of Raman bands at 408, 427, 440 and 457 cm 1are assigned to the PO43
m
2 bending modes. The Raman bands at 499, 509 and 534 cm 1 are assigned to the PO4 3
m
4 bending modes. Infrared bands which are attributable to water stretching and bending vibrational modes supports the concept that water is involved in the structure of lomonosovite.
Acknowledgements
The financial and infra-structure support of the Discipline of Nanotechnology and Molecular Science, Science and Engineering Faculty of the Queensland University of Technology, is gratefully acknowledged. The Australian Research Council (ARC) is thanked for funding the instrumentation. The authors would like to acknowledge the Center of Microscopy at the Universidade Federal de Minas Gerais (http://www.microscopia.ufmg.br) for providing the equipment and technical support for experiments involving electron microscopy. L. Graça thanks to CNPq for scholarship.
References
[1]V.I. Gerasimovsky, Doklady Akad. Nauk. 70 (1950) 83–86.
[2]W. Massa, O.V. Yakubovich, V.V. Kireev, O.K. Mel’nikov, Solid State Sci. 2 (2000) 615–623.
[3]F. Camara, E. Sokolova, F.C. Hawthorne, Y. Abdu, Min. Mag. 72 (2008) 1207– 1228.
[4]A.P. Khomyakov, G.N. Nechelyustov, R.K. Rastsvetaeva, K.A. Rozenberg, Zap. Rossiiskogo Min. Ob 137 (2008) 43–52.
[5] N.V. Chukanov, I.V. Pekov, L.V. Olysych, W. Massac, O.V. Yakubovich, A.E. Zadov, R.K. Rastsvetaeva, M.F. Vigasina, Kyanoxalite, a New Cancrinite-Group Mineral Species with Extraframework Oxalate Anion from the Lovozero Alkaline Pluton, Kola Peninsula., Geology of Ore Deposits, 2010 Pleiades Publishing Ltd., vol. 52, 2010, pp. 778–790.
Fig. 5.(a) Raman spectrum of lomonosovite (upper spectrum) in the 250– 550 cm 1 spectral range and (b) Raman spectrum of lomonosovite (lower
spectrum) in the 100–250 cm1spectral range.
Fig. 6.(a) Infrared spectrum of lomonosovite (upper spectrum) in the 2900– 3800 cm1 spectral range and (b) infrared spectrum of lomonosovite (lower
spectrum) in the 1300–1800 cm1spectral range.
[6] I.V. Pekov, N.V. Zubkova, Y.E. Filinchuk, N.V. Chukanovc, A.E. Zadov, D.Y. Pushcharovsky, E.R. Gobechiya, Shlykovite KCa[Si4O9(OH)]3H2O and
Cryptophyllite K2Ca[Si4O10]H2O, New Mineral Species from the Khibiny
Alkaline Pluton, Kola Peninsula, Geology of Ore Deposits, 2010 Pleiades Publishing, Ltd., vol. 52, 2010, pp. 767–777.
[7]I. Pekov, Minerals first discovered on the territory of the former Soviet Union, Ocean Pictures, Moscow, 1998.
[8]M.J. Lee, J.I. Lee, S.D. Hur, Y. Kim, J. Moutte, E. Balaganskaya, Lithos 91 (2006) 250–261.
[9] U. Kramm, S. Sindern, Timing of Kola ultrabasic, carbonatite and phoscorite– carbonatite magmatism, Mineralogical Society Book Series, 2004.
[10] V.N. Yakovenchuk, G.J. Ivanyuk, Y.A. Pahomovsky, Y.P. Men’shikov, Minerals of the Khibiny Massif, Zemlya, Moscow, 1999 (in Russian).