Performance Analysis of an SRI Screen Based on Employment
Quality in High and Low Human Capital Industries
- International Evidence
NOVA SBE / Maastricht University School of Business and Economics Lisbon, 30th December 2014 da Costa Avelar, M.
ID: 828 / i6000558
Table of Contents
1. Abstract ... 3
2. List of Figures ... 4
3. List of Tables ... 5
4. Introduction ... 6
5. Literature Review ... 8
The Basis for this Study ... 8
Employee Satisfaction and Firm Value ... 9
Traditional View on Motivation ... 14
Mispricing of Intangible Assets ... 15
Other SRI Screens and their Effect on Portfolio Performance ... 18
6. Data and Summary Statistics ... 23
Division of Companies ... 23
Scoring ... 27
Descriptive Statistics ... 29
7. Methodology ... 30
8. Results ... 33
9. Discussion and Implications of Results ... 38
10. Conclusion ... 42
Appendix ... 44
1.
Abstract
2.
List of Figures
Figure 1: Impact of employee satisfaction on long-run stock returns within the company (upper scheme) and in the stock market (lower scheme) ... 9
3.
List of Tables
Table 1: Division of Industries ... 26
Table 2: Risk-adjusted returns of equal-weighted best-in-class portfolios (risk-free rate) ... 33
Table 3: Risk-adjusted returns of value-weighted best-in-class portfolios (risk-free rate) ... 35
Table 4: Risk-adjusted returns of equal-weighted best-in-class portfolios (industry return) ... 36
Table 5: Risk-adjusted returns of value-weighted best-in-class portfolios (industry return) ... 37
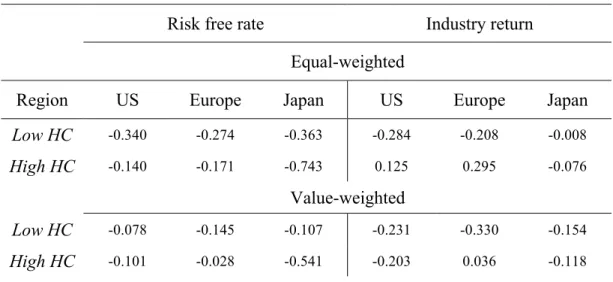
Table 6: Alpha coefficients ... 42
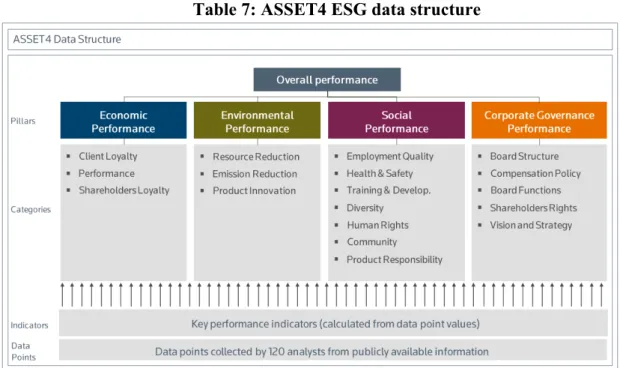
Table 7: ASSET4 ESG data structure ... 44
Table 8: Scoring components ... 44
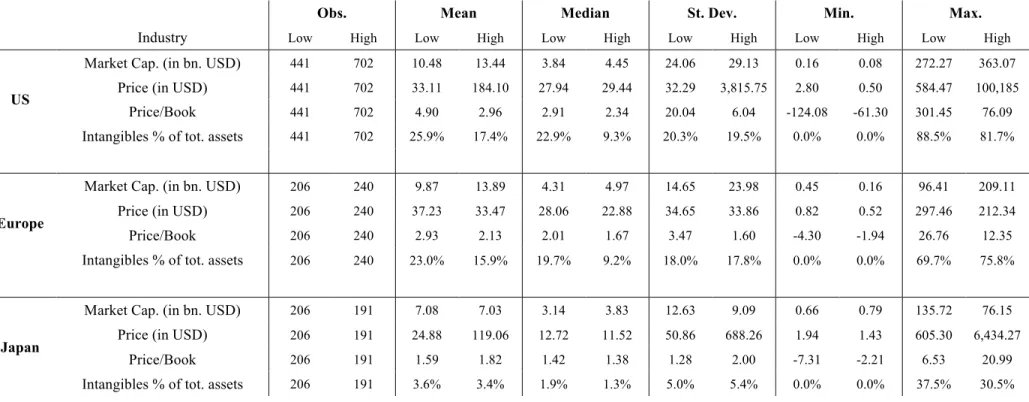
Table 9: Descriptive statistics of industries per region ... 45
Table 10: Weighting of payroll data for average payroll calculation per company ... 46
4.
Introduction
Socially responsible investing (SRI) is a promising idea, as it gives the opportunity to earn higher returns on investments while at the same time making ethically and socially acceptable investments. Apart from the financial gains an investor might also gain non-financial utility from these sorts of investments, by doing something “good”. It is therefore not surprising that it is given more attention in the last couple of years and is also applied by more funds in the market. From 1995 until 2012, the number of funds that incorporated environmental, social and corporate governance (ESG) factors in their investment selection process in the US increased from 55 to 720, while the total net assets increased from $12 billion to $1,013 billion (SIF, 2012, p.11). Other global pressures, like global warming and overall resource depletion give the topic further importance and SRI provides investors with an alternative to conventional investment strategies. Many studies have put emphasis on this subject, analyzing different sorts of screens in different geographical areas or analyzed, for instance, SRI fund performances. The empirical results seem to differ quite significantly and seem to depend on the applied screens, regions and sample periods on which they are applied to.
This study focuses on analyzing the performance of a single positive SRI screen in form of employment quality, applied to two different types of industry, namely human capital intense industries and less human capital intense industries. One of the main hypotheses of this study is that the screen should work better and result in statistically significant positive four-factor alphas when applied to human capital intense industries. Positive alphas are also expected for the application of the SRI screen on the less human capital intense industry. The results should be, however, economically smaller and statistically less significant compared to the high human capital application. As human capital might be valued higher in industries where it is most needed, competing for valuable employees and getting better employees could result in a competitive advantage for a firm in those industries. Getting “good” employees in an industry, where, for instance, innovation plays an important role, as for a company like Apple, certainly might be more important than for Walmart.
considered, where each factor can be seen as a question similar to: “Does the company claim to provide a bonus plan to most employees?”. The 10 questions cover three different themes that should be important in the determination of employee satisfaction: employment quality, health & safety and training & development. Two of the 10 questions are of numerical nature, while the others are qualitative Yes/No questions. The 20 companies with the highest score form a portfolio. This portfolio construction is repeated for high and low human capital intensity industries. In order to determine whether a specific industry is of high human capital intensity, an income-/cost-based approach is used. Data from the U.S. census bureau on the payrolls per employee in each industry in the US from 2011 is used to identify the human capital intensity in each industry of the Thomson Reuters universe. The higher the payroll is, the more likely it is that human capital has a bigger importance, since it is valued higher. Following the logic from above, both equally- and value-weighted portfolios are constructed on a monthly basis and compared to each other. The commonly used Carhart (1997) four-factor model, consisting of the Fama and French three-four-factor model and a momentum four-factor, is used in order to assess the performance of each portfolio.
This study extends general studies on SRI screen performances. By adding an industry perspective, especially the prior work of Edmans (2011) is expanded. This study hypothesizes that certain SRI screens might work better in industries that are more related to the SRI screen than others. Furthermore, a different database is used, which might be considered less publicly available as the approach picked by Edmans. This will show whether similar results are obtained although a different database is used to assess the employment quality in the companies. Theoretically this might result in a better performance of the strategy, since investors might fail to incorporate the less publicly available information in their stock evaluations even more.
The paper is structured as follows. Section 5 gives a general overview of the existent literature on the topic of SRI and human capital. The section is followed by a description of the data, division into the industry types and the scoring used to assess the sample companies. Section 7 gives shortly the methodology, which is followed by the presentation of the results of this research. A discussion of the results and further implications of these follows in section 9. The last part concludes the paper.
5.
Literature Review
The Basis for this Study
Edmans (2011) forms the foundation for the idea of this study. He studies the relationship between employee satisfaction and stock returns in the long run in the US. As a measure for employee satisfaction he uses a list of the “Best companies to work for in America”. A variation of portfolios is then created using all companies, which are included in that list and the portfolios are updated on a yearly basis. A commonly used Fama-French-Carhart (FFC) four risk factor model is then evaluated to assess the performance. The results are significant alphas that are robust with different benchmarks. Two further findings are presented by Edmans. The first one shows that the market apparently does not value intangibles fully. The list used in his study is publicly available and Edmans leaves the market with enough time to incorporate it in the stock prices. The outperformance is still existent and indicates that the market does not include the information in the pricing of the stocks. His study further shows that SRI screens may improve portfolio performance, although there is also partially some evidence from other authors against it, as will be shown below.
According to the authors, diminishing returns might result from further increasing spending on employee welfare and can therefore be detrimental to stock performance.
Recognizing from both studies above, two points seem to be needed in order for employee satisfaction to have an impact on long run returns. First of all, employee satisfaction needs to be somehow beneficial to the firm value. It needs to affect, for instance, the motivation of workers for them to work better and therefore result in increased output or better products. Secondly, the stock market needs to misprice the effect of this employee satisfaction on firm value initially. This means that the potentially positive effect of employee satisfaction on the firm value is undervalued initially and correctly valued in the long run when it results in tangible outcomes, like increased earnings. The following two schemes (figure 1) show the above-mentioned logic. The upper scheme shows the process in the company and the lower one shows the process in the stock market.
In the following subsections, the possible effects of employee satisfaction on firm value and the mispricing of intangibles like employee satisfaction will be discussed. Additionally some evidence for the effects of other SRI screens on portfolio performance will be presented.
Figure 1: Impact of employee satisfaction on long-run stock returns within the company (upper scheme) and in the stock market (lower scheme)
Employee Satisfaction and Firm Value
The idea of employee satisfaction or human capital as an important part of a business is not new. Already in the early 20th century, Taylor (1911) writes about the importance of human capital in creating more efficiency in production. By now, the ideas he mentions are standard, but in 1911 these ideas were new and revolutionized production processes. Back then, no
High employee satisfaction
Attraction of good employees / increased human
capital
Increased tangible outcomes (like revenue)
Undervaluation of stock by the market
Suprise by higher tangible outcomes
than expected
training of the workforce was implemented and a general idea like “captains of industry are born, not made” was normal. An antagonistic relationship between the management of the company and normal workers was common and hindered efficient production. His ideas are related to ideas of motivation of the workforce to be beneficial for the company. Workers with satisfied needs and increased motivation perform better (Maslow, 1943). According to Taylor, prosperity for both employer and employee can be increased at the same time, without it being mutually exclusive. This increase in prosperity, however, can only be obtained through the highest efficiency possible. While in the old system workers were forced to produce more for the same pay and without knowing how to be more efficient, the newer system suggested making an analysis of the processes and introducing the best practices to the workers. Furthermore, workers should be paid accordingly higher, if their productivity increases, which would further increase the workers motivation. The higher pay would result in financial safety for the worker and thereby satisfy an essential need of him (Maslow, 1943). With this need satisfied the worker could be more focused on his work. The training of the workforce and overall increased cooperation between workforce and management were the essential new ideas of Taylor. Another factor that affected the productivity of workers back then was that workers were all paid the same amount, independent of their individual qualities. A worker that could perform the work better or faster therefore slowed down to the pace of the slowest worker to avoid unnecessary extra work. It would not make sense for him to work more than his colleague for the same pay. Taylor therefore argues that management and workers have to cooperate with each other and that workers have to be trained in order to achieve higher efficiency. Investing in human capital gives an advantage against competitors in his opinion. It is worth mentioning that his analysis is based on manufacturing companies and not e.g. the modern service companies of the 21st century. The main ideas, however, should be applicable also to those companies.
importance of human capital. An advertising agency looses its key executive employees, who afterwards form their own company and attract key accounts from the old business. In this case, the executive employees made use of their acquired personal relationships with old clients to lure them into the new business. While the damage of something like this can be quite small in some industries, it certainly is quite essential for an advertising agency. This means that employee satisfaction might be more valuable for industries were human capital is essential compared to industries were it plays a minor role in the business. This study will try to shed some light into this idea.
Some older studies explain the relation between wages and productivity. Higher wages could be related to higher employee satisfaction or at least be one factor of many that make employees satisfied and therefore might show how employee satisfaction could affect productivity. In one of these studies, Shapiro and Stiglitz (1984) show that increased real wages result in involuntary unemployment in the economy, which in turn serves as a threat to workers. The involuntary unemployment results, because companies hire less people for the higher real wage paid. If workers are caught shirking they face the punishment of being fired, which can be seen as a cost for the employee. This punishment would not exist, if there would not be unemployment. Without unemployment, workers would theoretically be fired and rehired at the same time. Therefore, higher wages indirectly reduce the probability of shirking and ultimately increase the productivity of employees. This explanation of the relationship of real wages and productivity is more indirect than the above-mentioned approach of Taylor (1911). Instead of having a direct effect on motivation of the workers, the productivity in this case is increased via the threat of unemployment that results from the higher real wages. Although the end effect is achieved through different channels, it is ultimately the same, namely higher productivity.
hired like a factor of production and works like capital. The idea of gift giving, however, takes into account the willingness of labor to cooperate with the firm to get the most productive use of labor. An employee that receives excess wages therefore likely responds with increased effort.
In a study about the relationship of corporate social responsibility (CSR) performance and shareholder value, Hillman and Keim (2001) show some evidence for increased shareholder value through better relations to employees. They argue that there are two types of CSR: stakeholder management and social issue participation. After analyzing data from the S&P 500, the conclusion is that the management of primary stakeholders, like employees, customers, suppliers and communities increases shareholder value, while social issue participation has a negative effect. Primary stakeholders, especially employees, might create intangible and valuable assets that may lead to competitive advantages. Furthermore, good relations to customers and suppliers might increase loyalty of these stakeholders. In contrast to this, social issue participation, defined as elements of CSR without direct relationship to primary stakeholders, seem to be shareholder value destroying. These results could explain, why some SRI screens work better than others. SRI screens that target issues of primary stakeholders, like the one used in this study, might improve portfolio performance more than others.
productivity. The shareholder reaction instead shows that they expect to bear the full cost of unexpected labor cost increases. These findings stand somewhat in contrast to what Shapiro and Stiglitz (1984) argue, although they do not analyze a direct link of labor compensation and shareholder value. They analyze the relationship between labor compensation and productivity instead. Higher productivity, however, should be associated with higher shareholder value.
In another attempt to see how employees might affect the firm value, Gorton and Schmid (2004) analyze the implications of labor representation in German supervisory boards on the decision making process within a corporation. They compare companies with equal representation of employees and shareholders in the supervisory board to companies, in which the employees are represented only by one third. Companies with higher representation of employees tend to trade on the stock market on a 31% discount compared to their peers. The authors argue that this might be the case, because the supervisory board representatives of the employees tend to maximize a different objective function than the supervisory board members picked by the shareholders. They simply act more in the interest of employees and might be less likely to accept restructuring processes that could harm employees, but would otherwise be beneficial for the firm. This reflects the idea of Taylor (1911) that there exists an antagonistic relationship between the workers and management, instead of cooperating with each other for the greater good. The existence of labor representation in supervisory boards is also in line with the ideas of Zingales (2000), who explains that employees are more powerful in modern firms. The shareholders in turn respond to the higher allocation of supervisory board seats to employees by linking the supervisory board compensation to the firm performance and taking on more debt. With this action, the shareholders align the interests of the supervisory board members to their own. Nonetheless, it is clear that these actions come with increased costs, which cause the stock market to trade the company at the above-mentioned discount.
industries in order to check whether an SRI screen based on employee satisfaction has indeed different effects on different types of industries. This approach assumes that human capital is a key asset in one industry and not in the other. Furthermore, the wage level, as mentioned by Akerlof (1982) to have a positive effect on employee performance, will be part of the score to evaluate the companies.
Traditional View on Motivation
Motivation is what ultimately drives a human being. It is therefore worth having a look at it in more detail in order to understand it also in a more work related context. Motivated workers are likely to perform better at their jobs than their unmotivated peers.
Human beings have five basic needs that need to be satisfied to some extent according to Maslow (1943). These basic needs are divided into the categories: physiological, safety, love, esteem and self-actualization. People that are satisfied in these needs are the ones that are the happiest and can focus on the things they can do best. Their motivation will be higher. If a person is of the creative type, the person will be able to come up with creative ideas or innovations. Employment satisfaction could partially satisfy three of the above-mentioned needs. The employer can provide safety to the employee, if the company provides a pension fund or health care. Furthermore, the employer can especially provide financial safety through increased wages. The findings of Taylor (1911) and Shapiro and Stiglitz (1984) that increased wages increase productivity are in line with the theory of Maslow (1943). As long as an employee is treated with respect and shown gratitude by his employer, the employment situation could have a positive effect on the esteem of the employee. Lastly, if the employee is exceptionally happy with his job and thinks that what he is doing is what he was kind of “born” to do, his self-actualization need is satisfied.
needs as well, if it wants to avoid excessive wages to keep employees satisfied. Employees would rather have all their needs satisfied instead of earning more money, as a substitute for certain needs. The logic is strengthened by the findings of Abowd (1989), who shows a negative relationship between labor compensation and shareholder value. It might indeed be the case that the lack of satisfaction of higher needs leads to excessive wages demanded by employees that ultimately lead to a decrease in shareholder value. Employee satisfaction therefore could safe costs due to less necessity to pay excessive wages.
Measures to satisfy the higher needs could be the decentralization and delegation of the organizational structure. This would free people from too close supervision and provide the employee with freedom to direct its own activities. Furthermore, employees would need to take more responsibility and thereby also satisfy their egoistic needs. Another suggestion by McGregor (1960) to increase higher level need satisfaction is the change of the performance appraisal process. In older systems the employee was evaluated as if it was a product and did not have any say in the whole process of performance assessment. The new approach should include the employee and give him the opportunity to set targets together with management. Management should, nonetheless, maintain in the leadership role in this process. With this approach, the employee once again needs to take more responsibility in appraising his own addition to the organization. The self-fulfillment and egoistic needs will be satisfied considerably more in the later approach.
The scoring that will be used in this study to assess each company’s employee satisfaction level will try to capture especially the satisfaction of the safety needs mentioned by Maslow (1943). The wage level and whether the company provides e.g. pension fund, health care or insurance will be part of the scoring. This should reflect the individuals financial safety obtained from the employment. Following the logic of Maslow, a higher scoring should mean a higher satisfaction of the basic needs, which in turn should result in higher performance by the individual.
Mispricing of Intangible Assets
intangible asset, this is not unlikely to be the case. It is difficult for the markets to evaluate the impact of intangible assets on financial performance. This difficulty often arises due to lack of information on the stock market side. It is therefore worth it to discuss some evidence on mispricing of intangibles of different sorts.
Aboody and Lev (1998) analyze the relevance of intangibles in form of software capitalization and its amortization to find that these are significantly associated with future earnings. The capitalization of software can be seen as a random factor affecting the earnings. This randomness is difficult to be incorporated by analysts in their forecasts of earnings, which results in wrong forecasts of earnings. Eventually these wrong forecasts lead to wrong estimates of stock prices.
studies, which find that markets misprice intangible assets and are slow in adjusting their expectations based on the intangible asset (Edmans, 2011). In this case the market seems to incorporate the information before it materializes in increased sales. It is worth mentioning, however, that advertising is not necessarily an intangible as employee satisfaction is. It is therefore easier for the investors to quantify it and likely forecast the impact on e.g. sales. Furthermore, there seems to be a negative impact on the stock price when competitors of similar size advertise heavily.
Instead of R&D expenditure, Deng, Lev and Narin (1999) use patent citations and try to predict market-to-book ratios (M/B) and stock returns. They argue that only disclosing R&D spending is not enough for investors to evaluate the quality of the research done. Patent-related measures seem to reveal more information on the nature of research, e.g. whether it is basic or applied research, and about the outcomes of research. Indeed they find evidence that patent-related measures are positively and statistically associated with M/B and stock returns. The link to stock returns is weaker though than for M/B, because stock returns only reflect new information that is initially not known to investors, while M/B shows the growth expectations independent of the moment when the information arrives at the market. In other words, stock prices contemporaneously incorporate the information embedded in R&D intensity better, if not fully.
The evidence on intangible assets to be mispriced by markets seems to be quite strong. This mispricing might lead to abnormal stock performance in the long run of companies that invest in intangible assets, given that those translate into improved tangible assets in the future. This research will also focus on an intangible asset, namely employee satisfaction. It differs therefore from advertising and R&D expenditures analyses. Following Ben Tanfous (2013) and his analysis of the impact of the training of employees on value creation, this factor is part of the scoring to assess the employment quality level of each company in the data set. Obtaining positive results in this study will also depend on the level of mispricing of the securities by the stock market in the short run.
Other SRI Screens and their Effect on Portfolio Performance
There exist several studies on the performance of SRI screens or fund performances that make use of SRI screens. These studies analyze positive and negative screens for different regions in the world. The results are ambivalent and can be divided into three categories. Some authors find enhancing effects of SRI screens on performance, others find no statistically significant effects or mixed effects and again others do find SRI screens to be detrimental for performance. Evidence for each of the possible outcomes will be discussed, beginning with the positive evidence.
In an early work on the subject of SRI, Moskowitz (1972) argues that socially sound investments are not necessarily financially unsound. According to him, corporations that are aware of socially important topics possess a special sensitivity that might enable them to outperform their competitors. He identifies certain companies that exert socially responsible behavior. His study is, however, not specific in terms of which social aspects are important. Hillman and Keim (2001) in contrast do make a distinction between social responsibility that affects stakeholders or not. The later being value destroying, while the first increases shareholder value. Also Brammer et al. (2006) divide social performance into three measures, namely community performance, environmental performance and employee performance.
lower efficiency, are constructed and evaluated. The portfolio with the highly efficient companies outperforms the other portfolio and the results are robust, when including transaction costs or accounting for investment styles, industry specific factors or market sensitivity. On the one hand, this finding is somewhat unexpected, as it might be argued that companies that comply with environmental standards face costs that ultimately lead to higher prices for their products and decrease shareholder value. On the other hand, scoring high on eco-efficiency might improve the efficiency of input-output and lead to a competitive advantage. The impact on the stock prices, however, depends on the ability of the market to correctly price the possible future financial outcomes resulting from the environmental responsibility. Instead of using an environmental screen, Edmans (2011) and Edmans, Li and Zhang (2014) use a positive social screen in form of employee satisfaction and find positive SRI effects.
Many studies do not find either economically or statistically positive or negative effects of SRI. These results confirm the ideas that the markets do not price social responsibility. Hamilton, Jo and Statman (1993) indirectly analyze the performance of SRI screens by looking at mutual fund performances that apply SRI screens. They find that socially responsible mutual funds do not have statistically significant excess returns and also do not outperform non-socially responsible mutual funds. The sample of socially responsible mutual funds might be, however, rather small, since it only consists of 32 funds. According to the results, investors would therefore neither lose nor gain from investing in socially responsible funds. Since the mutual funds apply several SRI screens at the same time it is not clear whether specific SRI screens increase portfolio performance, while others have negative effects. This study will focus on a single SRI screen instead.
ethical funds underperformed the conventional funds in initial sub periods. This could be caused by a learning phase that ethical funds had to undergo.
Extending the study by analyzing Canadian data, Bauer, Derwall and Otten (2007) find very similar results. No significant difference between ethical and conventional mutual fund performances is found. One major difference to previous studies is that the authors check whether ethical fund returns correlate more with ethical index returns or conventional index returns. The surprising result is a higher correlation to the conventional index returns, thereby indicating that the ethical component of ethical mutual funds might not be as high as expected.
Schröder (2007) criticizes somewhat the use of investment funds to analyze SRI performances and uses SRI indices to assess SRI screen performance instead. Two main reasons justify the use of indices instead of funds. First of all, it might be difficult to assess correctly the transaction costs of investment funds. Secondly, the impact of portfolio managers needs to be taken into account in investment funds. Both reasons might make it more difficult to attribute possible outperformance strictly to the SRI screens. This approach seems to allow a more direct measurement of the SRI screen effect. His results are, nonetheless, in line with a non-existent statistical difference between SRI equity index returns and conventional benchmark indices like MSCI indices. Guerrard (1997) obtains similar conclusions. He compares the returns of a screened equity universe with an unscreened universe for the period of 1987-1994 and does not find statistically different results between both. The differential for both universes is only 15 basis points for equally weighted annualized stock returns. Furthermore, he argues that some of the apparent positive effect of SRI in other studies might occur due to the fact that the exposure of the constructed portfolios to large cap and growth stocks is higher. These stocks might be the actual drivers of the performance. The social screens he uses are military, nuclear power, product (alcohol, tobacco and gambling) and environment.
best-in-class approach to invest in socially responsible companies does increase returns. Not investing in companies that produce immoral products, however, puts the socially responsible investors in a disadvantage. These so called “sin stocks” seem to outperform other stocks and therefore compensate conventional investors for the outperformance of the socially responsible stock in the portfolio of responsible investors. The outperformance of “sin stocks” is in line with the evidence provided by Hong and Kacperczyk (2009).
since some screening is labor intensive and might result in relevant information advantages that conventional funds do not have.
Geczy et al. (2003) also find costs associated with SRI constraints. They analyze SRI mutual funds and conclude that the costs depend on, which asset pricing model is used and whether investors believe in the stock-picking abilities of fund managers or not. Using only the CAPM model and believes in low managerial skills results in lower differences. Models with higher exposure to size, value and momentum effects, like the FFC model, reveal a much higher cost of the SRI constraint. The cost is then around 30 basis points per month. The authors do, however, acknowledge that investors might obtain non-financial utility from investing socially responsible, which is not accounted for in their study and is difficult to be quantified. Therefore the results can be seen as lower bounds of the non-financial utility that investors need to get for them to be willing to invest socially responsible.
Instead of using fund data, Brammer et al. (2006) use firm level data, like Schröder (2007). They furthermore use disaggregated social responsibility data. The disaggregated data on the social performance allows distinguishing better, which part of social performance actually drives the financial performance in form of stock returns. The social performance is divided in three measures: community performance, environmental performance and employee performance. The composite measure of all three performance factors shows a negative relation with stock returns. A look at the three measures individually reveals though that the first two measures show a negative correlation with stock returns, while the employment factor is slightly positively correlated, which is in line with the results of Edmans (2011) and Edmans et al. (2014). These different effects for the three measures, suggests that a more detailed look at social performance components might make more sense than just looking at an overall measure of social performance. Hillman and Keim (2001) also suggest a more detailed look, instead of a general “score” for overall social performance.
reasons why a closer look on, and further investigation of employment satisfaction as an SRI screen might be worthwhile.
Although many studies focus on fund performances using SRI screens, this study will refrain from doing so as it is interested in testing a specific SRI screen. Since most funds use multiple SRI screens this would make it difficult to assess the performance of a single screen. Evidence that different SRI screens have different effects on performance further motivates this approach. Therefore, firm-level data instead of fund data will be used. Following the logic of e.g. Derwall et al. (2005), the portfolios to be tested will be constructed with a best-in-class approach. The model to be used is the FFC model, as it captures risk better than, for instance, the CAPM. Renneboog et al. (2008) also argue in this way.
6.
Data and Summary Statistics
The following analysis is done for three distinct regions, which are the US, Europe (consisting of all countries that adopted the Euro in 1999) and Japan. The total sample is composed of 2,019 companies, which can be divided as follows into the different regions: 1,143 from the US, 446 from Europe and 430 from Japan. Some information on industry classifications is retrieved from the U.S. census bureau and will be explained more detailed later on. In order to continue the analysis, all companies need to be identified as either being part of a high human capital intense industry or a low one. The following paragraphs will explain the process of the industry division, the score construction to assess the employment quality and discuss the descriptive statistics of the resulting industry divisions.
Division of Companies
earlier. They mention four reasons for why this is the case. First of all, workers of each education category are assumed to be perfect substitutes for workers of all other categories, which is not necessarily the case. Secondly, it assumes that workers with, for instance, 15 years of education are 15 times as productive as a worker with only one year of schooling, independent of wage rates. As a third reason they criticize that the elasticity of substitution across workers of different groups is assumed constant all the time. Lastly, one year of schooling is assumed to increase the skill by the same amount all the time. Instead of average years of schooling, Mulligan and Sala-i-Martin (2000) use labor income to construct a measure for human capital. The reasoning behind this logic is as follows. In case that a person studies something very useful from a production point of view, the wage of the person would be accordingly higher in the market than for somebody that maybe studied longer, but studied a field that is not as useful or not demanded. A worker that produces a lot is valued more and therefore earns more.
The labor income approach is favored in this study over the schooling years approach, not only due to easier data availability for the first, but also due to the convincing logic behind it. The market determines how valuable a worker is and this can be easily seen through a workers wage.
Following this logic, information on wages from the U.S. census bureau for each industry classification is retrieved. It published in December 2013 a list with data on the number of firms, number of establishments, employment, and annual payroll by enterprise employment size for the United States in 2011. All industries are listed according to their North American industry classification system (NAICS) code. For each industry classification the average annual payroll per employee is calculated. It has to be noted that this approach uses the US data as some kind of benchmark and assumes that wage distributions in the other two regions to be analyzed are similar to the one in the US. Since this study is more interested in the wages of an industry relative to another industry and not in absolute terms, the assumption seems to be legitimate.
representation for the division of industries. As the industry classification of the companies in the datastream universe follows the Thomson Reuters Business Classification (TRBC), the different classification codes have to be matched to the NAICS codes retrieved from the U.S. census bureau. Another point to be considered is the fact that a company can be active in several industries at the same time. The main revenue driver e.g. might be gold ore mining, while the second and third highest revenue driver might be copper or nickel ore mining. This should be considered when attributing the payroll data from the U.S. census bureau to the individual companies. Not taking this information into account might give misleading results in the ultimate industry division.
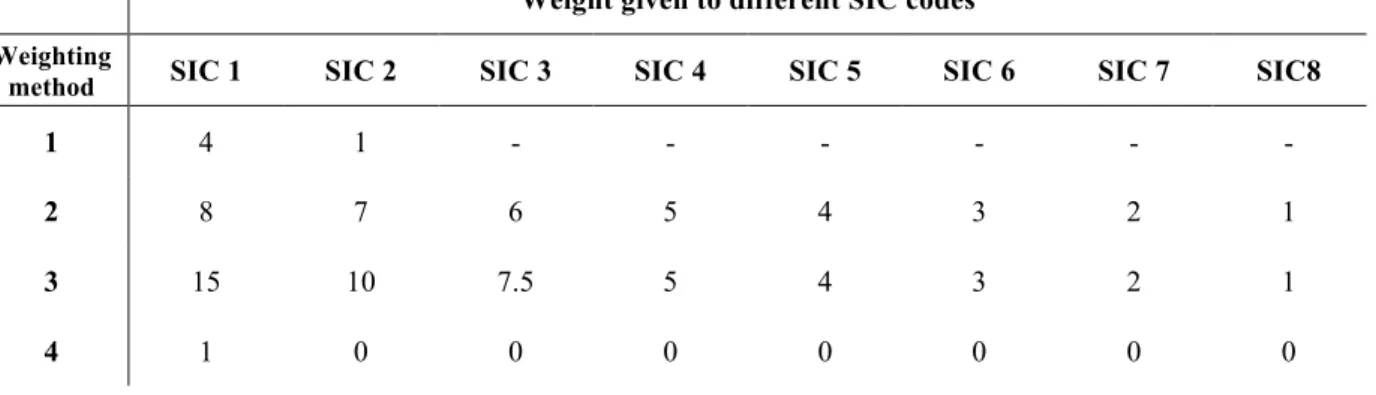
To solve this issue, datastream offers the possibility to retrieve up to eight standard industrial codes (SIC) for each company according to the revenue level it obtains from a certain industry. In other words, this means that retrieving the “SIC 1” from datastream for a company gives the industry code in which the company gets the biggest share of its revenues from. The “SIC 8” gives then in contrast the least relevant revenue driver from the perspective of the company. All SIC codes for all companies in the Asset4 ESG dataset are retrieved for the analysis.
With the SIC codes given, each of them is matched to the corresponding NAICS code. This matching is done with the help of an excel file, which is also provided by the U.S. census bureau and contains SIC codes and their equivalent NAICS codes. Afterwards, the average annual payroll data obtained earlier is matched to the SIC codes from each company. By this time, each company is linked to several payrolls of each industry in which it generates revenues according to its eight SIC codes. Once again it is worth mentioning that it is assumed that the overall payroll distribution throughout the industries worldwide are the same as in the US and the US data from the census bureau is applied to all international companies in the Asset4 ESG universe. Companies with missing data are excluded from the analysis as well as companies where the matching from SIC to NAICS does not work properly.
payrolls using four different weighting strategies is then calculated in order to take into account the possibility that for some companies their revenue is more equally distributed throughout all industries it is involved in, while others might be more specialized in a single industry. The different weighting methods can be seen in table 10 in the appendix. Once again, after having the four averages per company an overall average is constructed, which is the final payroll attributed to the company. As mentioned above, Thomson Reuters uses its own classification system (TRBC). Therefore the average of all companies in a certain TRBC category is taken to get the average annual payroll per employee in that specific TRBC. The TRBC industries that rank in the top 50% are then considered the human capital intense industries. In the following table (table 1), the resulting division of industries is shown.
Table 1: Division of Industries
High Human Capital Intensity Low Human Capital Intensity
Investment Banking & Investment Services Collective Investments
Oil & Gas
Biotechnology & Medical Research Banking Services
Holding Companies
Residential & Commercial REITs Insurance
Pharmaceuticals
Electronic Equipments & Parts Communications & Networking
Semiconductors & Semiconductor Equip. Uranium
Natural Gas Utilities Metals & Mining Multiline Utilities Renewable Energy Electric Utilities & IPPs
Oil & Gas Related Equipment and Services Coal
Chemicals
Media & Publishing Software & IT Services
Computers, Phones & Household Electr. Aerospace & Defense
Healthcare Equipment & Supplies Freight & Logistics Services
Paper & Forest Products
Diversified Trading & Distributing Telecommunications Services Professional & Commercial Services Construction & Engineering
Office Equipment Industrial Conglomerates Healthcare Providers & Services Construction Materials
Machinery, Equipment & Components Containers & Packaging
Automobiles & Auto Parts Real Estate Operations Transport Infrastructure
Personal & Household Products & Services Water Utilities
Beverages
Passenger Transportation Services Homebuilding & Construction Supplies Leisure Products
Food & Tobacco Household Goods Food & Drug Retailing Textiles & Apparel
Hotels & Entertainment Services Other Specialty Retailers
Scoring
In order to rank the companies on their employment quality, a score is formed using the Asset4 ESG dataset from Thomson Reuters. It is a dataset that is focused on environmental, social and governance (ESG) information, which covers over 4000 companies globally. Especially for SRI investing it is very valuable as it has more than 250 key performance indicators and more than 750 individual data points on ESG. The data is structured into four pillars: economic, environmental, social and corporate governance performance. For the purpose of this study, however, the focus will be on the social performance of the company. The social performance pillar of the dataset has seven subcategories, which in turn consist of several datapoints (table 7 in the appendix). The database already proved to be valuable in terms of its capability to be used to produce significant positive alphas. Eccles et al. (2013) use the database to form high and low sustainability company groups. An analysis of the stock performance of both groups then reveals that the high sustainability group outperformed the low sustainability group. It is therefore valid to assume that the database contains valuable information for investors that can be used to obtain alphas. This study is focused on an employment quality screen, hence only three of the above-mentioned subcategories remain relevant: employment quality, health & safety and training & development.
score is formed, while Edmans uses list inclusion in the “Best companies to work for”-list published by the Fortune magazine as a signal to invest in a company. This last point should not make a big difference though, since Fortune takes several aspects of employment quality into consideration, when the companies are listed on their list. Overall, it can be said that the approach at hand is more “raw” and does not include as many details and factors. For the construction of the “Best companies to work for”- list, more aspects are taken into account. This approach should, nonetheless, contain enough information to assess properly the employment quality in each company.
Out of the 10 factors used to form the score, two are of numerical nature, like the average salaries and benefits in U.S. dollars, while the other 8 factors are answers to yes/no questions. All factors are therefore transformed into z-scores to better combine them in an overall score. Especially for the yes/no questions a z-scoring approach is favorable as it brings more differentiation into the data. Asset4 ESG provides z-scores for some of the factors, but these are calculated using the global database. Since only three distinct regions are relevant in this study, the z-scores for each company are calculated manually, depending on all companies in its region. The transformation into z-scores follows the logic of Asset4 ESG. When a firm answers with a “yes” to the factor during a month, it is assigned a “1”, while a “no” results in a dummy value of “0”. It is not clear how Asset4 ESG deals in its z-scoring with companies that for some reason do not have data for that factor. These companies are therefore excluded from the z-score estimation by assigning them a dummy of “-“. This guarantees that they have no influence on the z-scoring of the other companies. The standard approach to calculate a z-score is then followed. The mean and standard deviation for all the companies in the region and in that specific month is used for that purpose. This procedure is repeated for every month. It is worth noting that one factor consists of two yes/no questions at the same time. In this case the factor equals a value of “0.5”, if only one of the two questions is answered positively.
Descriptive Statistics
All data for the descriptive statistics that will be discussed in this section are taken from datastream. The intangibles as a percentage of total assets, is constructed after data retrieval, given the data from datastream. The percentage is obtained by a simple division of “net (total) intangible other assets” by “total assets”.
The descriptive statistics of each industry division are discussed for each region and reveal some surprising insights for some of the characteristics (table 9 in the appendix). Beginning with a look at the market capitalization, companies being part of the high human capital industries are bigger than low human capital companies in the US and Europe. Given that the standard deviation is quite high though, the difference does not appear to be that big. In the US there is a difference in the mean of $2.96 billion, while for Europe the difference is slightly higher at $4.02 billion. In Japan both the differences in the mean and standard deviations are lower, indicating that the companies are closer to each other in terms of market capitalization. In fact, the maximum market capitalization in Japan is found in the low human capital industry.
The prices per stock seem to have more extreme variation in both the US and Japan. Means between the industry divisions are more different in both regions and the standard deviations are high. These results do seem to be influenced by extreme outliers, when looking at the maximum stock price in each region. In the US, the maximum value is $100,185.46 per stock, which is attributed to Berkshire Hathaway. This obviously has a big impact on the descriptive statistics. Looking at the median reveals that the differences are not as big as suggested by the mean. For all three regions, the median does not seem to be of a big difference when comparing both industry divisions to each other.
surprising that a look at the mean differences between the industry divisions in the US and Europe indicates that the low human capital industries show higher P/B ratios. For the median it is even for all three regions. This observation might be an indication for a wrong division of the industries. It could be that some of the supposedly low human capital industries are in fact human capital intense. The analysis of the results from this study needs to take this into consideration. A misspecification of high and low human capital intense industries influences strongly the results.
The intangibles as a percentage of total assets show a pattern that is consistent with the P/B ratio and against the expectation. High human capital industries are expected to have more intangibles relative to their total assets, as they should have more intangibles, such as patents and copyrights. These higher levels of intangibles are usually the result of higher human capital. However, the low human capital industry companies show higher percentages in the US and Europe. A look at the median confirms this pattern. For Japan, the difference is almost non-existent, although it still shows higher values for the low human capital industry.
Overall, it is worth keeping in mind from this analysis that out of all regions, Japan seems to have the most homogeneous structure out of all three regions, when comparing the two industry types. Furthermore, the P/B ratio and the ratio of intangibles to total assets might raise the concern that the divisions of the industries are not correct. This might have strong implications for the main analysis later on, as it is a cornerstone for the performance evaluation of the portfolios.
7.
Methodology
the employment quality information in its stock pricing, when for some months, the data is published before the 6th of the month. The time given to the market to adjust is, however, not as much as in the paper of Edmans (2011), who gives the market one month to adjust.
The best-in-class portfolio out of each industry type consists of 20 companies with the highest overall scoring. This approach is favored over the percentile approach, because equally sized portfolios should be compared to each other. Given that after the division of the industries, some industry portfolios are bigger than the others, a percentile approach would have resulted in different sized portfolios. It has to be noted that during some months, some companies have the exact same score. In this case it could occur that the best-in-class portfolios are slightly bigger than only 20 companies. It is also worth noting that using 20 companies to construct the portfolios is a subjective choice. In this study, 20 companies are assumed to be the least amount necessary to guarantee a decent diversification level.
The model to be estimated then looks as follows:
𝑟
!,!−
𝑟
!,!=
𝛼
+
𝛽
!𝑟
! !−
𝑟
!,!+
𝛽
!𝑟
!!"#
+
𝛽
!𝑟
!!!"
+
𝛽
!𝑟
!!"!
+
𝜀
!,!
where:
𝑟
!,! = return on the portfolio;𝑟
!,! = one-month U.S. T-bill rate;𝑟
! != return on a
region’s value weighted market portfolio;
𝑟
! !"#= market capitalization factor;
𝑟
!!!"
= B/M factor;
𝑟
!!"!
= momentum factor
The stock price data is retrieved from datastream and transformed into logarithmic returns. Although some of the companies ceased to exist during the time horizon, they are still included in the analysis to avoid any sort of survivorship bias.
In addition to taking the difference of the constructed portfolio return and the one-month U.S. T-bill rate as the dependent variable, also the difference to the overall corresponding high or low human capital industry portfolio return is used. Using this second approach should show whether the strategy produces higher and more significant alphas for the high human capital industry than the low human capital industry. One would expect the strategy to work better in industries where human capital is relatively more important, since having a better workforce should be valued more in those industries.
The decision to use the four-factor model from Carhart (1997) instead of the simple CAPM model or the three-factor model of Fama and French (1993) is simply due to the better risk adjustment. It is empirically shown by Carhart that the three-factor model does not account for the momentum strategy that is found by Jegadeesh and Titman (1993). Carhart then suggests adding this factor to the Fama and French model.
monthly rebalancing that is necessary to remain equal weights. Analyzing two kinds of portfolio weighting will serve as a robustness test for the results.
8.
Results
The results of the regression analysis are presented and discussed in this section. The discussion is organized per benchmark and starts with the risk-free rate as a benchmark followed by the industry returns as benchmarks. For both benchmarks, equal- and value-weighted portfolios are analyzed.
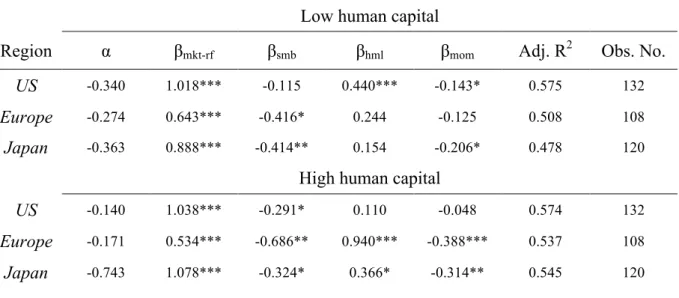
Table 2: Risk-adjusted returns of equal-weighted best-in-class portfolios (risk-free rate) Low human capital
Region α βmkt-rf βsmb βhml βmom Adj. R2 Obs. No.
US -0.340 1.018*** -0.115 0.440*** -0.143* 0.575 132
Europe -0.274 0.643*** -0.416* 0.244 -0.125 0.508 108
Japan -0.363 0.888*** -0.414** 0.154 -0.206* 0.478 120
High human capital
US -0.140 1.038*** -0.291* 0.110 -0.048 0.574 132
Europe -0.171 0.534*** -0.686** 0.940*** -0.388*** 0.537 108
Japan -0.743 1.078*** -0.324* 0.366* -0.314** 0.545 120
This table reports regression results of monthly returns of equal-weighted best-in-class portfolios using Carhart’s (1997)
four-factor model:
𝑟!,!−𝑟!,!=𝛼+𝛽!"#!!" 𝑟! !
−𝑟!,! +𝛽!"#𝑟! !"#+
𝛽!!"𝑟!
!!"+
𝛽!"!𝑟! !"!+𝜀
!,!
where ri,t is the return on equal-weighted best-in-class portfolios in month t for region i and rf,t is the return of the risk-free
rate. α is the intercept that captures the abnormal risk-adjusted return. rtm-rf,t, rtsmb, rthml and rtmom are, respectively, the Fama
and French (2012)’s regional factors on market, size, value and momentum.***, **, and * indicate significance at the 1%, 5%, and 10% level, respectively. The sample period is for the US from January 2002 to December 2012, for Europe from
January 2004 to December 2012 and for Japan from April 2003 to March 2013.
that none of the constructed best-in-class portfolios outperformed a simple investment at the risk free rate. Although the coefficients are insignificant, this is a bad sign for the portfolio performance in general.
The significance for the market risk premium factor was to be expected, since the regression has the risk free rate in the dependent and independent variable side. The high values of the factor for each portfolio indicate that the portfolios are moving with the market and are cyclical. The SMB factor is negative for all portfolios and significant in 5 out of 6 cases. This suggests a bias of all the portfolios towards large stocks, which in turn might be the result of the Thomson Reuters Asset4 ESG dataset to be overall biased towards large stocks. The HML factor is positive for all portfolios and significant in 3 out of 6 times. All portfolios are tilted towards the inclusion of value stocks and indicate once again that the overall dataset might be the reason for this. For the MOM factor, 4 coefficients are significant and all of them are negative. The negativity of the coefficients results from portfolio biases towards past “losers”. Overall, all portfolios throughout all regions and industries show the same signs although revealing differing significance levels.
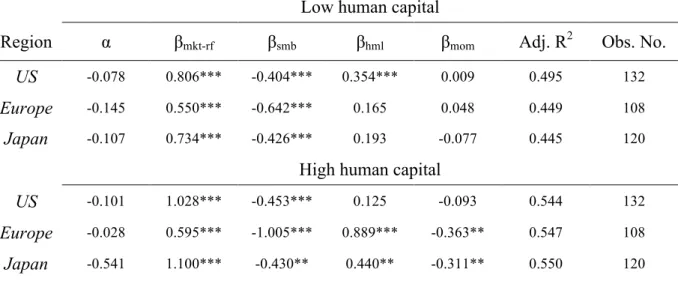
The regression results for the value-weighted best-in-class portfolios (table 3) are very similar in terms of the coefficient signs and significance levels. The alphas are again negative and not significant for any constructed portfolio. The low human capital portfolios for the US and Europe show different coefficient signs on the MOM factor. They are slightly positive, but not significant. The European and Japanese high human capital portfolios seem to be best captured by the four risk factors, as they are all significant. The interpretation of signs follows the previous logic. The results strengthen the idea that the SRI screen performs bad and is worse than the performance of the risk-free rate. The weighting method of the portfolios does seem to be irrelevant for this finding.
Since they are not statistically significant, this result has, nonetheless, only small relevance. The coefficients for the market risk premium are smaller, suggesting a smaller movement with the market, as was to be expected, because the benchmark changed. The bias towards large stocks is still existent, while the HML factor shows a mixed picture throughout the regions/industries and is only significant in 1 out of 6 portfolios. The MOM factor shows two significant biases towards past “losers” in the portfolios of Europe and Japan for the high human capital industry. The other 4 portfolios show insignificant mixed biases for the MOM factor. Overall, it is also worth mentioning that the adjusted R2 drops sharply when using industry returns as benchmarks. The models have therefore less explanatory power for the return differences to the industry returns than the risk free rate. This difference in adjusted R2 should be mainly driven by the previously high significance of the market risk premium factor, which is not as significant anymore.
Table 3: Risk-adjusted returns of value-weighted best-in-class portfolios (risk-free rate) Low human capital
Region α βmkt-rf βsmb βhml βmom Adj. R2 Obs. No.
US -0.078 0.806*** -0.404*** 0.354*** 0.009 0.495 132
Europe -0.145 0.550*** -0.642*** 0.165 0.048 0.449 108
Japan -0.107 0.734*** -0.426*** 0.193 -0.077 0.445 120
High human capital
US -0.101 1.028*** -0.453*** 0.125 -0.093 0.544 132
Europe -0.028 0.595*** -1.005*** 0.889*** -0.363** 0.547 108
Japan -0.541 1.100*** -0.430** 0.440** -0.311** 0.550 120
This table reports regression results of monthly returns of value-weighted best-in-class portfolios using Carhart’s (1997)
four-factor model:
𝑟!,!−𝑟!,!=𝛼+𝛽!"#!!" 𝑟! !
−𝑟!,! +𝛽!"#𝑟!
!"#+ 𝛽!!"𝑟!
!!"+
𝛽!"!𝑟!
!"!+𝜀 !,!
where ri,t is the return on value-weighted best-in-class portfolios in month t for region i and rf,t is the return of the risk-free
rate. α is the intercept that captures the abnormal risk-adjusted return. rtm-rf,t, rtsmb, rthml and rtmom are, respectively, the Fama
and French (2012)’s regional factors on market, size, value and momentum.***, **, and * indicate significance at the 1%, 5%, and 10% level, respectively. The sample period is for the US from January 2002 to December 2012, for Europe from
January 2004 to December 2012 and for Japan from April 2003 to March 2013.
capital portfolio significantly underperforms the low human capital industry, which is not necessarily in line with the expectations. Using the industry as a benchmark, the initial expectation was that the low human capital best-in-class portfolios should still outperform their industry peers. High human capital best-in-class portfolios should, nonetheless, also outperform their industry peers, but by a higher amount than the low human capital portfolios. None of the logics are confirmed when looking at both, equal- and value-weighted portfolios regression results. Three high human capital portfolio alphas of the regressions using industry returns are positive, while the other three are negative, with all alphas being insignificant. The SMB factor shows consistent results with the previously discussed models and shows a bias within all portfolios towards large stocks. The other factors do have mixed results and do not seem to follow a specific pattern.
Table 4: Risk-adjusted returns of equal-weighted best-in-class portfolios (industry return) Low human capital
Region α βmkt-rf βsmb βhml βmom Adj. R2 Obs. No.
US -0.284* -0.070* -0.118* 0.066 -0.016 0.039 132
Europe -0.208 0.018 -0.174* -0.094 0.064 0.034 108
Japan -0.008 -0.037 -0.364*** -0.047 -0.069 0.191 120
High human capital
US 0.125 -0.154*** -0.134 -0.234*** 0.038 0.221 132
Europe 0.295 -0.081* -0.243** 0.182 -0.123** 0.101 108
Japan -0.076 0.115** -0.370*** 0.025 -0.138** 0.244 120
This table reports regression results of monthly returns of equal-weighted best-in-class portfolios using Carhart’s (1997)
four-factor model:
𝑟!,!−𝑟!"#,!=𝛼+𝛽!"#!!" 𝑟! !
−𝑟!,! +𝛽!"#𝑟!
!"#+
𝛽!!"𝑟! !!"+
𝛽!"!𝑟! !"!+𝜀
!,!
where ri,t is the return on equal-weighted best-in-class portfolios in month t for region i and rind,t is the equal-weighted return
of the overall industry (high or low human capital). α is the intercept that captures the abnormal risk-adjusted return. rtm-rf,t,
rtsmb, rthml and rtmom are, respectively, the Fama and French (2012)’s regional factors on market, size, value and momentum.
***, **, and * indicate significance at the 1%, 5%, and 10% level, respectively. The sample period is for the US from
January 2002 to December 2012, for Europe from January 2004 to December 2012 and for Japan from April 2003 to March 2013.
needs to be considered when comparing the results is that the sample period is different. While Edmans (2011) has a sample period from 1984-2009, the sample period in this study is from around 2002 until 2013 (depending on the region), which is overall smaller and includes more recent data. Nonetheless, the results do somewhat stand in contrast to the initially expected results. The alphas are mostly insignificant and do not necessarily show the expected sign for its coefficients.
Table 5: Risk-adjusted returns of value-weighted best-in-class portfolios (industry return) Low human capital
Region α βmkt-rf βsmb βhml βmom Adj. R2 Obs. No.
US -0.231 -0.070 -0.129* 0.130* 0.030 0.068 132
Europe -0.330* 0.018 -0.102 0.047 0.131** 0.040 108
Japan -0.154 -0.102*** -0.096 0.093 -0.008 0.062 120
High human capital
US -0.203 -0.022 -0.015 -0.107 -0.060 0.006 132
Europe 0.036 0.050 -0.089 0.109 -0.161*** 0.159 108
Japan -0.118 0.130*** -0.305*** 0.018 -0.146*** 0.322 120
This table reports regression results of monthly returns of value-weighted best-in-class portfolios using Carhart’s (1997)
four-factor model:
𝑟!,!−𝑟!"#,!=𝛼+𝛽!"#!!" 𝑟! !
−𝑟!,! +𝛽!"#𝑟!
!"#+
𝛽!!"𝑟! !!"+
𝛽!"!𝑟!
!"!+𝜀
!,!
where ri,t is the return on value-weighted best-in-class portfolios in month t for region i and rind,t is the price-weighted return
of the overall industry (high or low human capital). α is the intercept that captures the abnormal risk-adjusted return. rtm-rf,t,
rtsmb, rthml and rtmom are, respectively, the Fama and French (2012)’s regional factors on market, size, value and momentum.
***, **, and * indicate significance at the 1%, 5%, and 10% level, respectively. The sample period is for the US from
January 2002 to December 2012, for Europe from January 2004 to December 2012 and for Japan from April 2003 to March 2013.
This is somewhat in line with the hypothesized effect of the SRI screen, which was that the SRI screen should work better when applied to human capital intense industries compared to other industries. Since these coefficients are insignificant and the coefficients for the region of Japan show a mostly reversed pattern, these observations seem to have weak relevance. It therefore looks like the screen does not result in the best-in-class portfolios to outperform their respective industries, as initially expected.
9.
Discussion and Implications of Results
Since the results are different to the initially expected outcome it is worth analyzing why this might be the case. There are several reasons that influence the presented results. First of all, it has to be clarified that there could be two main reasons, which in turn might have sub reasons explaining the outcome. The two main reasons are that the proposed hypothesis is correct, but that this study fails to prove it or that the hypothesis is wrong and therefore cannot be proven anyhow.
as discussed earlier. The availability of data on this matter can, however, represent a constraint. Furthermore a more extreme division of the industry composition might also lead to more favorable results. This means that instead of defining 27 out of the 54 industries as high or low human capital industries, only the top and lower 10 or 20 industries could be defined in this way, while excluding the other industries. A side effect would be a smaller sample size for each region.
Another vulnerable point in the methodology of this study is the overall construction of the score value. The constructed score might fail to assess the companies properly and therefore lead to the wrong identification of companies with favorable employment conditions. This failure of identification then results in constructed portfolios that are not conform with the positive SRI screen idea based on employee satisfaction. The usage of ten variables for the scoring might not fully capture the employee satisfaction in each company. The measure used by Edmans (2011), which is Fortunes’ “100 best companies to work for in America”-list, seems to be better at identifying this type of companies at least in the US. The scoring for Fortunes’ list is constructed by two thirds of a 57 question survey of the employees and the other third is the result of an evaluation provided by the Great Place to Works® Institute in San Francisco. The fact that the list inclusion is based to a great extent on the answers of the actual employees might play an important role in the lists identification power of employee friendly companies.
For this study, the size of the constructed portfolios is equal to 20 stocks, which is a subjective choice that is based on the idea of a minimum number of stocks necessary to obtain a decent diversification. Since each portfolio is based on either low or high human capital industries this might already affect the diversification characteristics of the portfolios in a negative way, since the exposure tends to be towards a certain type of industry. Meaning that 20 stocks could be too few to have a sufficiently diverse portfolio. Increasing the size of the portfolios might result in more diversified portfolios and increase overall performance of the portfolios. A comparison to the size of portfolios in the study of Edmans (2011) reveals that he uses significantly bigger portfolios with around 50 stocks.