A Work Project, presented as part of the requirements for the Award of a Master Degree in Economics from the NOVA - School of Business and Economics
Are There Different Cultures of Retention Across Portuguese
Regions? Evidence from Public Primary Schools
Diogo Maria Silva e Sousa1
#824
A project carried out under the supervision of Ana Balcão Reis, Maria do Carmo Seabra and Luís Catela Nunes
February 2017
1 I would like to thank everyone that helped me during the course of this work project. First, I would like to thank Professors
Maria do Carmo Seabra, Ana Balcão Reis and Luís Catela Nunes for the guidance, support and availability in this project. Second, I would like to thank my colleagues and friends for their helpful comments and words of motivation.
I also want to give thanks to the Society of Jesus for the essential role in my education as a student and as a man, in particular to “Colégio São João de Brito”.
Abstract
One of the possible explanations for the high levels of grade retention in Portugal is a prevailing
“culture retention” - the set of beliefs embedded in society regarding the benefits and costs of grade retention for pupils - that favours grade retention practice. This paper focuses on checking whether the culture of retention differs across Portuguese regions. This phenomenon can be identified if persistent differences on grade retention rates at the regional level are detected after controlling for grade retention rate determinants. The sample includes all the 4th-grade students enrolled in Portuguese public primary schools between 2007 and 2012. Results suggest that 4 out of 28 NUTS III2 regions have a regional-specific culture of retention.
Keywords: primary school; grade retention; culture of retention; persistency analysis
1. Introduction
Grade retention is defined as the situation in which a student is retained in the same grade for one more year instead of moving on to the next grade with the remaining colleagues (Pereira and Reis, 2014). According to Eurydice (2011), in most OECD countries the main cause of grade retention is the low academic achievement. The opinion about the impact of grade retention is far from gaining consensus among researchers. On one hand, defenders of this practice advocate that grade retention is an opportunity for low achieving students to deepen their knowledge in contents which were not well learned, allowing them to be better prepared for more complex subjects in the coming years. On the other hand, critics of grade retention defend that this practice is a source of instability for students, as they may suffer from decreased expectations from family and teachers, stigmatization, and difficulties in adapting to a new class (Nunes et al 2016).
With this in mind, it is crucial to understand the determinants of grade retention in order to enhance educational policy efficiency. Social-economic features, such as parents’ academic background, gender, or family income are variables that affect school performance and therefore influence grade retention probability. Furthermore, factors related to educational environments, such as school, teachers’ or peers' characteristics, also play an important role. Notwithstanding, the public belief that grade retention is beneficial to pupils – “culture of
retention” - can decisively affect its practice across countries. Portugal is one of the countries where this "culture of retention" seems to be more present (Eurydice, 2011).
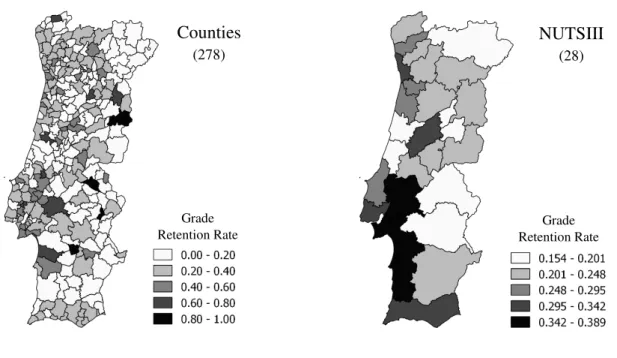
In Eurydice (2011), culture of retention has been defined has set of beliefs in favour to grade retention practice. Based on Goos et al (2013), we propose wider concept and identify culture of retention as a persistent set of beliefs concerning the benefits and costs of grade retention specific to a region. The existence of various cultures of retention could be one of the phenomena that explain the variability in regional grade retention rate. Since these beliefs are stable, diverse cultures of retention across regions would be characterized as a situation where persistent differences in the regional grade retention rates are observed even after controlling for grade retention determinants. Figure 1 exhibits the grade retention rate in Portuguese regions among 4th-grade students that had a negative score in both Portuguese language and Mathematics standardized national exams in 2007. Taking into account that this group only considers underperforming students, the differences in grade retention rate displayed in the figure may be attributed to the distinct cultures of retention prevailing in each region.3 This would probably be the case if this grade retention pattern is persistently observed. Are there different cultures of retention across regions? This is the question this research intends to address.
Figure 1 – Grade retention rate among 4th-grade students with a negative score in both
national exams in 2007.
To answer this question, we check if deviations from the expected grade retention rate given the students, schools and regional characteristics are persistently observed. Two strategies are used to isolate grade retention determinants, i.e. to create indicators for culture of retention. First, the grade retention among low achieving students is used. By selecting underperforming pupils, it is expected that the differences between the retained and promoted students in terms of individual and family characteristics are not significant. Yet, this sampling strategy leads to a very low number of observations per region, and consequently, persistency may be low for reasons not related to cultural effects. Hence a second strategy is employed, that consists in using the estimated regional dummies coefficients of a multilevel mixed-effects logistic regression for the probability of student retention. After controlling for individual, family and school characteristics, the coefficients of the regional dummies reflect the unexplained component of grade retention at the regional. If persistency is observed in the culture of retention indicators over the years, we conclude that regions do have a specific culture of retention. To analyse persistency, we estimate the autocorrelation and the year-to-year
Grade Retention Rate
Grade Retention Rate
Counties (278)
Spearman rank correlation coefficient of these series, and look at the stability of regions’ relative position. The data concerns students from 4th-grade Portuguese public primary schools from 2006/2007 to 2011/2012. Our research focuses on two regional levels: counties and NUTS III. Counties are the 2nd level administrative subdivision of Portuguese territory. Even though Portugal has a very centralized educational system, the level of support given by counties to education can vary significantly, which could be linked to different cultures of retention. Anticipating that results will yield high volatility, due the high number of counties and the huge variability in counties’ dimensions, we also analyse NUTS III, allowing for a more robust and meaningful analysis.
To anticipate our main results, we find that both indicators of culture of retention are not persistent in the 6 years under analysis for the great majority of the 278 counties. Therefore, evidence suggests that the culture of retention does not differ across counties. Regarding the 28 NUTS, stability is detected in the extreme quartiles of both culture of retention indicators. From these, we identify a culture favourable to grade retention in two regions and a culture not favourable to grade retention in other two regions. For the remaining regions, we do not detect a specific regional culture of retention.
The paper is organized as follows: section 2 explores the literature about grade retention determinants and culture of retention. Section 3 explains the methodology. Section 4 presents the data used in this paper. Section 5 presents and discusses the results and finally section 6 concludes and makes some final considerations.
2. Literature Review
The main reason that justifies grade retention is the low academic achievement (Wilson et al., 2009, and Eurydice, 2011). Hence it is expected that factors that deteriorate pupils' academic performance increase the probability of grade retention.
Determinants of school achievement have been a topic widely addressed by researchers. In the famous report by James Coleman and his colleagues (1966), three types of determinants of school achievement were identified: student's attributes, family characteristics and school environment, including teachers' characteristics, peers' attributes and school ownership regime. The main conclusion of that report is that socioeconomic attributes are the factor that more significantly drives school performance, as opposed to school characteristics as previously thought.
Concerning students’ characteristics, there is a gap between boys' and girls' performance.
According to OECD 2015 PISA results, girls outperform boys on reading skills, while boys score slightly higher than girls in science. Regarding pre-school acquired skills, Heckman (2000) finds that kids that acquire skills in pre-school programs tend to perform better in school. In respect to the pupils’ ability, Heckman et al. (2001) find a positive impact of innate ability in both schooling and labour market performance.4 Family background and other
socioeconomic characteristics also play an important role in determining pupils' academic success. On this topic, Dronkers, R. et al. (2011) findings indicate that students with parents with higher education and good professional status tend to perform better. Besides, according to Wößmann (2007), having an unemployed father has negative consequences on pupils' academic performance. Furthermore, Chevalier et al. (2001) conclude that poorer families are less likely to invest in education, and conclude that the composition of the family appears to
4Measuring student’s innate ability reveals to be one of the biggest challenges in modelling the determinants of school
have more preponderance on the educational choice of adolescents, rather than their financial situation.
Regarding the educational environment, in an extensive review of the 147 studies of educational production functions, Hanushek et al. (1986) find scarce evidence of the impact of many school attributes. Few studies have found statistically significant coefficients for class size, teachers' education, and teachers' salary. Positive effects of teachers experience and expenditure per pupil were found. Still, most studies estimate statistical insignificant coefficients for these variables. Concerning class size, the Tennessee class size experiment (Mosteller, 1995) is probably one of the most important studies. In this study, students were randomly assigned to three class size groups in kindergarten until the 3rd grade. The results suggest that students benefit from being in a smaller class especially in earlier grades, and the benefit seems to be higher among low socioeconomic status students.5 Also, the peers’ characteristics are known to impact school performance. According to Kang (2007), mixing peer quality in class is good for pupils, especially for underperforming students. Yet, in a review of the existing empirical work from anthropology, economics, sociology, and psychology, Harris (2010) concludes that there is not a consensus among researchers relatively to the benefits from mixing good performance and low performance students in the same class.
In respect to grade retention, several papers confirm that its determinants correspond to the determinants of academic achievement. In fact, Nunes et al (2016) and Goos et al. (2013), conclude that kids with low socioeconomic background are more prone to repeat a year. Furthermore, Goos et al. (2013) results indicate that the grade retention determinants are the same for primary school and lower secondary students. Agasisti et al. (2015) and Pereira et al. (2014) corroborate these conclusions, and state that an environment favourable to the learning
5 In concern to school size, Leithwood et al. (2009) conclude in a review of the existing empirical work that students from
experience reduces the probability of being retained, particularly when it comes to peers' characteristics. Regarding gender, all these authors find girls to be less likely to repeat a year.6 Culture of retention
An EACEA (Education Audiovisual and Culture Executive Agency of the European Commission) study analysed the regulation of grade retention for primary and lower secondary school for 33 OECD countries (Euridyce 2011). One of its main conclusions is the discrepancy observed between the provision of grade retention in legislations and its actual practice in most nations, given that the rate of retention varies significantly among the countries where grade retention is permitted. It is hypothesized that the variation in the application of grade retention
is caused by a "culture of retention" that prevails in a specific country’s society and educational
environment – i.e., the belief that grade retention is beneficial to pupils. This hypothesis introduces a new determinant of grade retention. According to this research, such belief prevails in countries like Belgium, Spain, France, Luxembourg, the Netherlands, and Portugal.
In this paper, we define culture of retention as a persistent set of belief regarding the benefits and costs of grade retention rate that prevail in a certain region. The results of some empirical studies suggest that countries have distinct cultures of retention. Goos et al. (2013) use a multilevel mixed-effects logistic regression to understand how differences between countries’ grade retention in primary and lower secondary school can be explained, using PISA results. The authors find that, even though a significant variation in the likelihood of being retained lies at the country level, only part of it can be explained by national educational policies – suggesting that the rest can be attributed to the diverse cultures of retention prevailing in each country. Using a similar strategy, Agasiti et al (2015) study grade retention determinants that are common across countries and find significant and diverse coefficients of country dummies. Furthermore, Pereira et al (2014) also identify significant country fixed effects in a logit model
6 Beyond confirming these results, Wilson et al. (2009) conclude that parents with a shared sense of responsibility regarding
for grade retention in primary school. Yet, none of these authors studied if it can be said that there are different country-specific cultures of retention since they did not test if the results obtained were persistent in time.
Regarding the differences in educational achievement across regions within a country, as far as we know there is no paper that analysed the persistent differences across country regions. Still, some research has focused on the academic outcomes differences across country regions in one year. Ferrera et al. (2010) find significant school performance improvements in 8 Spanish autonomous regions after controlling for school, peer and individual effects and family effects. Wößmann (2007) takes advantage of the decentralized German educational policy and find that, in general, German states with external exams outperform states without these exams. The political orientation of the state government and conservative party support, which control for society values, does not change the magnitude of educational policy impact, namely the effect of having an external exam. Beyond that, regional dummies reveal to be statistically insignificant. Using data for Italy, Bratti et al. (2007) also conclude that there are significant regional differences in mathematic outcomes, and find significant coefficients for macro-regional dummies (North-East, North-West, Centre, South and Islands). Yet, after controlling for contextual variables, coefficients get statistically insignificant or their coefficient value drops significantly. Finally, using PISA data, Pereira et al (2012) find that regional dummies
have no significant effect on students’ performance in both reading and mathematics exams in
Portugal when controlling for individual, family and school characteristics. This study utilizes 12 regions, obtained by aggregation of NUTSIII.
The research question this paper addresses is: “Are there different cultures of retention across
Portuguese regions?” Hence, the goal of this study is to check if the distribution of grade retention rate is stable after controlling for grade retention determinants. If after controlling for contextual features excess grade retention is persistently observed in some regions, this might be explained by specific cultures of retention prevailing in those locations. Thus, we first create culture of retention indicators by isolating regional grade retention rates from its determinants. Then we check if their distributions are stable in time.
3.1. Isolating Grade retention determinants
our sample, students are nested within classes, and classes within schools, and schools within regions. 7 Standard logit models do not account for the potential correlation between individuals in the same cluster, leading to inconsistent estimations. Using a multilevel approach allows to account for the hierarchical structure of our data, avoiding biased estimations. Following Agasisti et al. (2015) and Goos et al. (2013) the following model is specified:
𝑃(𝑟isg = 1) = β1X𝑖𝑠𝑔+ β2S𝑠𝑔+ β2G𝑔+ us+ 𝛿𝑖𝑠𝑔 (1)
𝑃(𝑟isg = 1) is the probability of student “i”of school “s” and region “g” of repeating a year. X𝑖𝑠𝑔 is a vector of students' individual and family characteristics. S𝑠𝑔 is a vector of school
characteristics, which captures peer effects and school quality. us is the school specific random error, which allows the control of unobserved school level features. G𝑔 is a vector that includes dummies for each region.8𝛿
𝑖𝑠𝑔 is an i.d.d. random error term. Equation (1) is estimated for each
year under analysis by Maximum Likelihood.
The estimated coefficients of the regional fixed effects will capture the unobserved region specific features that drive grade retention rate. Although this strategy allows for a more robust analysis, the regional dummies coefficients probably capture other effects apart from the cultural dimension. Portugal has a very centralized educational system, and consequently the main educational norms such has the subjects program, the minimum teaching time per class, and others, are decided by the central government. Still, there are some institutional differences across regions that can influence the grade retention probability.9
Therefore, apart from
7Class level is not included in our model due to lack of information on class and teachers’ characteristics.
8 The choice of the variables follows our review of the literature and Creemers and Kyriakides 2008 dynamic model for
educational effectiveness. Unfortunately, we did not have access to some variables that are, according to the authors, important in describing grade retention dynamics. For instance, information related to the school policy, regional educational policy and regional educational environment.
9 For example, there are some counties that offer school textbooks to basic school students pupils. Unfortunately, this data was
capturing the regional cultural effects, the coefficients of the regional dummies probably reflect these institutional differences.
3.2. Persistency Analysis
The regional grade retention rates among low achieving students and the regional dummies coefficients are the indicators of the differences in the regional cultures of retention. If distributions of these two indicators are stable in the period under analysis, this signals that there are region-specific social beliefs regarding grade retention practice that are long-lasting, i.e. that regions do have a specific culture of retention. To check the persistency of the culture of retention indicators, three statistical tools are used: autocorrelation, year-to-year Spearman correlation and the transitions across percentiles. These measures are estimated for both grade retention among underperforming students and regional dummies coefficients and compared with the results for the regional grade retention rate amidst all students in our data base. Autocorrelation Estimation
To estimate the autocorrelation of regional grade retention rates over time, the following equation is estimated.
ri t = β1ri t−1+ α𝑡+ uit (2)
The dependent variable of this model, ri t, is the culture of retention indicators’ value of region "i" at year "t", the regressor ri t−1 is the one-year retention lag, and α𝑡 controls for time fixed effects. Equation (2) is estimated using OLS. The closer β1to 1 the higher the persistency.
Spearman Rank Correlation Coefficient
The second measure of persistency used is the Spearman rank correlation coefficient. We are interested in understanding if the culture of retention indicators are more stable in some periods than others. To estimate Spearman correlation, we first order regions in respect to their culture
𝑆𝑡,𝑡−1 =𝑐𝑜𝑣(𝑟𝑔𝜎 𝑟𝑖𝑡, 𝑟𝑔𝑟𝑖𝑡−1) 𝑟𝑔𝑟𝑖𝑡𝜎𝑟𝑔𝑟𝑖𝑡−1
𝑟𝑔𝑟𝑖𝑡is the rank of the culture of retention indicator’s value of region “i” at year “t”, and 𝑟𝑔𝑟𝑖𝑡−1
is the rank of the culture of retention indicator’s value of region “i” at year “t-1”. 𝜎𝑟𝑔𝑟𝑖𝑡and
𝜎𝑟𝑔𝑟𝑖𝑡−1are the standard deviations of the ranks. If regions are equally ordered in two subsequent
years, S equals 1. In other words, the closer S is estimated to 1, the higher the rank’s persistency in that period.
Relative position transition
Finally, the analysis of the transitions across quartiles is used to understand the stability of regions in each percentile of the distribution. The intuition behind this indicator is simple: the higher the number of regions that stayed in the same percentile for a certain number of years, the higher persistency is. This indicator is calculated for the number of regions that stayed in the same percentile for at least four years, and for the whole period (6 years). The results are submitted to a test of hypothesis, where the null hypothesis is no persistency.10
4. Data
The dataset used in this study comes from an administrative database managed by the Portuguese Ministry of Education and contains information about public schools’ students, including age, social-economic variables – such as the type of social support, having a computer and internet at home, parents' education and employment situation, grades in national exams and information on whether a student was retained or promoted. This data set has a significant
10 In a random distribution, the probability of staying in the same percentile for at least 4 years is given by: 𝑝 =
(1𝑘)4(𝑘−1𝑘 )2𝐶46+ (1𝑘) 5
(𝑘−1𝑘 ) 𝐶56+ (1𝑘) 6
, and the probability of staying the whole period in the same percentile is given by:
𝑝 = (1𝑘)6, where k is the number of percentiles. Knowing this, a Z-test can be made to test if the estimated proportions come
from a random distribution: 𝑍 = 𝑝′−𝑝
√𝑝(1−𝑝)𝑛 , 𝑍~𝑁(0,1), where 𝑝
′ is the estimated proportion. If |𝑍| > 1.96 the null hypothesis
advantage over other sample base data, such as PISA or PIRLS, due to its dimension and the fact that it covers all school years. Data was available from the academic year of 2006/2007 up until 2014/2015.11
This research considers two regional levels: counties and NUTSIII. Counties are the 2nd level administrative subdivision of Portuguese territory. Portugal has 278 counties in the continent.12 Anticipating those results will yield high volatility, due to the high number of counties and the huge variability in counties’ dimensions, we also analyse a more aggregated regional level. This allows the analysis to become more meaningful and robust. For that purpose, NUTSIII were used – NUTSIII is a division of territory widely used by the Portuguese statistic authority (“Instituto Nacional de Estatística”), that divides the territory into 28 regions.
Table 1 presents some descriptive statistics for the variables used in this research for 2007.
Table 1: Descriptive Statistics13
11 The years of 2012/2013 to 2014/2015 are excluded from the analysis because of the change in national exams legislation. In
2012/2013, national exams were introduced in the 4th-grade, and its grade accounts has a weight in the final grade.
12 We exclude Azores and Madeira's from our analysis because there was not enough available data.
13The countries considered in “other Portuguese speaking countries” are: Brazil, Cape Verde, Angola, Mozambique, São Tomé
and Príncipe, Guinea-Bissau and East Timor. In “School Variables”, the values presented refer to the mean value.
2007 Promoted Retained Total Promoted Retained Total
Number of students 96 072 6 461 102 533 4 261 1 683 5 944
94% 6% 100% 72% 28% 100%
Average students per county ... ... 369 ... ... 21
Median students per county ... ... 159 ... ... 9
Average students per NUTS III ... ... 3661 ... ... 212
Median students per NUTS III ... ... 2480 ... ... 123
Max / Min grade retention rate County ... ... 17% / 0% ... ... 100% / 0%
Max / Min grade retention rate NUTS III ... ... 9% / 2% ... ... 39% / 15%
Males 52% 59% 52% 61% 63% 62%
Age 10 76% 54% 75% 31% 51% 38%
11 17% 28% 17% 41% 33% 39%
12 7% 18% 8% 37% 13% 30%
Student's nationality Other Portuguese speaking countries 2% 6% 2% 4% 8% 6%
Mother's nationality Other Portuguese speaking countries 4% 9% 4% 7% 12% 9%
Computer at home 51% 33% 50% 32% 32% 32%
Internet at home 31% 19% 31% 17% 16% 16%
Mother's education Primary 26% 43% 27% 44% 46% 45%
Higher 8% 2% 8% 1% 1% 1%
Employment status Unemployed father 4% 7% 4% 7% 7% 7%
Unemployed mother 27% 36% 27% 39% 38% 39%
Social beneficiary 12% 22% 13% 25% 24% 24%
School variables School grade retention rate 10% 17% 11% 5% 8% 6%
School rate of social beneficiaries 17% 21% 17% 31% 31% 31%
Schoool rate of mothers with primary education 27% 28% 27% 27% 26% 27% School rate of students from other Portuguese speaking countries 2% 4% 3% 4% 4% 4%
4.1. Sample Design - Isolating Grade Retention Determinants
The left-hand side of Table 1 summarises some descriptive statistics for 4th-grade Portuguese students in 2007, comparing between retained and promoted students. The information given in this table is in line with the literature regarding the determinants of students' academic performance and grade retention. The retained group has a higher percentage of male students. In respect to age, a higher percentage of 12-year-old kids is observed in the retained group, and the opposite happens to 10-year-old students. Also, there is a lower percentage of other Portuguese-speaking countries' students in the promoted group. Besides, the retained group has a higher percentage of students from a disadvantaged background: firstly, the number of students with computer and internet access at home is lower in the retained group; secondly, a higher percentage of less educated mothers is observed in the retained group, and finally, there is a higher percentage of both unemployed parents and beneficiaries of social support in the retained group. In respect to school-levelvariables, the average school grade retention rate is
higher among students that were retained. Moreover, the average of peers’ socio-economic indicators is slightly higher in the retained group.14
As mentioned before, two methods were used to control for grade retention determinants. The first approach restraints the analysis to the regional grade retention of low achieving students. The right-hand side of Table 1 summarises some descriptive statistics for students that had negative scores in both Portuguese and Mathematics national exams in 2007. The results confirm that selecting underperforming pupils succeeds in reducing socioeconomic and school features heterogeneity. In fact, the difference in the percentage of each of these variables between the promoted and retained group is not significant.15 However, there are three variables
14 These results are valid for every year under analysis, as can be verified in Appendix 1.
15 Also, it is not persistent over time as can be verified in Appendix 1. For instance, the percentage of students with access to a
where this is not the case. In the retained group the percentage of students from other Portuguese speaking countries is slightly higher than in the promoted group in every year, which might signal discrimination. Regarding age, its distribution is the opposite from the observed in the population. The retained group constantly has a lower percentage of 12-year-old students, while the percentage of 10-year-old kids is persistently higher in the retained group. In concern to school variables, a slightly higher mean grade retention rate is observed in the retained group.16 17
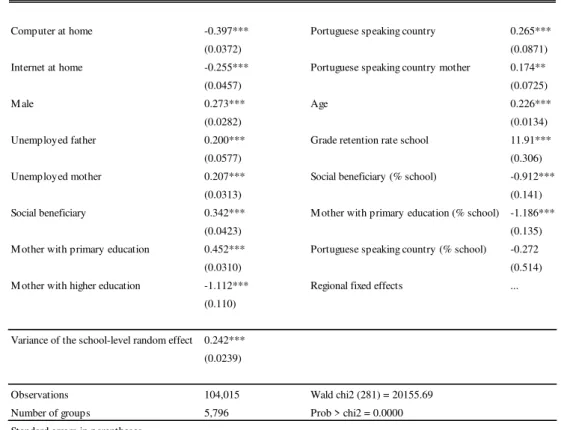
The second strategy to control for grade retention determinants is using the estimated coefficients of regional dummies from a multilevel mixed-effects logistic model. Table 2 exhibits the estimated result for equation (1) for 2007, using county dummies. The estimated coefficients for individual and family features are in line with the grade retention determinants presented in the literature and the results presented in Table 1. Namely, pupils from the more disadvantageous socio-economic background are more likely to fail, and the likelihood of repeating a year is higher for boys and for older kids. In addition, pupils that study in a school with a higher percentage of students from disadvantageous backgrounds are less likely to repeat a year. One possible explanation is that teachers are aware that these students study in an unfavourable area, and hence they loosen the grade retention criteria. Finally, the school grade retention rate coefficient exhibits the highest estimated coefficient. This is likely explained by the fact that this variable is capturing various effects, such as teachers’ quality and other school features.18
16 This pattern is observed every year, which might reflect that the culture of retention may differ between schools, reinforcing
the importance of taking into account different levels in our empirical model. (see Appendix 1)
17 Another interesting result is the evolution of some features, namely mother education, computer, and internet at home. The
percentage of mothers with primary education decreases over time and the percentage of mothers with higher education increases in both retained and promoted groups. Furthermore, students with computer and internet at home also increase in both groups over time. These results are more evident in the sample of low achieving students than in the whole population (see Appendix 1).
18The estimations for grade retention determinants’ coefficients for the remaining years and for NUTS fixed effects yield very
Table 2: Multilevel mixed-effects logistics regression with county dummies.
5. Results – Persistency Analysis
Autocorrelation and Spearman Correlation
Table 3 presents the results for the estimation of equation (2). “Grade Ret. Rate” stands for the results for the regional grade retention rate taking into account all 4th-grade students; “Grade
Ret. Rate: L.A.” are the results of the grade retention rate of low achieving students; and “Fixed
Effects” exhibits the results of the regional dummies coefficients.19 Regarding the regional
grade retention rate of all students, the estimated autocorrelation coefficient suggests that the stability of grade retention rate is low at the county level (0.334), and high at NUTS level (0.709). When grade retention determinants are controlled, persistency decreases. In the case of grade retention rate of low achieving students, the autocorrelation shrinks to 0.0484 and 0.283 respectively. Concerning regional dummies coefficients, low persistency is detected in
19 Henceforward this nomenclature will be used in the tables presented.
Computer at home -0.397*** Portuguese speaking country 0.265***
(0.0372) (0.0871)
Internet at home -0.255*** Portuguese speaking country mother 0.174**
(0.0457) (0.0725)
M ale 0.273*** Age 0.226***
(0.0282) (0.0134)
Unemployed father 0.200*** Grade retention rate school 11.91***
(0.0577) (0.306)
Unemployed mother 0.207*** Social beneficiary (% school) -0.912***
(0.0313) (0.141)
Social beneficiary 0.342*** M other with primary education (% school) -1.186***
(0.0423) (0.135)
M other with primary education 0.452*** Portuguese speaking country (% school) -0.272
(0.0310) (0.514)
M other with higher education -1.112*** Regional fixed effects ... (0.110)
Variance of the school-level random effect 0.242***
(0.0239)
Observations 104,015 Wald chi2 (281) = 20155.69 Number of groups 5,796 Prob > chi2 = 0.0000 Standard errors in parentheses
*** p<0.01, ** p<0.05, * p<0.1
counties. Nevertheless, autocorrelation for NUTS (0.536) reveals that regional fixed effect is relatively stable in this regional level. However having a higher persistency at NUTS may be explained by an aggregation effect.
Table 3: Autocorrelation estimation. 20
Table 4: Year-to-year Spearman correlation estimation. 21
The second statistic used to measure persistency was the year-to-year Spearman rank correlation coefficient. Table 4 exhibits the results of its estimate. The results confirm the
20 For more details see Appendix (3)
21 The number of observations for the estimation for grade retention rate among low achievers is smaller because some counties
do not have students with a negative score in both Mathematics and Portuguese exam. Moreover, the number of observation for counties fixed effects coefficients results from the impossibility of estimating the regional dummy coefficient when the county grade retention rate is 0%. In that case, the regional dummy would perfectly predict the non-occurrence of grade retention.
Dependent Variable Grade Ret. Rate Grade Ret. Rate: L.A. Fixed Effects Grade Ret. Rate Grade Ret. Rate: L.A. Fixed Effects
Dependent variable lag ( ) 0.334*** 0.0484* 0.283*** 0.709*** 0.288*** 0.536***
(0.0260) (0.0264) (0.0285) (0.0603) (0.0884) (0.0768)
Observations 1390 1,269 1,124 140 140 140
Standard errors in parentheses
*** p<0.01, ** p<0.05, * p<0.1
NUTS Counties
1
Counties
Years Retention Rate coefficient Prob>|t| obs coefficient Prob>|t| obs coefficient Prob>|t| obs
2007-2008 0.36*** 0.000 278 0.13** 0.039 257 0.28*** 0.000 244
2008-2009 0.40*** 0.000 278 0.07 0.292 252 0.35*** 0.000 219
2009-2010 0.33*** 0.000 278 0.16** 0.011 246 0.26*** 0.000 214
2010-2011 0.47*** 0.000 278 0.10 0.126 250 0.27*** 0.000 221
2011-2012 0.32*** 0.000 278 0.08 0.190 264 0.23*** 0.001 226
NUTS
Years Retention Rate coefficient Prob>|t| obs coefficient Prob>|t| obs coefficient Prob>|t| obs
2007-2008 0.81*** 0.000 28 0.57*** 0.005 28 0.68*** 0.000 28
2008-2009 0.68*** 0.000 28 0.37* 0.083 28 0.28 0.169 28
2009-2010 0.82*** 0.000 28 0.29 0.183 28 0.31 0.104 28
2010-2011 0.83*** 0.000 28 0.44** 0.034 28 0.76*** 0.000 28
2011-2012 0.55*** 0.007 28 -0.13 0.553 28 0.55** 0.003 28
***significant at 0.01 **significant at 0.05 *significant at 0.1
Grade Retention Rate: L.A. Fixed Effects S pearman Rank Correlation Coefficient
conclusions aforementioned. Namely, controlling for grade retention determinants decreases the persistency of the series, and the culture of retention indicator that reveals sign of some stability is the regional dummies coefficients at NUTS level. Apart from that, this estimation lets us have an insight of the periods in which the distribution was more stable. On this topic, the results indicate that at the county level persistency does not differ significantly across years in all distributions. At NUTS level, regional grade retention rate exhibits lower stability in 2008-2009 and 2011-2012. In respect to grade retention rate among underperforming students, persistency is higher in 2007-2008 and 2010-2011. Finally, in regional fixed effects, the distribution is more stable in the years of 2007-2008, 2010-2011 and 2011-2012, while in the remaining years, regional dummies coefficients exhibit no significant persistency.
Relative Position
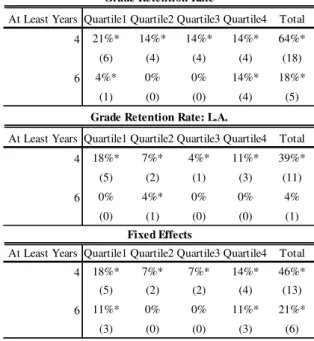
Table 5 presents the percentage of counties that stayed in the same quartile for at least 4 years, and for the whole period (6 years). The numbers in parenthesis refer to the absolute value. For example, in respect to grade retention rate of all 4th-grade students, 3% of the counties (9 counties) stayed in the highest quartile for the whole period (6 years).
quartiles. However, the signals of persistency vanish when it is measured as remaining in the same quartile for the whole period.
Table 6 summarises the results for NUTS. Regional grade retention rate shows remarkable levels of stability, especially in the extreme quartiles, and 64% of the NUTS stayed in the same quartile for at least four years. In the grade retention rate among underperforming students, the number of NUTS that remained in the same quartile for at least four years decreases to 39%. Moreover, persistency seems to be much higher in the extreme quartiles than in the middle ones. However, there is no NUTS staying in the same quartile for the whole period. Regarding regional dummies coefficients, the results reveal signs of some stability across years. 46% of the NUTS stayed in the same quartile for at least 4 years, and 21% remained for the whole period. In this case, the regional dummies’ coefficients reveal a remarkable level of persistency in the extreme quartiles, rather than in the middle ones.
Table 5: Counties Table 6: NUTS
The results discussed in this section give an insight into the stability of the distributions as a whole. On this topic, we conclude that the distribution of grade retention rate among
At Least Years Quartile1 Quartile2 Quartile3 Quartile4 Total At Least Years Quartile1 Quartile2 Quartile3 Quartile4 Total
4 14%* 6%* 10%* 14%* 44%* 4 21%* 14%* 14%* 14%* 64%*
(38) (18) (28) (39) (123) (6) (4) (4) (4) (18)
6 1%* 0% 1%* 3%* 5%* 6 4%* 0% 0% 14%* 18%*
(3) (1) (2) (9) (15) (1) (0) (0) (4) (5)
At Least Years Quartile1 Quartile2 Quartile3 Quartile4 Total At Least Years Quartile1 Quartile2 Quartile3 Quartile4 Total
4 14%* 8%* 8%* 7%* 35%* 4 18%* 7%* 4%* 11%* 39%*
(37) (20) (22) (15) (94) (5) (2) (1) (3) (11)
6 2%* 0% 1%* 0%* 3%* 6 0% 4%* 0% 0% 4%
(4) (0) (3) (1) (8) (0) (1) (0) (0) (1)
At Least Years Quartile1 Quartile2 Quartile3 Quartile4 Total At Least Years Quartile1 Quartile2 Quartile3 Quartile4 Total
4 6%* 6%* 9%* 8%* 29%* 4 18%* 7%* 7%* 14%* 46%*
(16) (15) (22) (19) (72) (5) (2) (2) (4) (13)
6 0% 0% 0% 1% 2% 6 11%* 0% 0% 11%* 21%*
(1) (0) (1) (2) (4) (3) (0) (0) (3) (6)
Grade Retention Rate
Grade Retention Rate: L.A.
Fixed Effects Fixed Effects
Grade Retention Rate
Grade Retention Rate: L.A.
underperforming students and regional dummies coefficients is not homogenous across time at the county level - yet, at NUTS level, there is some evidence of a persistent distribution, especially in the extreme quartiles. Therefore, it may be the case that the instability observed in the autocorrelation and Spearman coefficients is justified by the instability of the middle
quartiles’ regions. This result indicates that the culture of retention does not differ for the majority of Portuguese regions. Yet, we cannot exclude the possibility that regions that exhibit persistent grade retention rate amidst underperforming students and regional fixed effect coefficients to have a specific culture of retention.
As mentioned before, using the sample of students with a negative score in the national exams has the disadvantage of dealing with a reduced number of observations per region, making the analysis less robust. Using regional dummies coefficients increases the robustness of the analysis – however, these coefficients probably capture other region-specific effects not related to the culture of retention, such as institutional features. Hence, if a region has a persistent distribution in both culture of retention indicators, one can reliably conclude that these regions do have a specific culture of retention. Table 7 discriminates the NUTS that remained in the same quartile for at least 4 years, and for the whole period in both culture of retention indicators.
In addition to these results, Table 7 shows that two regions remained persistently in the first quartile grade retention rate amidst low achieving students and in the second quartile of regional fixed effects distribution, while an additional two regions remained in the third quartile in one of the culture of retention indicators and in the fourth quartile in the other indicator. Except for
“Grande Porto”, these four regions also exhibit a persistent grade retention rate in the corresponding quartile. Even though this result is not so strong, it signals that probably these regions do have its own culture of retention. For the remaining 20 regions, we do not observe persistency in both culture of retention indicators. Thereafter, evidence does not support the hypothesis that those regions have a specific culture of retention.
Table 7: Percentage of regions that remained in the same quartile in the distribution of
culture of retention indicators for all years or for at least four years.
6. Conclusion
It is in the interest of any policy maker to know the determinants of the grade retention rate in order to tackle this issue more efficiently. The results of this paper confirm the conclusions that were vastly documented in the literature. Namely, age, gender, socio-economic conditions, school quality and educational environment are determinant features in pupils’ probability to repeat a year.
at least 4 years 6 years at least 4 years 6 years at least 4 years 6 years
Baixo M ondego Pinhal Litoral Alto Alentejo Alto Alentejo
Pinhal Interior Sul Baixo M ondego Pinhal Interior Sul
Pinhal Interior Sul
Pinhal Litoral
Baixo M ondego
Pinhal Litoral
Alto Alentejo Grande Porto Oeste
Oeste
Grande Lisboa Grande Lisboa Grande Porto Grande Lisboa
Península de Setúbal Oeste Península de Setúbal
Península de Setúbal Quartile1
Quartile2
Quartile3
Quartile4
NUTS
When the above mentioned features are controlled for, significant differences across regions are still observed in both grade retention rate among 4th-grade students with negative scores in Portuguese and Mathematics national exams and in regional dummies estimated coefficients. At the county level, the differences are not persistent over time for the great majority of the counties. Hence the hypothesis that this heterogeneity is explained by differences in the culture of retention prevailing in those regions is rejected. Concerning NUTS III, stable distributions are detected at the extreme quartiles in both grade retention among underperforming students and regional fixed effects. From here we identify 4 regions that stay persistently at the extreme quartiles. Hence, these results suggest that at least in these 4 regions the culture of retention differs from the rest of the country. Yet, the results of this research suggest that the beliefs regarding grade retention practice in the majority of the regions do not deviate from the norm. To further control for grade retention determinants, it would be interesting to have access to
more information regarding teachers’ characteristics and regional specific variables. In particular, having access to variables that measure institutional differences across the local authorities, such as knowing if the county provides school textbooks to its primary school pupils, would allow to better isolate culture of retention dynamics in the multilevel mixed-effects model estimation.
References
Agasisti, T., and Cordero, J.M. 2015. The determinants of repetition rates in European
countries: insights from an empirical analysis using PIRLS 2011 data. Instituto Nacional de Evaluación Educativa-INEE.
Bound, John, Griliches, Z. and Bronwyn H. Hall. 1986. "Wages, Schooling and IQ of Brothers
and Sisters: Do the Family Factors Differ?" International Economic Review, Vol. 27, No. 1, (February 1986), pp. 77-105.
Bratti, M., Checchi, D. e Filippin, A. 2007. “Territorial Differences in Italian Students’
Mathematical Competencies: Evidence from PISA 2003,” IZA Discussion Papers 2603, Institute for the Study of Labor (IZA)
Coleman J S, Campbell E Q, Hobson C J, McPartland, J, Mood A M, Weinfeld F D and
York R L. 1966. “Equality of educational opportunity”, US government printing office,
Washington, DC.
Cameron, C. and Trivedi, P. K. 2009. “Microeconometrics Using Stata”, Stata Press 2009
Chevalier, A. and Lanot, G. 2001. “The Relative Effect of Family and Financial Characteristics
on Educational Achievement” Centre for the Economics of Education LSE May 2001
Creemers, B., and Kyriakides, L. 2008. “The Dynamics of Educational Effectiveness: A
Contribution to Policy, Practice and Theory in Contemporary Schools.” London: Routledge.
Dronkers, J., Van der Velden, R., Dunne, A. 2011. The effects of educational systems,
school-composition, track-level, parental background and immigrants’ origins on the achievement of 15 -years old native and immigrant students: A reanalysis of PISA 2006. ROA Research Memorandum ROA-RM-2011/6. Maastricht: Research Centre for Education and the Labour Market.
Eurydice 2011. “Grade Retention During Compulsory Education in Europe: Regulations and
Ferrera, J., Cebada, E. and González, D. 2010. “Factors affecting regional attainment:
Evidence from Spanish PISA 2006 results”, Regional and Sectoral Economic Studies, vol. 10(3).
Goos, M., Schreier, B.M. Knipprath, H.M., De Fraine, B. Van Damme, J., Trauwein, U.
2013. “How Can Cross-Country Differences in the Practice of Grade Retention Be Explained? A Closer Look at National Educational Policy Factors.” Comparative Education Review, 57 (1), 54-84.
Hanushek, E. A. 1986. “The Economics of Schooling: Production and Efficiency in Public
Schools,” Journal of Economic Literature, Vol. 24, 1986, pp. 1141–1177. (page 1161).
Harris, Douglas N. 2010. “How Do School Peers Influence Student Educational Outcomes?
Theory and Evidence from Economics and Other Social Sciences.” Teachers College Record 112 (4): 1163–97.
Heckman, J. and Edward V. 2001. "Identifying The Role Of Cognitive Ability In Explaining
The Level Of And Change In The Return To Schooling," Review of Economics and Statistics, 2001, v83(1,Feb), 1-12
Heckman, J. 2000. “Policies to foster human capital” Research in Economics 54, 3–56;
Kang, C. 2007. “Classroom Peer Effects and Academic Achievement: Quasi Randomization
Evidence from South Korea.” Journal of Urban Economics 61 (3): 458– 95.
Leithwood, K. and Jantzi, D. 2009. “A review of empirical evidence about school size effects:
A policy perspective. Review of Educational Research, 79(1): 464-490.
Mosteller, F. 1995. “The Tennessee Study of Class Size in the Early School Grades” Critical
Issues for Children and Youths Vol. 5 • No. 2 – Summer/Fall 1995
Nunes, L. C., Reis, A. B. and Seabra, C. 2016. “Será a repetição de ano benéfica para os alunos?
Resultados para Portugal” Fundação Francisco Manuel dos Santos, Outubro de 2016
Pereira, M. C. and Reis, H. 2012. “Diferenças Regionais no Desempenho dos Alunos Portugueses: Evidência do Programa PISA da OECD”, Boletim Económico de Inverno, Banco de Portugal, page 17
Pereira, M. C., and Reis, H. 2014. “Grade retention during basic education in Portugal:
determinants and impact on student achievement”, Economic Bulletin, Banco de Portugal, June 2014, pp. 61-82.
StataCorp LP. 2013. “STATA multilevel mixed-effects reference manual 13” College Station
(TX): StataCorp LP.
Willson, V. L. and Hughes, J. N. 2009. “Who Is Retained in First Grade? A Psychosocial
Perspective”, The Elementary School Journal, Vol. 109, No. 3 (January 2009), pp. 251-266
Wößmann, L. 2007. “Fundamental Determinants of School Efficiency and Equity: German
Appendix 1: Descriptive Statistics
Promoted Retained Total Promoted Retained Total Promoted Retained Total Promoted Retained Total Promoted Retained Total Promoted Retained Total
Number of students 96 072 6 461 102 533 4 261 1 683 5 944 97 949 4 550 102 499 3 781 1 047 4 828 98 559 3 749 102 308 4 245 1 047 5 292
94% 6% 100% 72% 28% 100% 96% 4% 100% 78% 22% 100% 96% 4% 100% 80% 20% 100%
Average students per county ... … 369 ... ... 21 ... ... 369 ... ... 17 ... ... 368 ... ... 19
Median students per county ... ... 159 ... ... 9 ... ... 158 ... ... 8 ... ... 159 ... ... 8
Average students per NUTS III ... ... 3661 ... ... 212 ... ... 3660 ... ... 172 ... ... 3654 ... ... 189
Median students per NUTS III ... ... 2480 ... ... 123 ... ... 2441 ... ... 94 ... ... 2580 ... ... 108
Max / Min grade retention rate County ... ... 17% / 0% ... ... 100% / 0% ... ... 26% / 0% ... ... 100% / 0% ... ... 17% / 0% ... ... 100% / 0%
Max / Min grade retention rate NUTS III ... ... 9% / 2% ... ... 39% / 15% ... ... 7% / 1% ... ... 30% / 0% ... ... 6% / 1% ... ... 32% / 7%
Males 52% 59% 52% 61% 63% 62% 52% 57% 52% 59% 57% 58% 51% 58% 52% 56% 58% 56%
Age 10 76% 54% 75% 31% 51% 38% 77% 51% 76% 38% 57% 43% 79% 52% 78% 44% 57% 47%
11 17% 28% 17% 41% 33% 39% 17% 29% 17% 41% 33% 39% 15% 30% 16% 39% 33% 38%
12 7% 18% 8% 37% 13% 30% 7% 20% 7% 28% 10% 23% 6% 18% 6% 23% 8% 20%
Student's nationality Other Portuguese speaking countries 2% 6% 2% 4% 8% 6% 3% 7% 3% 6% 10% 7% 3% 8% 3% 6% 8% 7%
Mother's nationality Other Portuguese speaking countries 4% 9% 4% 7% 12% 9% 4% 10% 5% 10% 13% 10% 5% 11% 5% 9% 12% 10%
Computer at home 51% 33% 50% 32% 32% 32% 48% 29% 47% 33% 28% 32% 50% 31% 49% 32% 31% 32%
Internet at home 31% 19% 31% 17% 16% 16% 31% 18% 31% 18% 17% 18% 31% 17% 31% 16% 17% 16%
Mother's education Primary 26% 43% 27% 44% 46% 45% 25% 40% 25% 41% 41% 41% 23% 38% 24% 39% 38% 39%
Higher 8% 2% 8% 1% 1% 1% 8% 2% 8% 2% 1% 1% 9% 2% 9% 2% 1% 1%
Employment status Unemployed father 4% 7% 4% 7% 7% 7% 4% 7% 5% 7% 7% 7% 4% 8% 4% 7% 8% 7%
Unemployed mother 27% 36% 27% 39% 38% 39% 27% 34% 27% 38% 34% 37% 26% 35% 26% 37% 36% 37%
Social beneficiary 12% 22% 13% 25% 24% 24% 10% 18% 10% 7% 7% 7% 26% 47% 27% 7% 8% 7%
School variables School grade retention rate 10% 17% 11% 7% 11% 8% 7% 13% 8% 5% 9% 6% 7% 12% 8% 5% 8% 6%
School rate of social beneficiaries 17% 21% 17% 16% 17% 16% 15% 19% 16% 13% 13% 13% 26% 28% 26% 32% 32% 32%
Schoool rate of mothers with primary education 27% 28% 27% 31% 30% 31% 25% 27% 26% 29% 29% 29% 25% 27% 25% 28% 27% 28%
School rate of students from other Portuguese speaking countries 2% 4% 3% 3% 4% 3% 3% 4% 3% 4% 5% 4% 3% 5% 3% 4% 5% 4%
Promoted Retained Total Promoted Retained Total Promoted Retained Total Promoted Retained Total Promoted Retained Total Promoted Retained Total
Number of students 99 229 4 336 103 565 3 521 1 085 4 606 93 065 3 538 96 603 6 999 1 291 8 290 90 007 4 611 94 618 13 449 2 230 15 679
96% 4% 100% 76% 24% 100% 96% 4% 100% 84% 16% 100% 95% 5% 100% 86% 14% 100%
Average students per county ... ... 372 ... ... 17 ... ... 347 ... ... 30 ... ... 340 ... ... 56
Median students per county ... ... 158 ... ... 7 ... ... 146 ... ... 12 ... ... 150 ... ... 24
Average students per NUTS III ... ... 3698 ... ... 164 ... ... 3450 ... ... 296 ... ... 3379 ... ... 353
Median students per NUTS III ... ... 2605 ... ... 90 ... ... 2427 ... ... 161 ... ... 2328 ... ... 200
Max / Min grade retention rate County ... ... 17% / 0% ... ... 100% / 0% ... ... 19% / 0% ... ... 100% / 0% ... ... 25% / 0% ... ... 100% / 0%
Max / Min grade retention rate NUTS III ... ... 6% / 2% ... ... 32% / 9% ... ... 6% / 2% ... ... 25% / 5% ... ... 8% / 1% ... ... 36% / 0%
Males 52% 57% 52% 57% 60% 58% 52% 58% 52% 57% 61% 58% 52% 59% 52% 59% 61% 59%
Age 10 81% 58% 80% 49% 67% 54% 80% 58% 80% 58% 69% 60% 82% 59% 81% 66% 71% 67%
11 14% 28% 15% 38% 26% 35% 15% 28% 15% 34% 24% 32% 14% 27% 14% 29% 22% 28%
12 5% 15% 5% 18% 6% 15% 5% 15% 5% 13% 5% 12% 4% 14% 4% 10% 6% 9%
Student's nationality Other Portuguese speaking countries 3% 7% 3% 6% 9% 7% 2% 7% 3% 5% 7% 6% 2% 5% 2% 4% 5% 4%
Mother's nationality Other Portuguese speaking countries 5% 10% 5% 11% 13% 11% 5% 10% 5% 10% 13% 10% 4% 10% 5% 9% 11% 9%
Computer at home 52% 32% 51% 37% 33% 36% 56% 38% 55% 44% 41% 44% 60% 42% 60% 52% 46% 51%
Internet at home 35% 19% 34% 20% 19% 20% 41% 24% 40% 28% 25% 28% 48% 29% 47% 38% 32% 37%
Mother's education Primary 23% 38% 23% 36% 38% 37% 24% 40% 25% 36% 38% 36% 21% 37% 22% 30% 35% 31%
Higher 10% 2% 10% 2% 1% 2% 10% 2% 10% 2% 1% 2% 12% 2% 12% 4% 2% 3%
Employment status Unemployed father 5% 9% 5% 8% 9% 8% 5% 9% 5% 8% 8% 8% 5% 11% 6% 8% 11% 8%
Unemployed mother 25% 36% 25% 34% 37% 35% 23% 35% 24% 33% 33% 33% 23% 37% 23% 29% 35% 30%
Social beneficiary 24% 44% 25% 8% 9% 8% 25% 44% 25% 8% 8% 8% 19% 39% 20% 8% 11% 8%
School variables School grade retention rate 7% 13% 8% 5% 8% 6% 7% 12% 7% 5% 8% 5% 9% 15% 10% 6% 9% 6%
School rate of social beneficiaries 26% 29% 27% 31% 31% 31% 26% 29% 26% 30% 32% 31% 21% 24% 21% 22% 25% 23%
Schoool rate of mothers with primary education 24% 26% 24% 27% 26% 27% 23% 26% 23% 25% 26% 25% 22% 25% 22% 22% 22% 22%
School rate of students from other Portuguese speaking countries 3% 5% 3% 4% 4% 4% 3% 4% 3% 3% 4% 4% 2% 4% 3% 3% 3% 3%
All students Low achieving students All students Low achieving students All students Low achieving students
2010 2011 2012
2008 2007
All students Low achieving students All students Low achieving students
2009
Appendix 2: Multilevel mixed-effects logistic regresions.
Computer at home -0.397*** Portuguese speaking country 0.265***
(0.0372) (0.0871)
Internet at home -0.255*** Portuguese speaking country mother 0.174**
(0.0457) (0.0725)
M ale 0.273*** Age 0.226***
(0.0282) (0.0134)
Unemployed father 0.200*** Grade retention rate school 11.91***
(0.0577) (0.306)
Unemployed mother 0.207*** Social beneficiary (% school) -0.912***
(0.0313) (0.141)
Social beneficiary 0.342*** M other with primary education (% school) -1.186***
(0.0423) (0.135)
M other with primary education 0.452*** Portuguese speaking country (% school) -0.272
(0.0310) (0.514)
M other with higher education -1.112*** Regional fixed effects ... (0.110)
Variance of the school-level random effect 0.242*** (0.0239)
Observations 104,015 Wald chi2 (281) = 20155.69 Number of groups 5,796 Prob > chi2 = 0.0000
Standard errors in parentheses *** p<0.01, ** p<0.05, * p<0.1
Dependent variable: probability of grade retention (2007) - County fixed effects
Computer at home -0.397*** Portuguese speaking country 0.245**
(0.0466) (0.0978)
Internet at home -0.194*** Portuguese speaking country mother 0.00815
(0.0558) (0.0822)
M ale 0.171*** Age 0.308***
(0.0332) (0.0150)
Unemployed father 0.0852 Grade retention rate school 15.36***
(0.0686) (0.419)
Unemployed mother 0.124*** Social beneficiary (% school) -0.896***
(0.0371) (0.175)
Social beneficiary 0.369*** M other with primary education (% school) -1.254***
(0.0548) (0.165)
M other with primary education 0.438*** Portuguese speaking country (% school) -0.926*
(0.0372) (0.531)
M other with higher education -0.854*** Regional fixed effects ... (0.116)
Variance of the school-level random effect 0.314*** (0.0319)
Observations 103,581 Wald chi2 (262) = 17429.36 Number of groups 5,184 Prob > chi2 = 0.0000 Standard errors in parentheses
*** p<0.01, ** p<0.05, * p<0.1
Computer at home -0.367*** Portuguese speaking country 0.265***
(0.0522) (0.0987)
Internet at home -0.230*** Portuguese speaking country mother 0.127
(0.0629) (0.0841)
M ale 0.225*** Age 0.267***
(0.0354) (0.0165)
Unemployed father 0.142** Grade retention rate school 15.97***
(0.0700) (0.541)
Unemployed mother 0.132*** Social beneficiary (% school) -1.183***
(0.0397) (0.203)
Social beneficiary 0.486*** M other with primary education (% school) -1.245***
(0.0395) (0.182)
M other with primary education 0.363*** Portuguese speaking country (% school) 0.00902
(0.0399) (0.521)
M other with higher education -0.849*** Regional fixed effects 0.257***
(0.119) (0.0304)
Variance of the school-level random effect 0.257*** (0.0304)
Observations 101,798 Wald chi2 (250) = 17429.36 Number of groups 4,719 Prob > chi2 = 0.0000 Standard errors in parentheses
*** p<0.01, ** p<0.05, * p<0.1
Dependent variable: probability of grade retention (2009) - County fixed effects
Computer at home -0.423*** Portuguese speaking country 0.171*
(0.0503) (0.0972)
Internet at home -0.130** Portuguese speaking country mother 0.0802
(0.0580) (0.0809)
M ale 0.232*** Age 0.229***
(0.0333) (0.0171)
Unemployed father 0.161** Grade retention rate school 15.06***
(0.0628) (0.466)
Unemployed mother 0.277*** Social beneficiary (% school) -1.050***
(0.0369) (0.190)
Social beneficiary 0.541*** M other with primary education (% school) -1.101***
(0.0380) (0.175)
M other with primary education 0.361*** Portuguese speaking country (% school) -0.514
(0.0371) (0.580)
M other with higher education -1.156*** Regional fixed effects ... (0.122)
Variance of the school-level random effect 0.293*** (0.0309)
Observations 103,772 Wald chi2 (258) = 173000.57 Number of groups 4,600 Prob > chi2 = 0.0000 Standard errors in parentheses
*** p<0.01, ** p<0.05, * p<0.1
Computer at home -0.300*** Portuguese speaking country 0.355***
(0.0549) (0.107)
Internet at home -0.258*** Portuguese speaking country mother 0.0716
(0.0607) (0.0888)
M ale 0.234*** Age 0.239***
(0.0365) (0.0185)
Unemployed father 0.182*** Grade retention rate school 17.23***
(0.0676) (0.587)
Unemployed mother 0.227*** Social beneficiary (% school) -1.395***
(0.0408) (0.214)
Social beneficiary 0.425*** M other with primary education (% school) -0.904***
(0.0411) (0.190)
M other with primary education 0.361*** Portuguese speaking country (% school) -0.606
(0.0406) (0.651)
M other with higher education -1.103*** Regional fixed effects ... (0.127)
Variance of the school-level random effect 0.245*** (0.0303)
Observations 96,349 Wald chi2 (251) = 16873.02
Number of groups 4,140 Prob > chi2 = 0.0000 Standard errors in parentheses
*** p<0.01, ** p<0.05, * p<0.1
Dependent variable: probability of grade retention (2011) - County fixed effects
Computer at home -0.202*** Portuguese speaking country 0.0341
(0.0505) (0.0982)
Internet at home -0.285*** Portuguese speaking country mother 0.225***
(0.0536) (0.0749)
M ale 0.258*** Age 0.270***
(0.0324) (0.0171)
Unemployed father 0.352*** Grade retention rate school 11.87***
(0.0550) (0.434)
Unemployed mother 0.329*** Social beneficiary (% school) -0.801***
(0.0360) (0.183)
Social beneficiary 0.507*** M other with primary education (% school) -0.916***
(0.0378) (0.180)
M other with primary education 0.392*** Portuguese speaking country (% school) -0.817
(0.0366) (0.674)
M other with higher education -1.190*** Regional fixed effects ... (0.106)
Variance of the school-level random effect 0.223*** (0.0257)
Observations 96,181 Wald chi2 (43) = 18768.16
Number of groups 4,041 Prob > chi2 = 0.0000 Standard errors in parentheses
*** p<0.01, ** p<0.05, * p<0.1
Computer at home -0.390*** Portuguese speaking country 0.266***
(0.0370) (0.0872)
Internet at home -0.244*** Portuguese speaking country mother 0.177**
(0.0452) (0.0725)
M ale 0.272*** Age 0.228***
(0.0282) (0.0134)
Unemployed father 0.202*** Grade retention rate school 11.93***
(0.0577) (0.298)
Unemployed mother 0.203*** Social beneficiary (% school) -0.762***
(0.0310) (0.127)
Social beneficiary 0.342*** M other with primary education (% school) -1.132***
(0.0423) (0.129)
M other with primary education 0.455*** Portuguese speaking country (% school) -0.0625
(0.0310) (0.506)
M other with higher education -1.119*** Regional fixed effects ... (0.110)
Variance of the school-level random effect 0.326*** (0.0273)
Observations 104,535 Wald chi2 (43) = 18661.5
Number of groups 5,844 Prob > chi2 = 0.0000 Standard errors in parentheses
*** p<0.01, ** p<0.05, * p<0.1
Dependent variable: probability of grade retention (2007) - NUTS fixed effects
Computer at home -0.388*** Portuguese speaking country 0.240**
(0.0463) (0.0979)
Internet at home -0.191*** Portuguese speaking country mother 0.0190
(0.0554) (0.0823)
M ale 0.171*** Age 0.304***
(0.0332) (0.0149)
Unemployed father 0.0810 Grade retention rate school 15.41***
(0.0685) (0.405)
Unemployed mother 0.109*** Social beneficiary (% school) -0.756***
(0.0369) (0.164)
Social beneficiary 0.374*** M other with primary education (% school) -1.383***
(0.0547) (0.158)
M other with primary education 0.445*** Portuguese speaking country (% school) -0.713
(0.0372) (0.526)
M other with higher education -0.860*** Regional fixed effects ... (0.116)
Variance of the school-level random effect 0.440*** (0.0367)
Observations 105,241 Wald chi2 (43) = 16036.66
Number of groups 5,311 Prob > chi2 = 0.0000 Standard errors in parentheses
*** p<0.01, ** p<0.05, * p<0.1
Computer at home -0.364*** Portuguese speaking country 0.269***
(0.0519) (0.0990)
Internet at home -0.236*** Portuguese speaking country mother 0.130
(0.0628) (0.0842)
M ale 0.227*** Age 0.272***
(0.0354) (0.0165)
Unemployed father 0.146** Grade retention rate school 15.99***
(0.0700) (0.524)
Unemployed mother 0.126*** Social beneficiary (% school) -1.018***
(0.0395) (0.185)
Social beneficiary 0.488*** M other with primary education (% school) -1.244***
(0.0395) (0.177)
M other with primary education 0.360*** Portuguese speaking country (% school) 0.255
(0.0399) (0.525)
M other with higher education -0.842*** Regional fixed effects ... (0.119)
Variance of the school-level random effect 0.395*** (0.0371)
Observations 104,956 Wald chi2 (43) = 15704.89
Number of groups 4,917 Prob > chi2 = 0.0000 Standard errors in parentheses
*** p<0.01, ** p<0.05, * p<0.1
Dependent variable: probability of grade retention (2009) - NUTS fixed effects
Computer at home -0.432*** Portuguese speaking country 0.178*
(0.0500) (0.0974)
Internet at home -0.120** Portuguese speaking country mother 0.0765
(0.0580) (0.0808)
M ale 0.232*** Age 0.230***
(0.0332) (0.0170)
Unemployed father 0.172*** Grade retention rate school 15.18***
(0.0626) (0.444)
Unemployed mother 0.267*** Social beneficiary (% school) -1.128***
(0.0367) (0.164)
Social beneficiary 0.537*** M other with primary education (% school) -1.019***
(0.0379) (0.165)
M other with primary education 0.357*** Portuguese speaking country (% school) -0.505
(0.0370) (0.566)
M other with higher education -1.163*** Regional fixed effects ... (0.122)
Variance of the school-level random effect 0.398*** (0.0358)
Observations 105,934 Wald chi2 (43) = 15908.45
Number of groups 4,754 Prob > chi2 = 0.0000 Standard errors in parentheses
*** p<0.01, ** p<0.05, * p<0.1
Computer at home -0.285*** Portuguese speaking country 0.361***
(0.0545) (0.107)
Internet at home -0.251*** Portuguese speaking country mother 0.0621
(0.0604) (0.0888)
M ale 0.234*** Age 0.241***
(0.0365) (0.0184)
Unemployed father 0.197*** Grade retention rate school 16.83***
(0.0673) (0.551)
Unemployed mother 0.227*** Social beneficiary (% school) -1.147***
(0.0405) (0.190)
Social beneficiary 0.430*** M other with primary education (% school) -0.875***
(0.0411) (0.179)
M other with primary education 0.361*** Portuguese speaking country (% school) -0.692
(0.0405) (0.644)
M other with higher education -1.096*** Regional fixed effects ... (0.127)
Variance of the school-level random effect 0.366*** (0.0365)
Observations 98,983 Wald chi2 (43) = 15290.31
Number of groups 4,282 Prob > chi2 = 0.0000 Standard errors in parentheses
*** p<0.01, ** p<0.05, * p<0.1
Dependent variable: probability of grade retention (2011) - NUTS fixed effects
Computer at home -0.193*** Portuguese speaking country 0.0371
(0.0502) (0.0984)
Internet at home -0.283*** Portuguese speaking country mother 0.229***
(0.0534) (0.0749)
M ale 0.256*** Age 0.270***
(0.0324) (0.0171)
Unemployed father 0.359*** Grade retention rate school 12.13***
(0.0549) (0.422)
Unemployed mother 0.324*** Social beneficiary (% school) -0.696***
(0.0357) (0.162)
Social beneficiary 0.504*** M other with primary education (% school) -1.045***
(0.0377) (0.172)
M other with primary education 0.396*** Portuguese speaking country (% school) -0.0227
(0.0366) (0.679)
M other with higher education -1.194*** Regional fixed effects ... (0.106)
Variance of the school-level random effect 0.341*** (0.0306)
Observations 97,233 Wald chi2 (43) = 16953.99
Number of groups 4,083 Prob > chi2 = 0.0000 Standard errors in parentheses
*** p<0.01, ** p<0.05, * p<0.1
Appendix 3: Autocorrelation estimations.
Dependent Variable Grade Ret. Rate Grade Ret. Rate: L.A. Fixed Effects Grade Ret. Rate Grade Ret. Rate: L.A. Fixed Effects
Dependent variable lag ( ) 0.334*** 0.0484* 0.283*** 0.709*** 0.288*** 0.536***
(0.0260) (0.0264) (0.0285) (0.0603) (0.0884) (0.0768)
2009 -0.000245 -0.00975 0.701*** 0.00860*** 0.0247 0.878***
(0.00266) (0.0157) (0.0659) (0.00270) (0.0184) (0.113)
2010 0.00585** 0.0327** 1.020*** 0.0165*** 0.0561*** 1.208***
(0.00268) (0.0159) (0.0616) (0.00281) (0.0183) (0.0971)
2011 0.000372 -0.0504*** 0.774*** 0.00825*** -0.0202 0.739***
(0.00266) (0.0157) (0.0586) (0.00268) (0.0175) (0.0780)
2012 0.0164*** -0.0404** 0.670*** 0.0247*** 0.0781*** 0.777***
(0.00268) (0.0157) (0.0590) (0.00280) (0.0196) (0.0849)
Constant 0.0210*** 0.176*** -5.425*** -0.00216 0.102*** -3.920***
(0.00235) (0.0128) (0.176) (0.00369) (0.0250) (0.468)
Observations 1390 1,269 1,124 140 140 140
R-squared 0.131 0.030 0.236 0.570 0.217 0.564
Standard errors in parentheses
*** p<0.01, ** p<0.05, * p<0.1
Quartiles of the Grade Retention Rate
(Counties) All 4th Grade Students
Appendix 4: Maps of grade retention rate and culture of retention indicators’ values across Portuguese regions from 2007 to 2012.
2007
2012 2011
2010
Quartiles of the Grade Retention Rate (Counties)
4th Grade Students with Negatives Scores in
National Exams
2007 2008 2009
Quartiles of the Estimated Regional Dummies Coefficients (Counties)
2007 2008 2009
Quartiles of Grade Retention Rate
(NUTSIII) 4th Grade Students
2007 2008 2009
Quartiles of the Grade Retention Rate (NUTSIII)
4th Grade Students with
Negatives Scores in both National Exams
2007 2008 2009
Quartiles of the Estimated Regional Dummies Coefficients (NUTSIII)
2007 2008 2009