Work Project presented as a part of the requirements for the Award of a
Master Degree in Economics from NOVA
–
School of Business and
Economics
Structural Transformation in the Product Space:
Patterns and Implications
André Ferreira Coelho
Student no. 526
A project carried on Macroeconomics and International Economics
under the supervision of:
Professor Luís Catela Nunes
Professor Miguel Lebre de Freitas
Table of Contents
1. Abstract 2
2. Introduction 2
3. Literature Review 3
4. Product Density 7
4.1 Product Connectivity and Revealed Comparative Advantage 7
4.2 Product Proximity measures 8
4.3 Product Relatedness measures 8
4.4 Product Proximity and Relatedness – a brief comparison 9
4.5 Product Density measures 11
4.5.1 Proximity-based density 12
4.5.2 Relatedness-based density 13
5. Data 14
6. Empirical approach 15
7. Results 17
7.1 Non-parametric approach 20
7.2 Panel data Maximum Likelihood estimator 20
8. Conclusions 26
9. Limitations and Further Research 27
1.
Abstract
Product fundamentals are essential in explaining heterogeneity in the product space. The scope
for adapting and transferring capabilities into the production of different goods determines the
speed and intensity of the structural transformation process and entails dissimilar development
opportunities for nations. Future specialization patterns become then partly determined by the
current network of products’ relatedness. Building on previous literature, this paper explicitly
compares methodological concepts of product connectivity to conclude in favor of the density
measure we propose combined with the Revealed Relatedness Index (RRI) approach presented
by Freitas and Salvado (2011). Overall, RRI specifications displayed more consistent behavior
when different time horizons are equated.
Keywords: comparative advantage; structural transformation; learning-by-doing
2.
Introduction
Models of structural transformation have privileged the role of product fundamentals in
explaining similarity amongst products. At micro (firm) level, firms are likely to invest in new
products if there is scope for adapting and transferring existing capabilities and resources into
the production of that good. At a country level, achieving Revealed Comparative Advantage
(RCA) in a given good at a certain point in time is likely to be the reflex of past adjustments of
productive factors towards different goods and perhaps sectors.
Building on Hausmann and Klinger (2006, 2007) and Freitas and Salvado (2011)
outcomes-based and product specific measures of proximity and relatedness, this paper tries to convey
some light to the extent to which these concepts are valid approaches to capture product
connectivity in the product space. Once the product space is defined, different product density
definitions are proposed to capture aggregate network spillover effects triggered by the
products exported with RCA within a country. This measures summarize how related each
product is to the core capabilities of economies and the scope for adapting and transfer
specialization patterns along time and heterogeneous potential for countries’ economic growth.
This paper contributes to the literature by proposing an alternative, more intuitive, concept of
product density whose consistency is exhaustively tested against concepts already proposed in
the literature.
This paper is organized as follows: Section 3 briefly surveys relevant literature; Section 4
relates RCAs with product density and introduces relevant concepts and definitions; Section 5
describes the data used; Section 6 clarifies methodological aspects and the empirical approach
pursuit; Section 7 presents the main results; Section 8 concludes an Section 9 discuss some
limitations while suggest further improvements.
3.
Literature Review
It is been a long journey since Adam Smith (1776) and David Ricardo’s (1819) models of
comparative advantages for economic theory to explain why countries specialize in the
production of different goods and how countries’ specialization patterns evolve over time.
Particularly relevant is to understand what governs the process of structural transformation (i.e.
the process of changes in countries’ structure of comparative advantages and patterns of
specialization) and its implications in future specialization patterns and in countries’ related
economic performance.
Relevant economic literature goes back to the second half of 20th century where changes in
productive structure and production patterns were recovered to the center of academic
discussion. For Rostow (1956, 1959) economic take-offs were driven by self-sustained growth
in a limited number of productive sectors that set in motion a chain of spillover effects
diffusing industrial techniques into the remaining sectors. Kuznets (1957) claimed that the
association of international differences in economic efficiency and increases in factor
productivity drove the evolution of sectorial composition of modern economies and ultimately
in the nation’s income levels. Similar reasoning for economic growth can be found in Lewis
among sectors. Building on these ideas, Chenery and Taylor (1968) advocated uniform
patterns of change in countries’ productive structure as income levels have historically risen
controlling for different countries’ industry-oriented patterns and Kaldor (1967) drawing on
Young’s (1928) framework for macroeconomic spillovers, matched supply and demand side of
structural transformation. Also based on Young (1928), Matsuyama (1995) expanded the
notion of demand side spillovers that generate horizontal and vertical complementarities in the
presence of endogenized sectoral induced shocks.
More recently, economic sectorial interactions and their resultant impacts on patterns of
production have been addressed from microeconomic models of learning-by-doing and
information externalities. Departing from Arrow (1962) and Verdoom (1956), Barro and
Sala-i-Martin (1995) claimed that learning-by-doing works through a gear mechanism where firms’
capital stocks increase workers stock of knowledge that is disseminated through the economy
at zero cost. Romer (1986) summarized: once discovered, knowledge and capabilities are prone
to spill across sectors in economies. Stokey (1988) developed a DGE model where goods are
ranked according their fundamentals and production becomes endogenously determined by
learning spillovers leading to the introduction of new goods. Haussman, Hwang and Rodrik
(2007) proposed a model of local cost discovery with knowledge spillovers where
specialization patterns become partly undetermined and countries’ export basket produce
important implications on economic growth: “countries become what they produce”.
Based on data at product disaggregated level, Lall (2000) suggested that countries’ economic
performance is ultimately conditional on cumulative processes, knowledge spillovers and
technological agglomeration, factors neglected by neoclassical theories. Departing from
Wacziarg and Welch (2003) where evidence in favor of u-shaped form relating export
diversification and income was presented, Rodrik (2004) exhaustively reviewed industrial
policy practices claiming that its’ effectiveness is conditional on privates’ information
perception regarding latent externalities as it is on implemented micro-oriented policies.
relating product sophistication and exports’ income content and the value of countries’
unexploited specialization opportunities to the scope for future economic growth.
Proposing a model of structural transformation in the product space based on Diamond (1989),
Cabral (2000), Laezer (2003) and Hausmann and Klinger (2006, 2007), hereafter HK,
departed from an heterogeneous product space in the spirit of Segerstrom (1991), to
complement Romer’s (1988) varieties model and Grossman and Helpman (1989, 1991) and
Aghion and Howitt (1992) ladders models. Although not empirically tested, the model of
structural transformation proposed by HK (2006, 2007) assumed linear profits from
leapfrogging while costs are quadratic in distance, implying a heterogeneous product space
entailing diverse consequences for economic growth where stagnation can occur. Previous
works, namely Young (1991), contemplated improvements within products (vertical
improvements) as well as vertical shifts while neglecting product heterogeneity. Jovanovic and
Nyarko (1996) integrated vertical and horizontal shifts induced by technological improvements
in a learning-by-doing model where the bounded scope for product quality improvements
trigger spillover effects to different products based on factor similarities.
HK (2006, 2007) proposed pairwise conditional probabilities of two any products being
simultaneously exported by the same country to assess product proximity. In prior literature,
Ditezebacher and Lahr (2001) and Jaffe (1986) presented alternative concepts based on I-O
tables and technology spillovers. Freitas and Salvado (2011), hereafter FS, argued that
estimating product-based measures of product relatedness through latent variables models
presents significant improvements comparing with alternative approaches. This comparison is
central in this paper. For these authors, the general degree of relatedness among products,
called “density”, in the product space determines the speed and intensity of the structural
transformation process which translates in a continuous (but heterogeneous) upgrading of
countries’ export basket as unexploited opportunities (“open forest value” for HK (2006),
“upscale opportunities” for FS (2011)) in the productive structure are being explored.
Leamer (1984) and Lall (2000) cluster classifications frameworks. Earlier contributions
include Hirschmann (1957) industry forward and backward linkages, V.P. de la Potterie
(1997), Krugman (1991), and Krugman and Venables (1986) on patterns of industrial
conglomeration and clustering and Porter (1990, 1998) framework of critical mass for
geographical clusters induced by common institutional environment, knowledge sharing and
public goods.
Products’ income content and export sophistication levels were proposed in the literature by
Hausmann, Hwang and Rodrik (2007) with the purpose of evaluating countries’ unexploited
opportunities and to evaluate whether they are determinant in driving the process of structural
transformation. These concepts have been widely adopted and tested in relevant literature since
there. Empirical applications of product density as a driver of specialization patterns have been
combined with product sophistication literature and include Portugal (FS, 2011) and (Freitas e
Mamede, 2011), South Africa (Haussman, Rodrik, Sabel, 2008), Brazil (Hausmann, 2008),
Peru, Colombia, Equador and Chile (HK, 2007, 2008 and 2010), China, Malaysia and Ghana
(Badibanga, 2009) and Latvia (Vitola and Dãvidsons, 2008).
More recently, Hidalgo (2009) and Hausmann and Hidalgo (2010, 2011) proposed a
capabilities theory with increasing returns using a “method of reflections” and economic
spectral complexity where product sophistication and exports’ income content are proxied
respectively by product ubiquity and export diversification. The number of complementary
capabilities required by each product and available within a country becomes central in
determining current specialization patterns and potential for fostering subsequent economic
growth. Hausmann and Hidalgo (2010, 2011) method of reflections was empirically applied
using HS product classification by Felipe et. al. (2012). The Atlas of Economic Complexity
(2011) and Jankawska et. al. (2012) survey several countries.
This section presents a survey of the relevant literature developed in the last decades. In the
4.
Product Density
4.1Product Connectivity and Revealed Comparative Advantage
Connectivity amongst goods in the product space framed in the context of structural
transformation process are both conceived as the extent to which existing capabilities and
resources may be adapted and transferred into the production of different goods.
Rather than making à-priori beliefs of how each product contributes to the production of
another (eg. factor endowments, technological sophistication) in a heterogeneous product
space, the empirical strategy to be used in this paper relies on outcomes-based and product
specific measures that assume an agnostic position by letting data to give us some empirical
notion of the magnitude of such connectivity network, e. Rather than being a drawback,
requiring such invariability across countries is a condition to focus on trade export flows
instead of internal demand for domestically produced goods. The underlying reasoning is that
proximity and relatedness are uniquely motivated by product fundamentals and the degree to
which they are imperfect substitutes in the production of different goods, irrespectively of
country-specific considerations.
Further, proximity and relatedness measures should be harsh in capturing similarities in
product fundamentals and factor endowments in the product space, excluding marginal impacts
and similarities resulting from inefficient combinations of endowments and capabilities. Both
conditions are assured by requiring countries to have revealed comparative advantage in the
products they export.
Formally, RCA of country in good at time is defined following Balassa (1965):
∑
⁄ ∑
∑ ∑
⁄
Where:
is the value of country exports of product at time ;
∑ is the sum of country’s exports at time ;
∑ is the total of worldwide exports of product at time ;
∑ ∑ is the sum of worldwide exports at time ;
It was created a dummy variable taking the value 1 if country at time has revealed
comparative advantage in product .
{
Hence, RCA is used in both the construction of pairwise proximity and relatedness measures
that this paper wants to compare in order to extract some conclusions of how accurately they
give an empirical basis to predict structural transformation.
4.2Product Proximity measures
Departing from a symmetric measure of distance between each pair of products, HK (2006,
2007), argue that conditional probabilities (hereafter CP) would capture the contribution of
having revealed comparative advantage in one good associated with a revealed comparative
advantage in another good. The minimum between pairwise conditional probabilities would
ensure a proximity measure (i.e. equal contributions between products and ) and tackle cases
where a limited range of goods worldwide exported would overstate conditional probabilities
involving a good with low ubiquity.
{ ( ) ( )}
Following HK (2006, 2007), the product space at time is therefore represented by a squared
matrix of pairwise distances among products, which is shown to be highly heterogeneous.
Higher similarity in terms of capabilities and resources between a given pair of goods should
be reflected in a lower distance connecting them, captured by a higher conditional probability.
[
]
4.3Product Relatedness measures
Departing from not imposing symmetry in the matrix of pairwise distances, FS (2011),
presented an alternative method for disentangling the increment in the probability of having (2)
RCA in one product conditional on having RCA in another product. A Probit model was
proposed to capture this marginal effect, where the notation used above holds. For any two
products and :
( ) ( )
( ) ( )
Where ( ) is not necessarily equal to ( ) , represents the standard
normal cumulative distribution function and is the strength of the stimulus in associated
with RCA in .
Individual two-sided significance tests were performed in each coefficient and whenever they
were proven to be statistically significant at 5% significance level, the marginal effect was
computed. All the cases where coefficients were not proved to be statistically significant, a
missing value in the pairwise relatedness matrix was generated. FS (2011) contrast therefore a
“Revealed Relatedness Index” (hereafter RRI) with HK (2006, 2007) proximity concept.
̂ ̂ ̂
Under this approach, the correspondent matrix of RRIs where non-significant effects were
disregarded can be obtained1.
[
]
4.4Product Proximity and Relatedness – a brief comparison
While departing from different assumptions HK (2006, 2007) and FS (2011) modeling
approaches to assess product connectivity and relatedness produce notably diverse and
somehow contradictory implications.
By resorting to a parametric procedure to estimate relatedness across products in the product
space, FS (2011) were able to perform significance tests and disregard all the pairwise
1 Excluding circular probits equations and conditional probabilities (i.e when ) a total of 1070 1069 relationships we
obtained per year under each methodology. Overall, this yields more than 89 million estimated equations over the time frame considered. Detailed information can be found in section 5. Data.
(4)
(5)
relatedness proven not to be statistically significant. Taking into account different data sources
(FS used disaggregated data under the Harmonized System (HS) product classification while
HK (2006, 2007) papers relies on data at SITC product classification) the proportion of
statistically significant RRIs was shown to be only about 16.1%. Albeit the fact that FS (2011)
study employs only 2005 data, this figure challenges the assumption beyond HK (2006, 2007)
CPs approach, where every single pairwise proximity was validated and considered in the
construction of further concepts.
Provided that the more disconnected is a set of goods in the product space the more costly is to
adapt existing assets and technologies between them, efficiency in the productive process using
emulated assets and technologies will be a decreasing function of product’s distance. And
since countries have limited endowments of resources and capabilities available it is intuitive
to think that having RCA in one product might actually result in negative probability
increments in having RCA in a set of products differing considerably in terms of fundamentals.
Following Leamer’s (1984) commodity cluster classification, having RCA in some agricultural
products, for instance, might reduce the likelihood of having RCA in chemical industry. Also,
by construction a country cannot have RCA in all the products it exports. If a country achieves
RCA in a given good then, ceteris paribus, it has to be counteracted by a proportional decrease
in the RCA ratio for some remaining products. Those whose share decreases more would be
the least correlated in terms of product fundamentals. Contrary to HK (2006, 2007), who
restrict marginal contributions to be necessarily positive, parameterization of a Probit models
carried out by FS (2011) relaxes this assumption by allowing increments in probability in
having RCAs associated with simultaneous RCA in other products to be negative. Still, FS
(2011) claimed that marginal effects were found to be indeed negative only for 2.3%
relationships out of the total pairwise combinations of products and 0.4% if non-significant
ones were neglected.
HK (2006, 2007) rational behind imposing symmetry was to avoid situations where CPs
countries – become artificially upwards (downwards) biased, “reflecting the peculiarity of the
country and not similarity of goods” (HK, 2006). However, conceiving that the valuable
experience of producing in the production of equals the contribution of producing j in the
production of i would not capture true similarities between countries. Think about a final and
an intermediate good: producing the intermediate good is likely to endow a country with some
knowledge and capabilities useful in the production of the final good, whereas the opposite is
not necessarily true. FS (2011) pairwise contemporaneous estimation captures this dissimilarity
in crossed marginal effects, reflecting a more accurate perception of product relatedness.
Henceforth, RRIs might consist in a more precise measure of product relatedness by (i)
imposing significance tests, (ii) allowing for negative marginal contributions and (iii) by not
imposing symmetric relatedness. Notwithstanding, the possibility of representing graphically
the product space as it was originally done by Hidalgo et. al. (2007), Hidalgo (2009) and
Hausmann and Hidalgo (2011) is restricted to a symmetric notion of distance in the product
space.
4.5Product Density measures
Once proximity and relatedness concepts were clarified and some of its implications were
presented, we now turn our attention for measures that capture their implications at more
aggregated levels. Product density is defined following an inward perspective within a country
and it was first applied by HK (2006).
This measure captures the overall contemporaneous usefulness of all products in which a
country possess RCA to each product individually considered. The same is to say that density
condenses all the active spillover effects within a country motivated by product relatedness
“received” by a certain product. Further, similarity in terms of capabilities and assets with
countries’ overall specialization patterns would be translated in higher product density and
consequently in a higher likelihood of having (either attaining or sustaining) RCA in
4.5.1 Proximity-based density
Product density was first developed by HK (2006) in the context of their proximity concept to
illustrate that products’ proximity to a country’s export basket has some explanatory power
over the probability of developing RCA in the future. Formally, these authors defined density
of product at time as the sum of a country’s revealed comparative advantages excluding
good , weighted by the strength of their respective (non-negative) spillover effect towards
product , divided by product’s total received spillover effects.
∑ ∑
Even though this is a valid measure to capture product density, proximities should be the main
focus for relatedness with respect to a specific product instead of being the weight for the sum
of comparative advantages per country, which will be biased against countries with fewer but
more developed RCAs in comparison with countries with more and necessarily less significant
RCAs.
Recognizing this limitation, FS (2011) propose an alternative definition of density applied to
their RRI concept where the joint active relatedness involving product is divided by the
number of RCA present in a given country at a certain point in time. Despite the focus on
relatedness (here proximities) instead of on number of RCAs, we shall argue that this measure
may alternatively present some bias against products exported by countries with more but
weaker RCAs when compared with those products exported by countries with less and stronger
RCAs. In other words, two products with equivalent incoming paths strength, ∑ ,
will have different density levels, conditional on the number of active spillovers. Here, we
adapted the original formula to fit proximity as HK (2006, 2007) defined it and hereafter it will
be referred as weighted density.
∑ ∑
In order to address the drawbacks embodied in both formulas this paper, rather than (7)
complexify, simplify. We propose a crude density measure that captures aggregate product
proximity by summing the knowledge, capabilities and resources spillovers intrinsic to all
products containing RCA that surround product without the need to be weighted by anything
else. The underlying reasoning is that product density should be captured by proximity (or
relatedness) with the major products exported by one country – products in which a country
has RCA – instead of reflecting a weighted average of the number of products with RCA
within a country or a weighted average of proximity. The same is to say that density is best
given by the strength and number of active spillovers than by the average spillover effect.
∑
4.5.2 Relatedness-based density
Similarly to the product proximity approach, density concepts may be applied under the
context of product relatedness. There are, however, some differences in their application that
are worthwhile to note. In contrast with conditional probabilities, should be recalled that RRI
are allowed to capture negative marginal contributions between products. Henceforth, the
summation by product of their incoming paths, ∑ , might diverge remarkably from
their respective counterpart obtained under conditional probabilities. More concretely, while
∑ is dependent on the number of (non-negative) spillovers, ∑ , consists in an
aggregation of positive and negative effects, resulting that a vast majority of them will cancel
-out reciprocally. For this reason, scaled density has no meaning if computed using product
relatedness and is left outside from this analysis.
At a cost of the natural and mentioned limitations in comparing densities measures between
product proximity and relatedness dimensions, density definitions will be tested against each
other.
∑ ∑
∑
(9)
(10)
Now that we have presented the two alternative approaches to measure product connectivity
and their respective concepts capturing aggregated inward spillover effects, next section
presents the data employed in this paper.
5.
Data
Data employed in this study are yearly world trade export flows retrieved from Feenstra et. al.
(2005) available at NBER, ranging from 1962 to 2000 at 4-digit Standard International Trade
Classification (SITC4), Revision 2, consisting in 1070 products covering a total of 164
countries. This dataset was integrally constructed and complemented with an original product
sophistication variable, exports’ basket income-content variable and cluster commodity cluster
variables in the spirit of Leamer (2005) not employed in this work.
Trade flows are employed as reported (in nominal thousands of $US Dollars) since by
construction the methodological statistics computed and extensively applied throughout this
study do not require deflating nominal into real trade flows. Density-related variables applied
in sections 6.1. to 6.3. were exclusively derived from Feenstra et. al. (2005).
Although export datasets are available at higher level of product category disaggregation, they
generally either cover narrower periods of time or include a narrow sample of countries.
Further, databases constructed at higher disaggregation levels are not widely implemented and
the likelihood of misreporting in the actual export trade flows is enhanced. Also, data panels
are frequently not strongly balanced over time. Databases constructed from diverse product
classifications systems include the United Nations Harmonized System (HS), the North
American Product Classification System (NAPCS) or the Central Product Classification (CPC)
at diverse revision schedules.
While drawing on the UN Trade Commodity Trade Statistics Database (COMTRADE),
Feenstra et. al. (2005) gave primacy to importers’ reports over exporters’ reports as source of
bilateral trade flows, whenever they were available, assuming that the formers report data more
data reported by exporters is “Free on Board” (FOB).
Several other adjustments to verify consistency in data and to avoid double counting were
performed and are discussed in detail by the authors. UN-COMTRADE were merged and
compared against US Trade Statistics when US was a partner country in bilateral trade flows;
aggregate imports were cross-checked against the summation of reports at product level and
reporting from unidentified partners were adjusted.
From 1984 onwards, Feenstra et. al. (2005) only report bilateral data exceeding US $100,000
for several reasons. In order to address this issue two additional product categories were added
at SITC disaggregated level in this paper. Whenever trade flows at disaggregated level are
included but do not match the sum of higher product aggregation category, an extra category
accounting for that difference was created. By the same token, whenever trade flows are only
available at higher aggregation levels, an additional aggregate category at SITC4 was created.
Provided that it is not possible to observe SITC4 level products contained in both these
categories as it is our purpose in this paper, they were disregarded with exception for RCA
computations.
6.
Empirical Approach
Recovering the initial intuition behind product density, at micro (firm) level, firms are likely to
invest in new products if there is scope for adapting and transferring existing capabilities and
resources into the production of those goods. At a country level, achieving RCA in a given
good at a certain point in time is likely to be the reflex of past adjustments of productive
factors towards different goods and perhaps sectors.
The Empirical approach used in this paper tries then to validate product-specific measures in
assessing proximity and relatedness in the product space2 by (i) to assess which density
concept fits best the data within RRI and CP approaches, (ii) to provide a notion of different
density magnitudes for transition and static products, to (iii) give a notion of inertia patterns in
2 Due to different variables’ metrics and different observations included in different specifications due to the use of FE Logit
structural transformation across specifications. For robustness, tests and regressions were
repeated for different time-lag structures simulating short, medium and long run horizons
which provide some idea of persistency and consistency of results.
Results are divided in three sections. Section 7.1 presents some non-parametric empirical
evidence trying to capture dynamics in RCAs by restricting the analysis to the cases where
countries developed RCA in certain products between two different periods in time and
splitting the sample into products with and without prior RCA. Essentially, this approach was
designed to test whether products in which countries acquired RCA should be motivated by
higher past density levels comparing with cases in which countries did not developed RCA.
However, the inverse reasoning does not apply3. Different time-horizons corresponding to
short-run (1 year), medium-run (3 years) and long-run (5 years) are used to attest
time-consistency in product transitions.
In section 7.2 logit models were estimated using the within estimator (fixed effects), random
effects (individual effects) and the pooled (population average) models. Table 2 describes the
variables used. Given the time-varying nature of product density and the limited predictive
power of time-invariant variables in explaining RCA dynamics, Fixed Effect (FE) estimators
are expected to be consistent while Random Effects (RE) and Population Average (PA)
estimators are likely to inconsistent.4 In the context of ML estimation performed by binary
outcomes models, fixed, random and population-averaged non-nested models can compared
essentially on the basis of likelihood-derived criteria. Akaike’s (1974) Information Criterion
(AIC) and Bayesian Information Criteria (BIC) (Schwarz, 1978) are by far the most diffused
methods in the literature. With no exception both criterions favored FE models over alternative
3
At micro firm level, product density becomes irrelevant to explain which products have lost RCA between to different points in time. That is, density is relevant when firms perceive new opportunities probably with higher implicit PRODY; once firms are already producing a given good, they must be endowed with the required resources and knowledge, so that density around those goods does not play any role in explaining product’s discontinuity. Accordingly, no particular trend is expected to be found when looking at the dynamics behind losses in RCA. Nevertheless, this exercise was performed and it is available on request.
4
models, implying that most of the variation is indeed captured by the within estimator5.
Results presented in next section consider altogether density measures derived from proximity
(CP) and relatedness measures (RRI). Time persistency and revealed comparative advantage
inertia are tested by running model specifications over the three different time-lag structures
previously introduced.
Table 2 – Description of Variables
7.
Results
7.1 Non-parametric approach
In order to focus in consistent changes in RCA over time and leave aside the noise caused by
products swinging around the boundaries of RCA index, we generalize Hidalgo et. al. (2007)
approach of restricting the sample to contain only products without RCA at , splited into
“transition products” and “underdeveloped products” at time , to cover the entire sample.
Figure 1 presents the results. Panels A. and B. are restricted to RRI based densities and display
the histograms of past inverse density comparing their alternative definitions, while panels C to
E focus on CP derived densities. Al panels display inverse densities at and product groups
were defined according to whether at time (long- run) products have acquired RCA (blue
bars) or staid with (red bars). Inverse densities were used for graphical
convenience. To test whether transition and underdeveloped products follow the same
distribution under the different cases, Wilcoxon Rank-Sum tests were conducted, leading with
5
Some limitations behind FE ML estimator survived by Greene (2002) cannot be ruled out for small samples. This should not be a concern in this work.
Variable Description
Dummy variable taking the value 1 if country c has RCA in product i at time t+n
Dummy variable taking the value 1 if country c has RCA in product i at time t
lnden Logarithm of crude density (either with CP or RRI)
lnwden Logarithm of weighted density (either with CP or RRI) lnhden Logarithm of scaled density (only available for CP)
(12)
no exception to the rejection at 1% significance level of the null hypothesis of equal
Figure 1 – Density and Transition vs. Underdeveloped products
medians both groups somehow between and (blue bars) and those that stayed with
RCA lower than 0.5 (red bars) at time . Invariability in Wilcoxon Rank-Sum test results
across the different cases justifies its omission.
When comparing relatedness derived density distributions against proximity based density
distributions, apart the logical differences implied by both methods, there is no major evidence
favoring one approach. Products in which countries developed RCA were on average placed at
lower inverse densities (meaning higher densities) than those products in which countries did
not developed RCA. This pattern presents some evidence supporting the role of product
A
B
C
D
Legend: density histograms for transition products (blue bars) and underdeveloped products (red bars) comparing RCA 5
years apart. Panels A and B refer to RRI approach using Crude and Weighted density definitions, respectively; panels C, D and E refer to CP approach using Crude, Weighted and Scaled definition, respectively.
Source: Own computations.
A
B
C
D
density in determining subsequent specialization patterns across countries. Albeit the different
specifications used, there is no evidence favoring one particular concept of density in capturing
future RCA against the alternative concepts. Similar results do not allow for the election of a
particular density measure as capture dynamics of RCA based on product connectivity more
sharply. This is the first stylized fact presented in this paper. Following Hidalgo et. al (2007),
at the single product level we test whether average density of a given product was higher in
those countries where this product was a transition product than in countries where the product
was underdeveloped. If this is the case, we expect that the ratio between both averages – the
Discovery Ratio ( ), be higher than one for most of the cases in our panel. Formally,
[∑ ]
[∑ ]
Where stands for the density definition to be used, is the number of countries at time
where product was a transition product and is the total number of countries
contained in the panel. Tests were performed under multiple time-lag structures yielding
similar results. Table 1 displays the results.
Table 1 – and Discovery Factors (% Products with )
Discovery factors were shown to be always greater than its counterpart specifications for
equivalent time-lag structures under both RRI and CP specifications. Provided that product
average crude density was higher in countries were was a transition product compared with
countries where was underdeveloped vis-à-vis alternative density concepts, these results
Time-Lag structure Density measure
{ } 58.32% 86.94%
{ } 59.58% 87.81%
{ } 62.06% 87.89%
{ } 49.82% 73.30%
{ } 51.74% 71.69%
{ } 60.84% 71.29%
{ } — 85.97%
{ } — 86.99%
{ } — 87.06%
Source: Author’s calculations
support that a stronger association between past density and present RCA is indeed captured by
the concept this paper proposes. This is the second stylized fact in our work. Differences in
general absolute magnitudes between RRI and CP methods should however be noted and
interpreted with caution.
7.2Panel data Maximum Likelihood estimator
In this section, logit models6 were used to assess how past product density under different
specifications determines the probability of a country possessing RCA in a subsequent period
controlling for whether countries had already RCA in a certain product in a previous period.
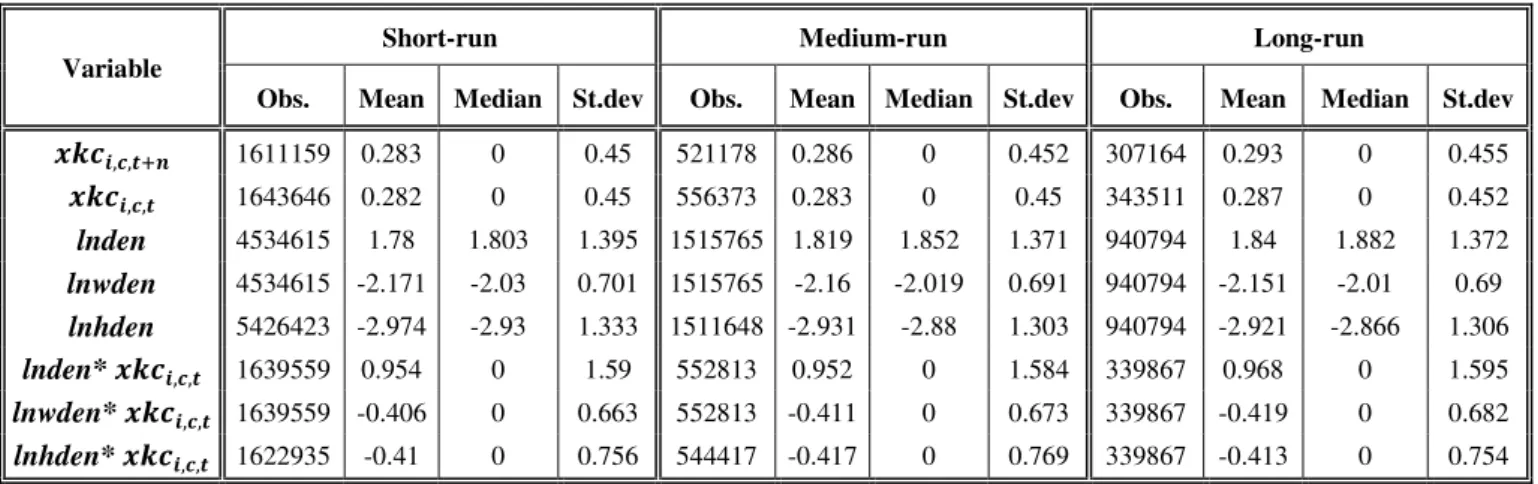
Sample descriptive statistics are displayed in table 3.A for RRIs and table 3.B for CPs. Results
are displayed in table 5.
Table 3.A – Summary Statistics
Variable
Short-run Medium-run Long-run
Obs. Mean Median St.dev Obs. Mean Median St.dev Obs. Mean Median St.dev
1611159 0.283 0 0.45 521178 0.286 0 0.452 307164 0.293 0 0.455
1643646 0.282 0 0.45 556373 0.283 0 0.45 343511 0.287 0 0.452
lnden 2656340 0.391 0.32 1.424 908587 0.402 0.338 1.42 559189 0.428 0.369 1.447 lnwden 2656340 -3.825 -3.715 1.2 908587 -3.825 -3.714 1.199 559189 -3.806 -3.689 1.217 lnden* 1262310 0.662 0 1.144 430901 0.667 0 1.143 264728 0.683 0 1.168 lnwden* 1262310 -1.022 0 1.498 430901 -1.018 0 1.49 264728 -1.029 0 1.5
Specifications (1) to (5) of table 5 show the results restricted for short-run impacts (two
consecutive years) of density on the probability of a future RCA, specifications 5 to 10 focus
on the medium-run impacts (3-year lag) and specifications 10 to 15 approach long-run impacts
(5-year lag).
Interaction terms between density variables and lagged RCA were included to test whether past
density has stronger predictive power explaining maintenance of or transitions into product
comparative advantage. Model specifications covering RRI and CP approaches were separated
6 Fitted probabilities computed through Logit and Probit models are remarkably similar and present only some discrepancy in
tails of the distribution for big enough samples. Given the less computationally demanding requirements behind the logistic cumulative distribution function, logit models were preferred over probit models. Logit coefficients are roughly 1.6 times the
Table 3.B – Summary Statistics
Variable
Short-run Medium-run Long-run
Obs. Mean Median St.dev Obs. Mean Median St.dev Obs. Mean Median St.dev
1611159 0.283 0 0.45 521178 0.286 0 0.452 307164 0.293 0 0.455
1643646 0.282 0 0.45 556373 0.283 0 0.45 343511 0.287 0 0.452
lnden 4534615 1.78 1.803 1.395 1515765 1.819 1.852 1.371 940794 1.84 1.882 1.372 lnwden 4534615 -2.171 -2.03 0.701 1515765 -2.16 -2.019 0.691 940794 -2.151 -2.01 0.69 lnhden 5426423 -2.974 -2.93 1.333 1511648 -2.931 -2.88 1.303 940794 -2.921 -2.866 1.306 lnden* 1639559 0.954 0 1.59 552813 0.952 0 1.584 339867 0.968 0 1.595 lnwden* 1639559 -0.406 0 0.663 552813 -0.411 0 0.673 339867 -0.419 0 0.682 lnhden* 1622935 -0.41 0 0.756 544417 -0.417 0 0.769 339867 -0.413 0 0.754
for convenience. The inclusion of time controls was jointly tested through conventional wald
tests, leading with no exception to the rejection of the null hypothesis at 0.1% significance
level. Given the nature of binary outcomes models, coefficients do not provide direct
interpretation7 of the impact on the probability of having RCA associated with changes in
density or lagged RCAs. Instead, probabilities are obtained evaluating the logistic cumulative
distribution function at particular values. This is the major limitation behind latent dependent
variable models.
In order to provide a more meaningful interpretation of the results, odds ratios were displayed
in addition to marginal effects, since in the context of logit models they allow a straightforward
interpretation8 9 of the odds for a future RCA divided into static and transition products and
allow us to confront the same specification over different time-horizons. Notice that for
interactions, no marginal effect is produced. Rather, marginal effects of interactions are
embedded in the individual marginal effects for the variables that generate the interaction. This
is why table 5 does not assign marginal effects to the interactions.
7 Only signs are valid indicators of the strength of the stimulus for future RCA.
8 In particular, marginal effects (ME) of interaction terms may be somehow difficult to interpret in the context of non-linear
models (Ai and Norton (2003), Norton et. al. (2004) , Corneliβen and Sonderhof (2009) and Greene et al. (2010)). MEs of interaction terms report variations from a global baseline while odds-ratios (i.e. multiplicative effects) disentangle effects departing from particular category’s baseline. MEs have becomingly suppressed from interaction terms to be absorbed by individual explanatory variables marginal effects in the literature. This is also discussed in Buis (2010) and Newson (2003). Panel data non-linear models pose additional challenges on interpreting interaction effects. Unobserved group level variables are dropped out from the model, being captured in the group level variance term. MEs under these situations fix unobserved group variables at their means while averaging over observed explanatory variables. Marginal effects become computed in a predictive basis assuming different specifications according to the model to be estimated. Additionally, Drukker (2008) cited by Cameron and Trivedi (2010) arguments in favor of using PA models in non-linear models.
9 MEs computed over latent variable FE models may mislead the “true” effects. We thank J.M.C. Santos Silva for pointing this
out. Kitazawa (2012) proposes to calculate hyperbolic transformations for FE models allowing the calculus of average elasticities.
Information criteria (IC) for non-nested model comparison were obtained and are displayed in
table 5. Akaike’ (1974) IC and Schwarz’ (1978) Bayesian IC favored unanimously crude
density specifications over weighted density specifications in both in RRI and CP approaches
for equivalent lag structure as the number of parameters is constant across specifications10.
However, under CP context HK (2006, 2007) density definition appears to provide a better fit
of the data. We can find here our third stylized fact highlighted by this paper.
As far as density is individually considered11, when crude, scaled and weighted densities are
confronted for equivalent approaches and time-lag structures, crude density specification
applied to RRI approach shown to have the behavior most compatible with economic intuition
(specs. 1, 6 and 11). This can be seen both in density coefficients or in corresponding marginal
effects (elasticities) and odds ratios. A 10% increase in crude density, contributes, on average
and ceteris paribus, to an increase of 1.25% in the probability of having future RCA in the
short run, 2.15% in the medium run and 2.99% in the long run. Odds ratios provide similar
conclusions some somehow less intuitive: a 1 unit increase in the logarithm of crude density
(roughly 2.56 units on density evaluated at mean), induces an increase in the odds of having
future RCA by 9% in the short run, 11,1% in the medium run and 12.7% in the long run.
Opposite results were obtained for CP approach applied to crude density (specs. 3, 8 and 13).
Here, the equivalent percentual variations in density led to variations of 2.39%, 1.91% and
1.55%, respectively in the long, medium and short run, in the probability of having RCA in a
subsequent period. All the remaining specifications (weighted and scaled definition)
surprisingly presented erratic patterns along time. In weighted run and the reverse case is
verified under scaled specifications. Overall, density measures show therefore to fit reasonably
well the data, showing to be highly significant in explaining future specialization patterns,
translated in a stronger impact in future RCA in long run. However, crude density as a
measure of connection between products that condensate the absolute sum of significant
10 Comparisons including scaled densities and among different time-lag structures are not valid measures of the general quality
2.179*** 0.086*** 0.188***
1.736 0.125 —
[8.837] [1.09] [1.207]
(160.18) (15.44) (27.82)
2.818*** 0.088*** 0.095***
2.39 0.128 —
[16.740] [1.092] [1.100]
(100.48) (15.23) (11.96)
1.306*** 0.450*** 0.335***
0.959 0.239 —
[3.691] [1.568] [1.398]
(42.33) (36.23) (37.15)
3.009*** 0.389*** 0.356***
4.098 0.911 —
[20.264] [1.475] [1.427]
(74.54) (20.58) (13.70)
3.049*** 0.306*** 0.361***
3.729 0.702 —
[21.099] [1.358] [1.435]
(168.86) (27.24) (35.80)
0.903*** .106*** 0.150***
1.344 0.215 —
[2.468] [1.111] [1.162]
(36.37) (11.29) (12.74)
1.556*** 0.097*** 0.117***
2.888 0.378 —
[4.740] [1.102] [1.124]
(32.15) (10.04) (8.28)
2.373*** 0.438*** 0.172***
1.084 0.191 —
[10.727] [1.550] [1.189]
(34.06) (18.39) (8.45)
2.764*** 0.473*** -0.146**
4.278 0.582 —
[15.868] [1.605] [0.864]
(33.35) (12.64) (-2.80)
3.422*** 0.233*** 0.249***
2.81 0.322 —
[30.630] [1.263] [1.283]
(86.06) (11.26) (11.28)
0.344*** 0.119*** 0.064***
0.873 0.299 —
[1.411] [1.127] [1.067]
(10.00) (9.53) (4.04)
0.731*** 0.094*** 0.077***
0.467 0.132 —
[2.078] [1.100] [1.080]
(11.40) (7.31) (4.12)
2.601*** 0.303*** 0.165***
1.288 0.155 —
[13.480] [1.350] [1.179]
(25.06) (9.12) (5.43)
3.062*** 0.375*** -0.071
3.322 0.359 —
[21.360] [1.455] [0.932]
(26.37) (7.07) (-0.98)
3.535*** 0.408*** 0.272***
3.812 0.654 —
[34.312] [1.504] [1.312]
(57.17) (10.68) (7.63)
Logit coefficients are predictive marginal effects of a positive outcome conditional on one positive outcome within group. [Odds ratio are reported in squared brackets.]
Marginal effects in italics. Z-statistics in parentheses (* p<0.05, ** p<0.01, *** p<0.001) Standard errors use observed information matrix (OIM ). AIC and BIC are respectively Akaike's (1974) and Schwarz's (1978) information criteria. Time controls included in all estimates.
(12)
(14)
(15)
S pec.
-18043.8 36105.5 36189.7 84750 -18129.0 36276.1 36360.2 84750 -23961.0 47940 48021.4 63355
(11) Relatedness measure (RRI) L o n g -r u n
-23936.4 47890.7 47972.2 63355
(13)
Proximity measure
(CP)
-18082.6 36183.1 36267.2 84750
(8)
Proximity measure
(CP)
-42574.7 85177.4 85318.2 172716
(9) -42754.3 85536.6 85677.4 172716
83116 99286
(7) -49658.3 99344.7 99482.2 136722
(6) Relatedness measure (RRI) M e d iu m -r u n
-49560.2 99148.4 136722
(10) -41473.8 82975.5 168868
(4) -205948.8 411978 412435 684207
(3)
Proximity measure
(CP)
-204739.1 409558 410016 684207
(5) -20408.1 404896 405353 675492
(1) Relatedness measure (RRI) S h o rt -r u n
-171935.6 343951 344401 569578
LL AIC BIC Obs.
(2) -172462.0 345004 345454 569578
Method
Impact xkc lnden lnden*xkc lnwden lnwden*xkc lnhden lnhden*xkc
inward impacts proved to offer a more reasonable behavior of structural transformation over
time while Information Criteria favors these specifications for RRI approaches. This is our
fourth stylized result.
Density interaction terms display positive coefficients’ signs for Crude and Scaled densities in
all time-lag structures, meaning that density has prominent role in explaining static behavior
(i.e. maintenance of RCA over time) rather than transitions from underdeveloped and boundary
products. Marginal effects as computed are not a valid indicator of these differences since they
are (correctly) embodied in the density variable marginal effect12. Odds ratios were then
computed to validate comparisons between transition and static products along time and are
presented in table 5 in squared brackets13. Irrespectively of the time horizon under analysis, the
gap between the probability of sustaining RCA and the probability of countries to develop
RCA in products without RCA in a previous period, shrinks for longer time horizons. This is a
consistent result for crude density equations for CP (specs. 3, 8 and 13) and for RRI approach
(specs. 1, 6 and 11) and also for weighted density specifications for CP (specs. 4, 9 and 14).
For instance, differences in odds ratios’ magnitudes range from 2.192 in the short run to 1.592
in the long run for Crude density CP specifications (specs. 3, 8 and 13), meaning that for a unit
increase in the logarithm of crude density and a given product in the short run, countries with
prior RCA in that product have 2.19 times more probability of sustaining comparative
advantage in the next year than countries without prior RCA have of developing it within the
same time period. Taking the same specification this gap between products with and without
previous RCA is reduced to is 1.8 times in the medium run and 1.69 times in the long run.
These results suggest that reallocation of resources and assets into the production of alternative
products with higher density (i.e. density for transition products) takes some time to produce
effects such that they are strong enough to overcome inertia favoring maintenance rather
12 See explanation in footnote 7.
13 For continuous variables, the odds ratio does not compare with a baseline or control group. Valid interpretations are
transformation in specialization patterns. Our fifth stylized fact is that although density is more
decisive in explaining maintenance of present RCAs than it is in contributing for the
development of new RCAs, this gap is remarkably shrunk in the long run.
In all specifications performed lagged RCA proved to be a strong predictor of future
probability of having RCA14. this path dependence is shown to be not only smaller for models
controlling for RRI derived density than for models controlling for CP derived density, as the
persistency of their autocorrelation function tends to decay as we move towards long-run
impacts. The implicit reasoning is that the impact of inertia in explaining the structure of
comparative advantages is remarkably reduced when time is given to firms to perceive and
adjust investments such that they can reach some production level enough for a country to have
developed a comparative advantage. The dynamics behind the process of structural
transformation in the product space is essentially static in the short run, becoming
progressively more flexible in the long run. How to verify this?
The odds15 for the probability of maintaining a previously obtained RCA relatively to the
probability of developing a comparative advantage in a new product decrease from 10.67
(short run) to 2.87 (medium run) and 1.7 (long run) for crude density specifications using RRI
approach (specs. 1, 6 and 11). The same is to say that in the short run products with past RCA
have 10.7 times more chances of sustaining RCA in than countries without previous RCA have
of developing it, while this difference is reduced to 1.7 in the long run. Similar results are
obtained when crude density is measured through CP approaches (specs. 2, 7 and 12). RCA
statics proved not have a stable decreasing impact under CP approaches throughout time as it is
intuitively expected. Altogether, these findings present strong evidence towards RCAs’ time
persistent behavior, strengthen further the evidence towards a strong inertia pattern in density
impacts mostly in the short and medium run. RRI approaches appear to capture more
14
Since binary outcomes models are being used, this is only directly evident from the magnitude of Z-statistics for previous RCA dummy variables in table 5.
15 Construction and interpretation of odds ratio done as in footnote 12. Differences in probability of developing subsequent
accurately this pattern over time. This is our sixth and last stylized result.
8.
Conclusions
Departing from previous works by HK (2006, 2007) and FS (2011) this paper represents an
attempt to bring some light on the validity of Conditional Probabilities and Revealed
Relatedness Index as measures of product connectivity. Additionally, a new measure of
product density was proposed and compared against alternative concepts in determining future
specialization patterns for different time horizons. Some stylized results were produced but
remarkable dissimilarities behind CP and RRI methodological approaches and econometric
applicability severely limited reaching clear-cut result favoring one approach.
Non-parametric results presented in section 7.1 followed previous tests conducted by HK
(2006, 2007) and Hidalgo et.al. (2007) and confirm prior findings in which structural
transformation does indeed depend on product density. Discovery ratios comparing average
density for transition and underdeveloped products shown strong evidence supporting our
crude density measure as best capturing subsequent RCAs.
Econometric specifications presented in section 7.2. provide mixed evidence. Information
criteria invariably elected crude density specifications as providing a more robust fit of
specialization patterns’ dynamics than the concept proposed by FS (2011) under CP and RRI
approaches for short, medium and long run as we have measured them. Despite a weaker
economic reasoning behind HK (2006, 2007) density definition in our view, it proved to
provide the best fit under the CP approach also proposed by the authors.
Overall, lagged crude density under RRI approach shown to have produced the most consistent
effects in the probability of future RCA along time. Density has a reinforced explanatory
power over specialization patters for longer time horizons where firms have time to adjust their
decisions and reallocate assets into the production of different goods.
The inclusion of an interaction term between density and prior RCA allowed to conclude that
country developing RCA in new products even though this difference is relaxed in the long
run. Density odds for future RCA proved, however, to be reduced by about 11% between the
short and the long run for crude density in RRI specification and by about 80% for CP
specifications. Density is determinant in explaining specialization patterns, particularly under
an inertia context where products have historically been produced with comparative advantage.
In the long run inertia in density impacts for transition and static products is drastically
loosened.
Mostly under CP approaches, path dependency static behavior in specialization patterns
ignoring density impacts was proved to be remarkably strong. In fact only RRI specifications
displayed a decreasing static impact of current RCA structure in future specialization patterns.
Here, the odds of having RCA in a subsequent period given contemporaneous RCA decrease
from 10.7 (crude density) and from 18.4 (weighted density) in the long run to respectively 1.7
and 2.2 in the long run.
Overall, this paper presents somehow strong evidence favoring RRI approaches over CP
approaches and elected our crude measure facing alternative concepts as the one presenting a
behavior more compatible with economic intuition.
9.
Limitations and Further Research
While an eminently empirical paper that departs from the postulate whereby products are
related in the product space in terms of capabilities and assets without a formal model for
structural transformation, this work is somehow conditional on hypothesis accepted but not
directly tested. Models of learning-by-doing, cost discovery and information spillovers are the
main references for the theoretical framework presented by HK (2006).
Substantial presumption and hypothesis taken as given should always be subject to discussion:
(i) whether historical trade disaggregated data has been reported with acceptable accuracy, (ii)
whether CPs and RRIs are valid concepts of product connectivity given that they are simply
assuming vertical improvements but neglecting horizontal innovations are representative of the
product space empirically observed in daily routines, (iv) weather it makes sense to exclude
non-tradable goods and internationally traded services from models of structural
transformation in a globalized world, (v) whether firms can effectively perceive new
opportunities in the product space if they rationally (have ability to) guide their investment
decisions based in density and income content criteria, just to name a few, are questions that
should always make academia to question the extent to which the models it proposes are
suitable, tough partial, representations of reality.
Further research may extend this work by integrating product-based density measures with
product’s sophistication (Prody) and country’s income content implicit in their export basket
(Expy) in order to verify whether structural transformation is being made towards upscale
products, benefiting nation’s economic performance. In addition, drawing a framework where
future specialization patterns are conditional on variables with some predictive power (i.e.
Prody, Expy, GDP, industrial product classification) allow empirical research to confront past
observed structural dynamics with an out-of-sample forecasting experiment or an alternative
partial adjustment model where patterns of specialization evolve as a fraction of the predicted
evolution.
10.
References
[1] Aghion, P. Howitt, P. 1992. “A model of growth through creative destruction”. Econometrica 60(2): 323-351. [2] Akaike, H. 1974. “A new look at the statistical model identification”. IEEE Transactions on Automatic Control,
19(6): 716–23.
[3] Amemiya, T. 1981. “Qualitative response models: A survey”. Journal of Economics Literature, 19: 1483-1536. [4] Arrow, K. 1962."The economic implications of learning by doing". Review of Economic Studies, 29(3): 155 -
173.
[5] Badibanga, T., Diao, X., Roe, T., Somwaru, A. 2009. “Dynamics of Structural Transformation: Na Empirical Characterization in the Case of China, Malaysia, and Ghana”. IFPRI Discussion Paper No. 00856, April.
[6] Balassa B. (1965) “Trade Liberalization and Revealed Comparative Advantage.” The Manchester School of Economic and Social Studies 3(2), 99-123.
[7] Barro, R. J., Sala-i-Martin, Xavier. 1997. “Technological Diffusion, Convergence and Growth”. Journal of Economic Growth, Spinger, vol. 2(1), 1-26.
[10] Chenery, H., Taylor, L. 1968. “Development Patterns: Among Countries and Over Time”. The Review of Economics and Statistics, 50(4): 391-416.
[11] Dietzenbacher, E., Lahr. 2001 “Input-output analysis: frontiers and extensions” Palgrave, NY
[12] Feenstra, R., Lipsey, R., Deng, H., Ma, A., Mo, H. 2005. “World Trade Flows: 1962-2000”. NBER Working Paper No. 11040, January.
[13] Felipe, J., Kumar, U., Abdon, A., Bacate, M. 2012. “Product Complexity and Economic Development”.
Structural Change and Economic Dynamics, 23: 36-68.
[14] Freitas, M., Mamede, R. 2011.”Structural Transformation of Portuguese Exports and the Role of Foreign -Owned Firms: A Descriptive Analysis for the period 1995-2005”. Notas Económicas, Junho: 20-43.
[15] Freitas, M., Salvado, S. 2011. “Industry Similarities and Upscale Opportunities for Portugal: an Empirical
Assessment Based on 2005 Trade Data”. Working Paper, May.
[16] Grossman, G. & E. Helpman. 1989. “Product development and international trade” The Journal of Political Economy 97(6): 1261-1283.
[17] Grossman, G. & E. Helpman. 1991. “Quality ladders in the theory of growth” Review of Economic Studies
58(1): 43-61.
[18] Hausmann, R. 2008. “In Search of the chains that hold Brazil back”. CID Working Paper No. 180, September.
[19] Hausmann, R., Hidalgo, C. 2010. “Country Diversification, Product Ubiquity, and Economic Divergence”. CID
Working Paper No. 201, October.
[20] Hausmann, R., Hidalgo, C. 2011. “The Network Structure of Economic Output”. Journal of Economic Growth, 16: 309-42.
[21] Hausmann, R., Hidalgo, C. et al. 2011. “The Atlas of Economic Complexity: Mapping Path to Prosperity”. New
Hampshire: Puritan Press.
[22] Hausmann, R., Hwang, J., Rodrik, D. 2007. “What you export matters”. Journal of Economic Growth, 12(1): 1-25.
[23] Hausmann, R., Klinger, B. 2006. “Structural Transformation and Patterns of Comparative Advantage in the
Product Space”. CID Working Paper No. 128, August.
[24] Hausmann, R., Klinger, B. 2007. “The Structure of the Product Space and the Evolution of Comparative
Advantage”. CID Working Paper No. 146, April.
[25] Hausmann, R., Klinger, B. 2007. “Structural Transformation in Chile”. Quantum Advisory Group, Analytics for a Discontinuous World, June.
[26] Hausmann, R., Klinger, B. 2008. “Achieving Export-Led Growth in Colombia”. CID Working Paper No. 112, September.
[27] Hausmann, R., Klinger, B. 2008. “Growth Diagnostics in Peru”. CID Working Paper No. 181, September. [28] Hausmann, R., Klinger, B. 2010. “Structural Transformation in Ecuador”. Inter-American Development Bank,
Country Department Andean Group, Policy Brief No. 112, April.
[29] Hausmann, R., Rodrick, D., Sabel, C. 2008. “Reconfiguring Industrial Policy; A Framework with an
Application to South Africa”. CID Working Paper No. 168, May.
[30] Hidalgo, C. 2009. “The Dynamics of Economic Complexity and the Product Space over a 42 year period”. CID Working Paper No. 189, December.
[31] Hidalgo, C., Klinger, B., Barabási, A., Hausmann, R. 2007. “The Product Space Conditions the Development of
Nations”. Science, 317: 482-487.