INSTITUTO POLITÉCNICO DE COIMBRA Escola Superior Agrária de Coimbra
Ecotoxicological characterization of aquatic systems
within closed municipal solid waste landfill areas
i
I would like to express my special thanks of gratitude to my supervisors Prof. Dr. Rui Ribeiro and Dr. Matilde Moreira-Santos who gave me the golden opportunity to do this wonderful project on the subject of Aquatic Ecotoxicology at the prestigious Instituto do Mar (IMAR-CMA) at the Universidade de Coimbra. I am really thankful to them for all the support and time that they were always giving to me since the early stages of the development of this project to the submission of this thesis. Also, I want to express my gratitude to the support by the team at IMAR-CMA, particularly to the Aquatic Ecotoxicology team, since their commitment motivated me to learn how to work in the lab and get my job done in order to finish my master thesis, a d to the “oil Ecoto icolog tea i ol ed i the project ERAWasteLand - Ecological Risk Assessment of Closed Municipal Solid Waste Containment Areas , hich as the oti atio behind this master thesis, for all their support in designing the study plan and in the field work.
I am grateful to my college coordinator Prof. Fernanda Ferreira who gave me the opportunity to know, through the classes of Ecotoxicologia, the laboratory and the opportunity to get my master thesis done at IMAR-CMA and for all the support given.
Lastly but not least, I also would like to thank my family who helped me a lot with their patience, to work hard and keeping me focus on achieving my educational goals. My father João Oliveira, my mother Maria de Lurdes Canelas and my little sister Beatriz Oliveira who are always my source of encouragement and are always supporting me with their love. I am grateful to all my friends, especially Francisco Almeida for all the encouragement and support through these months.
ii
Contents
Acknowledgements i
Table of contents ii
Abstract iii
Resumo v
Chapter 1 Introduction 1
1.1.General introduction 1.2.Case of Study 1.3.Study Objectives
1 2 7
Chapter 2 Materials and Methods 10
2.1. Study Case 2.2. Study Design
2.3. Collection and characterization of water and sediment samples 2.4. Test organisms
2.5. Ecotoxicity tests 2.6. Data analysis
10 11 13 17 19 22
Chapter 3 Results 24
3.1. Ecotoxicological characterization of matrices within the landfill program
3.2. Ecotoxicological characterization of matrices within and outside the landfill area 24 28
Chapter 4 Discussion 34
3.1. Ecotoxicological characterization of matrices within the landfill program
3.2. Ecotoxicological characterization of matrices within and outside the landfill area 34 38
Chapter 5 Conclusion 41
iii
iv
to leachate. The obtained results either demonstrated that further intervention should be taken, since there is no clear information about the source of the contamination of groundwaters and surface waters.
v
vi
relacionada com o lixiviado. É importante sublinhar, que os resultados do presente estudo relativamente aos testes de toxicidade sobre as amostras que não fazem parte no programa de monitoramento do aterro, não revelaram toxicidade, pelo menos devido ao lixiviado. Os resultados obtidos demonstraram também que deve ser continuada a investigação visto que não existe informação clara sobre a fonte da contaminação das águas subterrâneas e superficiais.
Palavras-chave: Risco ecológico, bateria de testes, lixiviado, águas subterrâneas, eluatos de
1
Introduction
1.1 GENERAL INTRODUCTION
Ecosystems integrate countless numbers of organisms from micro-organisms to plants and
animals that interact dynamically in complex ways among themselves and with their physical
environment. Many factors affect the dynamics of an ecosystem and hence the balance within
it (light, temperature, energy and nutrient supplies, competition, predation, pollution and
disease). The most important property of an ecosystem is its robustness; for instance the way
it can withstand or adapt to changes which affect its dynamics. Included in this robustness is its
a ility to retur to or al status after the cessation of the stimulus to which it is sensitive.
(Aldridge, 1996). The possibility of irreversible change which will reduce biological diversity is
most worrying (Aldridge, 1996).
Ecosystems have been largely impacted by increasing human population growth and changing
global processes. Various habitats have lost a significant proportion of their species and might
be in greater danger of further losses from intense anthropogenic impacts, such as dams,
pollution, overfishing and other threats (McAllister et al., 1997). In particular, the contamination of the aquatic environment with high amounts of chemicals posing most of the
times unintended effects on ecosystems has reached regional and global scales
(Schwarzenbach et al., 2006), with their high complexity influencing the fate and bioavailability
of chemicals which will directly or indirectly affect the biota (Schmitt-Jansen et al., 2007).
Nowadays, toxicological studies of the environment can still be mostly characterized as
environmental toxicology studies, which are conducted independently from ecological
considerations, though perhaps subsequently compared to ecological studies in a
Chapter 1 - Introduction
2
environmental assessment can be realized by monitoring the status of communities in real
ecosystems and/or through the use of ecotoxicity tests conducted at different levels of
biological organization, being the most common single-species laboratory toxicity tests
employing organisms that can readily be obtained, cultured and tested (Burton et al., 2002).
The elemental assumption of the ecotoxicological approach is that toxicants impact molecular,
cellular and physiological processes, and therefore have the potential to adversely affect the
health of individual organisms (Baird et al., 2007); effects that might propagate and impair ecosystem function through effects on populations (Loreau et al., 2002). Ecotoxicity tests allow
establishing causal relationships between contaminants and biological effects, which, at least
at the laboratory scale, are typically based on measures of survival, individual growth and
reproduction (Aldridge, 1996). Although such an approach is a considerable oversimplification
of real ecological conditions, the establishment of such cause-effect relationships has been
proven to be very useful to address the impacts of various types of environmental wastes,
including impacts on municipal solid waste containment areas (Keuter et al., 2011).
1.2 MUNICIPAL SOLID WASTE
The high consumerism of our society has led to critical increases in the production of waste,
which accumulates and eventually is deposited in public areas often unsuitable for this
purpose (dumps), though at present most dumps have been turned into closed landfills and
new landfills have been constructed. The issue of waste has become a big worldwide problem,
with consequences that go beyond the concerns on our environment; there is a lack of
sustainability across the linear cycle of production, consumption and disposal of materials,
which in addition to depleting natural reserves has turned our planet into a wide garbage
dump causing the degradation of the environment and affecting the health of the population
3
the earth, this capability has been proved insufficient to absorb all impacts caused by the
generation of waste arising from human activities (Morejon, 2011).
Mu icipal Solid Waste MSW , co o ly called trash or gar age, i cludes wastes such as
durable goods (e.g. tires, furniture), nondurable goods (e.g. newspapers, plastic plates/cups),
containers and packaging (e.g. milk cartons, plastic wrap), and other wastes (e.g. yard waste,
food). This category of waste generally refers to common household waste, as well as office
and retail wastes, but excludes industrial, hazardous and construction wastes (Center for
Sustainable Systems, 2014). The handling and disposal of MSW is a growing concern as the
volume of waste generated continues to increase worldwide. Moreover, for instance, in the
U.S.A., over the past several years, there is still significant controversy concerning the proper
management of the residues from MSW and their regulatory classification as hazardous or
non-hazardous waste. This controversy and other factors (e.g. lack of legislative guidance,
contaminants content, etc.) have resulted in inconsistent management requirements and
uncertainty about beneficial utilization of the residues (Wiles, 1996).
MSW generation continues to grow both per capita and in overall terms. Waste production
increased by 3 and 4.5% per year between 1992 and 1996, in Norway and in the U.S.A.,
respectively (Renou et al., 2008). In 2002, French population produced 24 million tons of MSW,
namely 391 kg per person (Renou et al,. 2008). During the latter part of the 1990s, annual waste production ranged from 300 to 800 kg per person in the most developed countries to
less than 200 kg in other countries (Renou et al., 2008). In 2009, Americans generated about 243 million tons of garbage and recycled and composted 82 million tons of this material (EPA,
2010). Since 1990, the total amount of MSW going to landfills dropped by more than 13 million
tons, from 145.3 million to 131.9 million tons in 2009 (EPA, 2010).
The adverse effects of MSW on the environment and public health have been widely reported
Chapter 1 - Introduction
4
et al., 1998), overall pointing to deficiencies in the collection and disposal systems. Besides potential health hazards, the concerns about a landfill include fires and explosions, vegetation
damage, unpleasant odours, landfill settlement, groundwater and surface water pollution, air
pollution and global warming (El-Fadel et al., 1997).
MSW comprises 10% of the total waste generated in the European Union and has been an
important focus of European legislation, due to its complex and variable composition and its
distribution among waste generators (Blumenthal, 2011). Council Directive 99/31/EC (EC,
1999) was created to prevent or reduce as far as possible negative effects on the environment
(in particular on surface water, groundwater, soil, air, and human heath) caused by the
landfilling of waste, by introducing stringent technical requirements for waste and landfills; a
policy for all members of European Union based on which each member has to create their
own legislation in order to comply with this Directive.
In Portugal, a revolution in the waste sector occurred due to the approval, in 1997, of the
Strategic Plan for Municipal Solid Wastes I and the definitive closure of all the 314 active
dumps (Russo, 2005). Several municipal systems of waste management were created,
including the construction of sanitary infra-structures of MSW containment, the landfills. In
fact, landfill disposal constitutes the simplest and most cost-effective method of MSW
management, despite the European directives addressing the sustainable waste management
through their reduction, recycling, composting, and energetic valorisation (EC, 1999). Much
national legislation and programs that recommend/obligate that landfills must be monitoring
and controlled prior to and after their establishment has been issued; a summary of
Portuguese legislation is presented in Table 1. According to Decree-Law no. 183/2009
(Decreto-Lei n.º 183/2009), concentration limits for several physico-chemical parameters
(including contaminants such as metals and organic compounds) in leachates, groundwater
5
environment, the landfill operator shall submit to the competent authority, once a year, a
report synthesis on the state of the landfill after its closure, specifying the maintenance
operations and the results of checks carried out during the previous year (Decreto-Lei n.º
152/2002; Annex IV, Part II, point 10.6). However, there is no control of the
ecological/biological information. Particularly, none of the policies regulates the
ecotoxicological characterization of the various matrices towards the ecosystems within and
surrounding closed landfills (see also below).
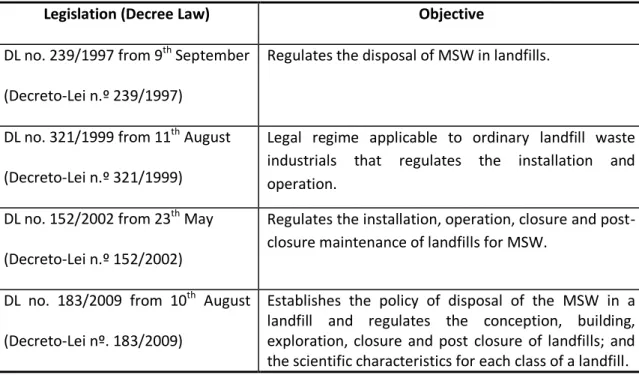
Table 1. Summary of Portuguese legislation on landfills and its objectives
Legislation (Decree Law) Objective
DL no. 239/1997 from 9th September
(Decreto-Lei n.º 239/1997)
Regulates the disposal of MSW in landfills.
DL no. 321/1999 from 11th August
(Decreto-Lei n.º 321/1999)
Legal regime applicable to ordinary landfill waste industrials that regulates the installation and operation.
DL no. 152/2002 from 23th May
(Decreto-Lei n.º 152/2002)
Regulates the installation, operation, closure and post-closure maintenance of landfills for MSW.
DL no. 183/2009 from 10th August
(Decreto-Lei nº. 183/2009)
Establishes the policy of disposal of the MSW in a landfill and regulates the conception, building, exploration, closure and post closure of landfills; and the scientific characteristics for each class of a landfill.
Landfills are today the most widespread medium and lower cost for the storage of MSW, but
the fact that they are stocked does not mean they are inactive. Storage conditions as well as
the influence of natural agents (rain and microorganisms) activate physical, chemical and
biological processes transformation. The elements are dissolved in water, fine particles are
detached and the bioconversion of the soluble organic material into gaseous forms occurs; all
Chapter 1 - Introduction
6
retention capacity of a residue. Leachate comes from three main sources: moisture natural
waste, the water by product during the decomposition process and the liquid expelled from
organic materials by bacteria in the form of enzymes (Castilhos et al., 2003).
Leachate occurrence is by far the most significant threat to groundwater and ultimately also do
surface water. Once it reaches the bottom of the landfill or an impermeable layer within the
landfill, if not properly collected in wells, leachate either travels laterally to a point where it
discharges to the grou d’s surface as a percolate, or it will move through the base of the
landfill and into the subsurface formations (El-Fadel et al., 1997). For instance, a study by Mattos (2006) found high levels of metals, in aquatic ecosystems near a landfill.
Pollution caused by landfill leachates is one of the main problems of urbanized areas, on
account of their chemical composition, and major concerns about landfill leachates are
threefold: their difficulty in treatment, their toxic potential and their microbiological
composition (Kjeldsen et al., 2002). Potential contaminants in landfill leachates can be
categorized into four major groups: dissolved organic matter, inorganic macro components,
metals, and organic compounds; with existing data showing high concentrations of all leachate
components in the early acid phase due to strong decomposition and leaching (Kjeldsen et al.,
2002).
The presence of the potential toxic substances can be directly detected through chemical
analysis. However, chemical analyses do not indicate which proportion of the chemical is
bioavailable to organisms neither the associated potential antagonistic and/or synergistic
effects of the existing mixture contaminants. Thus, the inclusion of the biological/ecological
component in the current monitoring programs of closed landfills is essential to obtain a more
realistic view of the potential impacts over time. Ecotoxicity tests will allow establishing the
causal relationships between chemical concentrations and the biological effects observed
physico-7
chemical and ecotoxicological characterization in order to facilitate the eco-management of
the leachates. The latter authors used 21 samples comprising untreated leachates or compost
leachates from MSW landfills collected at different seasons and with highly variable
composition, depending on several factors such as waste composition and age, precipitation
rate, and landfill management. Daphnia magna lethal toxicity tests showed toxicity for all 21 samples, suggesting that the toxicity of leachate was maintained in time within the same
landfill.
1.3 STUDY OBJECTIVES
The present study is part of a broader research project intending to design a framework for
long-term ecotoxicological/ecological monitoring of closed landfills (MSW containment
structures). It covers the work focused on the aquatic compartment and has as main objective
to determine the risk of a closed landfill, sealed in 2006 and with an area of 19 ha, towards
adjacent aquatic systems by conducting the ecotoxicological characterization of potentially
contaminated matrices to which aquatic organisms might be exposed.
To fully investigate whether the landfill leachate – the main source of contamination of a
closed landfill – is a potential source of contamination for aquatic systems in the area and the
extent of such potential contamination, various types of matrices were ecotoxicologically
characterized, namely, the leachate itself, groundwater collected from piezometers at the
fringe of the landfill, water from a puddle within the landfill, soil extracts from sites within and
adjacent to the landfill area, and water and sediment samples from adjacent aquatic systems.
Soil extracts, i.e., eluates, were used as a measure of the soil retention capacity, which is the
capacity of a soil to retain contaminants precluding them to be leached through the soil-water
Chapter 1 - Introduction
8
To fully evaluate the risks posed by the landfill to aquatic systems and, thus, the ecological
receptors at most risk via exposure to this type of contamination, while intending to contribute
for long-term monitoring programs, a battery of short-term sub-lethal laboratory toxicity tests
was selected to test the various types of matrices. The battery of tests included species both
originated from standard laboratory cultures and naturally occurring, being all indigenous in
Portuguese habitats to minimize uncertainty. Also, species were selected to cover a range of
organisms representative of different key taxonomy (bacteria, algae, rotifers, cnidarians,
crustaceans, and insects) and functional groups (primary producers, primary and secondary
consumers, benthic and epibenthic decomposers). For samples shown to be toxic their toxicity
was quantified in the form of a point estimate of the effective concentration toward a certain
percentage of test organisms (e.g., the median avoidance effective concentration [EC50]) to
allow sensitivity comparisons across the various ecological receptors.
The following null hypotheses being tested were: i) the organisms responses in control
exposures were equal to those in leachate exposures, at two seasons; ii) the organism
responses in control exposures were equal to those in groundwaters; iii) the organism
responses in control exposures were equal to those in water from a puddle within the landfill;
iv) the organism responses in control exposures were equal to those in soil extracts from sites
within and adjacent to the landfill area; and v) the organism responses in control exposures
were equal to those in water and sediment samples from adjacent aquatic systems. Expected
results were: i) leachate exposures result in greater ecotoxicity than control exposures, as
leachate is still being produced within this recently closed landfill with an extensive area of 19
ha, with pollution levels after a rainy season either highest, due to increased leachate
generation by the augmented weight of the top layer impermeable cover, or lowest, due to
leachate dilution by groundwater infiltration; ii) groundwater exposures result in greater
ecotoxicity than control exposures, due to deficiencies (e.g. leakages) in the system of capture
9
extracts within the landfill result in greater ecotoxicity than control exposures, due to the
occurrence of leachate overflow; exposures of (iv) soil extracts nearby the landfill and of (v)
river water and sediment from aquatic systems nearby the landfill, due either to the
occurrence of leachate overflow coupled with deficiencies in the drainage of surface water to
the rain water drainage system of the landfill, or to the infiltration of contaminated
10
Chapter 2
Materials and Methods
2.1 STUDY CASE
All information here disclosed is the minimum required to understand the study design and is
not complemented with bibliographic citations for reasons of confidentiality.
To accomplish the aim of the present study, a landfill constructed in 2006 to close a dump with
an area of 19 ha was selected as the study case. The dump was active during 30 years which
led to the deposition of 2 500 000 tonsof MSW and its closure clearly aimed to solve the
adverse environmental impacts, particularly regarding water, soil and air pollution, and also
the impact on the co-existing populations. The dump was sealed by covering the pile of MSW
with an impermeable coating above which a soil layer of approximately 40-cm depth was
placed. Systems installed for environmental protection and monitoring of emissions consisted
of capture and drainage of gases and leachate and drainage of surface water to the rain water
drainage system of the landfill. Measures to restore the landscape were also implemented,
namely, an arboreal curtain in the external limit and a vegetation cover (meadow type) in all
the area with shrubs and trees of species similar to those of the surrounding area.
To comply with Portuguese legislation (Decreto-Lei n.º 152/2002; Decreto-Lei n.º 183/2009),
not only regarding the final covering and the landscape restoration, there is a post-closure
monitoring program in what regards meteorological data, environmental noise, topography,
gas and leachate emissions and groundwater quality; being the latter three monitored through
a detailed physico-chemical characterization of the respective matrices, at least two times per
year. To monitor groundwater quality five piezometers installed along the entire perimeter of
the landfill allow the collection of groundwater samples from the aquifer underlying the
11 2.2 STUDY DESIGN
To accomplish the aim of the present study it was essential to identify the potential ecological
receptors at most risk in the area within and near the landfill due to exposure to the main
source of contamination of a closed landfill – the leachate. Aside from the leachate itself, the
following types of matrices, those that can most likely be contaminated by the leachate, were
selected to be ecotoxicologically characterized (Figure 1): groundwater collected from four of
the five piezometers installed at the fringe of the landfill (Pz2, Pz3, Pz4, and Pz5; for logistic
reasons of groundwater accessibility Pz1 was not selected), water collected from a puddle
within the landfill (Pd; although it was collected after a few days with rainfall it could also
represent an overflow of leachate), soil extracts, i.e., eluates, from sites within and adjacent to
the landfill area not only to determine the possible occurrence of leachate overflow but also of
surface runoff from the top to the bottom of the landfill (S28, S38, S63, S70, S73, and S83), and
water and sediment samples from two water courses nearby the landfill (Pw1,Pw2, Pw3, Pw4,
Pw5, Ps1,Ps2, Ps3, Ps4, and Ps5,), potentially contaminated via surface runoff or groundwater
infiltration.
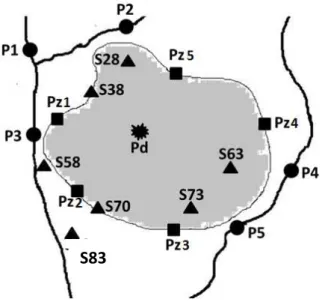
Figure 1. Scheme of the study area within and nearby the landfill with location of the sites were the matrices groundwater (Pz2 to Pz5; for logistic reasons Pz1 was not selected), puddle water (Pd), soil (S28, S38, S63, S70, S73, and S83) and river water and sediment (P1, P2, P3, P4,
Chapter 2 - Materials and Methods
12
and P5) were collected (for confidential reasons this scheme is merely illustrative and no scale is provided).
Although the present study also intended to evaluate possible seasonal differences in the
direct and indirect effects of leachate toxicity, by collecting samples twice, in Autumn-Winter
and Spring-Summer, a factorial design was not possible for logistic reasons and the only
matrice collected in both seasons was the leachate (L1 and L2, respectively). Samples Pd, S28
to S83 and P1 to P5 were only collected in Autumn-Winter, the first season to be sampled,
because obtained results pointed to the absence of toxicity (see Results section). Samples Pz2
to Pz5 were only collected in Spring-Summer for logistic reasons.
To fully distinguish the ecological receptors at most risk, the following extensive battery of
toxicity tests with species representative of various aquatic system compartments, taxonomic
groups and ecosystem functions was selected: 5-minutes luminescence of the marine bacteria
Vibrio fischeri Lehmann and Neumann (decomposer) for both water-phase and solid-phase (sediments, in the case of the present study) matrices, 72-hours growth of the green planktonic microalgae Pseudokirchneriella subcapitata Koršhiko Hi dak pri ary producer ,
72-hours growth of the floating macrophyte Spirodela polyrhiza (L.) Schleid (primary
producer), 48-hours population growth of the rotifer Brachionus calyciflorus Pallas (primary consumer), 48-hours postexposure feeding of the cnidarian Hydra attenuata (Pallas) (secondary consumer), 24-hours feeding of the planktonic cladoceran Daphnia magna Straus (primary consumer), 6-days growth of the epibenthic omnivorous ostracod Heterocypris
incongruens (Ramdohr) (primary consumer), and 48-hours postexposure feeding of the benthic midge deposit feeder Chrinomus riparius Meigen (decomposer). All toxicity tests selected for the present study have largely been used in other ecotoxicity studies. Besides, most of them
have already been standardized and guidelines/standard operational procedures for
13
Given that species sensitivity differences within the same sample and across samples were
expected, preliminary toxicity tests were performed with wide ranges of samples
concentrations to establish the definitive range of dilutions allowing to reach precise estimates
of toxicity parameters (e.g. EC50; median effective concentration) or for samples with low
toxicity the lowest concentration causing a significant organisms response inhibition (see
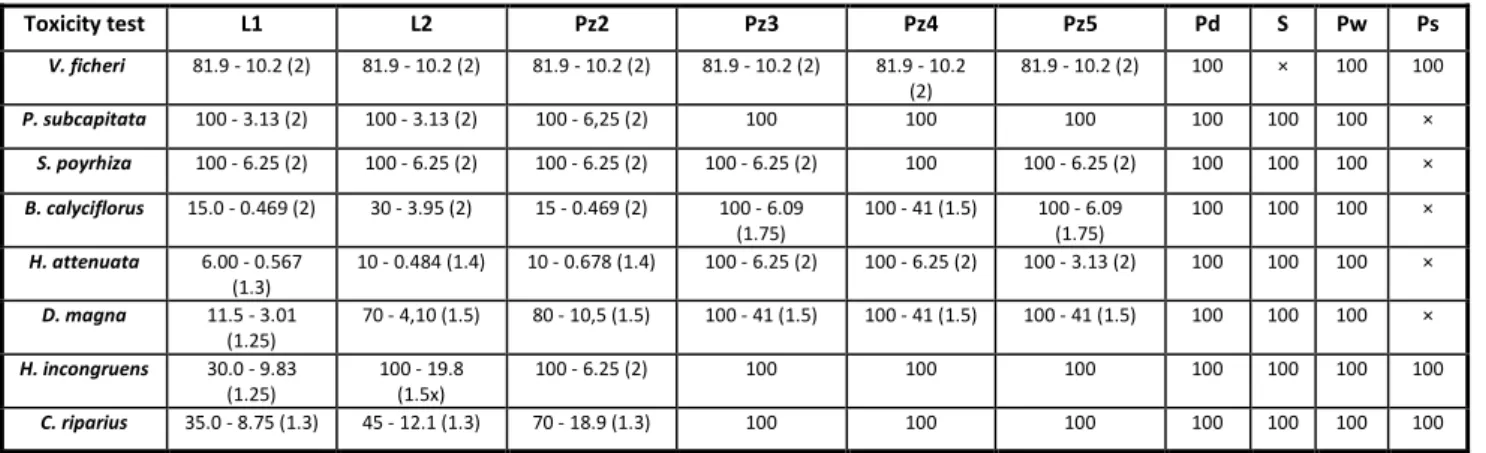
section 2.4). Table 2 outlines the group of toxicity tests performed with each type of collected
matrice with the respective range of tested concentrations.
Table 2. Toxicity tests performed with Vibrio fischeri (5-minutes luminescence),
Pseudokirchneriella subcapitata (72-hours growth), Spirodela polyrhiza (72-hours growth),
Brachionus calyciflorus (48-hours population growth), Hydra attenuata (48-hours postexposure feeding), Daphnia magna (24-hours feeding), Heterocypris incongruens (6-days growth), and
Chrinomus riparius (48-hours postexposure feeding) on the matrices leachate (L1 and L2), groundwater (Pz), water puddle (Pd), soil extracts (S), and river (Pw) and sediment (Ps) water, collected in Autumn-Winter (L1, Pd, S, Pw, and Ps) and Spring-Summer (L2 and Pz) within and nearby the landfill and respective range of tested concentrations (in %) (values within parenthesis are dilution factor).
x - no toxicity test was performed
2.3 COLLECTION AND CHARACTERIZATION OF WATER, SOIL AND SEDIMENT SAMPLES
As stated above, samples were collected twice, once in Autumn-Spring and another in
Spring-Summer. The L1 sample, water from Pd and all water (Pd, Pw1, Pw2, Pw3, Pw4 and Pw5) and
sediment samples (Ps1, Ps2, Ps3, Ps4 and Ps5) from the rivers nearby the landfill and the soil
Toxicity test L1 L2 Pz2 Pz3 Pz4 Pz5 Pd S Pw Ps
V. ficheri 81.9 - 10.2 (2) 81.9 - 10.2 (2) 81.9 - 10.2 (2) 81.9 - 10.2 (2) 81.9 - 10.2 (2)
81.9 - 10.2 (2) 100 × 100 100
P. subcapitata 100 - 3.13 (2) 100 - 3.13 (2) 100 - 6,25 (2) 100 100 100 100 100 100 ×
S. poyrhiza 100 - 6.25 (2) 100 - 6.25 (2) 100 - 6.25 (2) 100 - 6.25 (2) 100 100 - 6.25 (2) 100 100 100 ×
B. calyciflorus 15.0 - 0.469 (2) 30 - 3.95 (2) 15 - 0.469 (2) 100 - 6.09 (1.75)
100 - 41 (1.5) 100 - 6.09 (1.75)
100 100 100 ×
H. attenuata 6.00 - 0.567 (1.3)
10 - 0.484 (1.4) 10 - 0.678 (1.4) 100 - 6.25 (2) 100 - 6.25 (2) 100 - 3.13 (2) 100 100 100 ×
D. magna 11.5 - 3.01 (1.25)
70 - 4,10 (1.5) 80 - 10,5 (1.5) 100 - 41 (1.5) 100 - 41 (1.5) 100 - 41 (1.5) 100 100 100 ×
H. incongruens 30.0 - 9.83 (1.25)
100 - 19.8 (1.5x)
100 - 6.25 (2) 100 100 100 100 100 100 100
Chapter 2 - Materials and Methods
14
samples to prepare soil eluates were collected in Autumn-Winter. In Spring-Summer only the
L2 and all Pz samples were collected. Samples L1 and L2 were collected by landfill operators
and corresponded to a sub-sample of the L that the landfill sends periodically to a wastewater
treatment plant. Samples Pz were also collected by landfill operators. All liquid samples (L1, L2,
Pz, Pw1-Pw5) were collected into acid washed 5-L polyethylene bottles and transported to the
laboratory in thermally insulated boxes. Soil and sediment samples were collected with a
scoop, placed in airtight black plastic bags and transported as the water samples. All water and
sediment samples were stored immediately upon arrival to the laboratory, either at 4 C in
darkness to be used within less than two months or at -20 C in darkness to be used within less
than 12 months.
Soil samples were stored at 4 C in darkness for a maximum period of one month until eluate
preparation. Eluates were prepared following standard methods (DIN, 1984). The soil was
mixed with distilled water (1:10 ratio, w/v, based on the soil dry weight), magnetically stirred
during 12 hours, centrifuged at room temperature (20 minutes at 3370 g) and the supernatant collected as eluate, which was stored as the other liquid matrices.
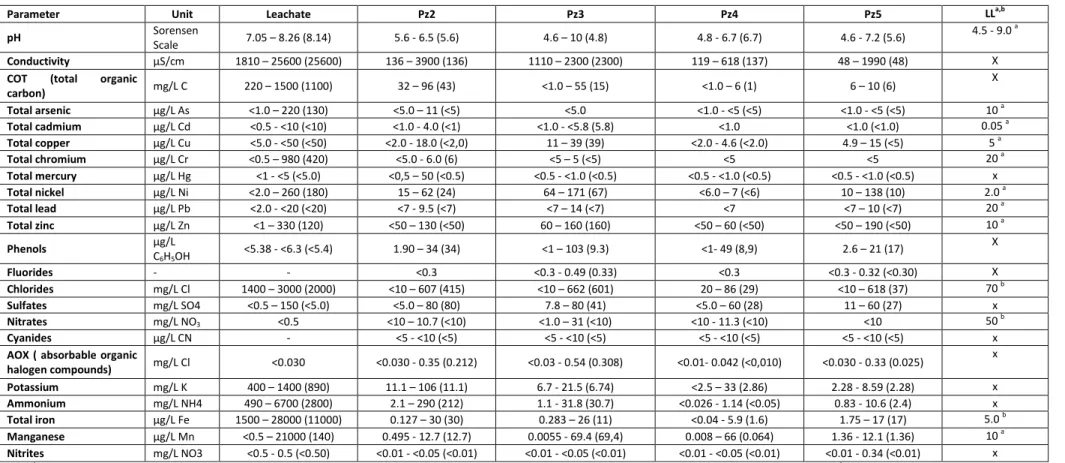
The full physico-chemical characterization of all L and Pz samples according to the monitoring
program implemented by the landfill is not yet available. However, a summary of the latter
relatively to the monitoring of such parameters between 2006 and 2012 is here provided
(Table 3), since it is considered relevant information to interpret the results of the present
study. Additionally measurements of pH (Wissenschaftlich Technische Werkstätten, 537 pH
meter, WTW, Weilheim, Germany), conductivity (WTW Cond315i/SET conductivity meter) and
dissolved oxygen (WTW OXI 92 oxygen meter) were taken in the 100% concentration of all
liquid samples (L1, L2, Pz, Pw1-Pw5, and S20-S83) every time a toxicity test was performed, as
a mean to physico-chemically characterize them while verifying sample stability in time (Table
15
Table 3. Range (minimum - maximum) of physico-chemical parameters measured according to the landfill implemented monitoring program complying with Portuguese legislation (Decreto-Lei n.º 236/1998; Decreto-Lei n.º 152/2002; Decreto-Lei n.º 183/2009) in the period of 2006 to 2012 based on data provided by the landfill (values within parenthesis are last available measurement of 2012) in samples of leachate (L) and from piezometers (Pz2, Pz3, Pz4, and Pz5).
a,b
LL- Legal Limit for irrigation waters in Portugal (Decreto-Lei n.º 236/1998) applied to the groundwater collected from the piezometers (a admissible maximum value; b recommended maximum value).
Parameter Unit Leachate Pz2 Pz3 Pz4 Pz5 LLa,b
pH Sorensen
Scale 7.05 – 8.26 (8.14) 5.6 - 6.5 (5.6) 4.6 – 10 (4.8) 4.8 - 6.7 (6.7) 4.6 - 7.2 (5.6)
4.5 - 9.0 a
Conductivity μS/c 1810 – 25600 (25600) 136 – 3900 (136) 1110 – 2300 (2300) 119 – 618 (137) 48 – 1990 (48) X
COT (total organic
carbon) mg/L C 220 – 1500 (1100) 32 – 96 (43) <1.0 – 55 (15) <1.0 – 6 (1) 6 – 10 (6)
X
Total arsenic μg/L As <1.0 – 220 (130) <5.0 – 11 (<5) <5.0 <1.0 - <5 (<5) <1.0 - <5 (<5) 10 a
Total cadmium μg/L Cd <0.5 - <10 (<10) <1.0 - 4.0 (<1) <1.0 - <5.8 (5.8) <1.0 <1.0 (<1.0) 0.05 a Total copper μg/L Cu <5.0 - <50 (<50) <2.0 - 18.0 (<2,0) 11 – 39 (39) <2.0 - 4.6 (<2.0) 4.9 – 15 (<5) 5 a
Total chromium μg/L Cr <0.5 – 980 (420) <5.0 - 6.0 (6) <5 – 5 (<5) <5 <5 20 a
Total mercury μg/L Hg <1 - <5 (<5.0) <0,5 – 50 (<0.5) <0.5 - <1.0 (<0.5) <0.5 - <1.0 (<0.5) <0.5 - <1.0 (<0.5) x
Total nickel μg/L Ni <2.0 – 260 (180) 15 – 62 (24) 64 – 171 (67) <6.0 – 7 (<6) 10 – 138 (10) 2.0 a
Total lead μg/L P <2.0 - <20 (<20) <7 - 9.5 (<7) <7 – 14 (<7) <7 <7 – 10 (<7) 20 a Total zinc μg/L ) <1 – 330 (120) <50 – 130 (<50) 60 – 160 (160) <50 – 60 (<50) <50 – 190 (<50) 10 a
Phenols µg/L
C6H5OH
<5.38 - <6.3 (<5.4) 1.90 – 34 (34) <1 – 103 (9.3) <1- 49 (8,9) 2.6 – 21 (17) X
Fluorides - - <0.3 <0.3 - 0.49 (0.33) <0.3 <0.3 - 0.32 (<0.30) X
Chlorides mg/L Cl 1400 – 3000 (2000) <10 – 607 (415) <10 – 662 (601) 20 – 86 (29) <10 – 618 (37) 70 b
Sulfates mg/L SO4 <0.5 – 150 (<5.0) <5.0 – 80 (80) 7.8 – 80 (41) <5.0 – 60 (28) 11 – 60 (27) x
Nitrates mg/L NO3 <0.5 <10 – 10.7 (<10) <1.0 – 31 (<10) <10 - 11.3 (<10) <10 50 b Cyanides µg/L CN - <5 - <10 (<5) <5 - <10 (<5) <5 - <10 (<5) <5 - <10 (<5) x
AOX ( absorbable organic
halogen compounds) mg/L Cl <0.030 <0.030 - 0.35 (0.212) <0.03 - 0.54 (0.308) <0.01- 0.042 (<0,010) <0.030 - 0.33 (0.025)
x
Potassium mg/L K 400 – 1400 (890) 11.1 – 106 (11.1) 6.7 - 21.5 (6.74) <2.5 – 33 (2.86) 2.28 - 8.59 (2.28) x
Ammonium mg/L NH4 490 – 6700 (2800) 2.1 – 290 (212) 1.1 - 31.8 (30.7) <0.026 - 1.14 (<0.05) 0.83 - 10.6 (2.4) x
Chapter 2 - Materials and Methods
16
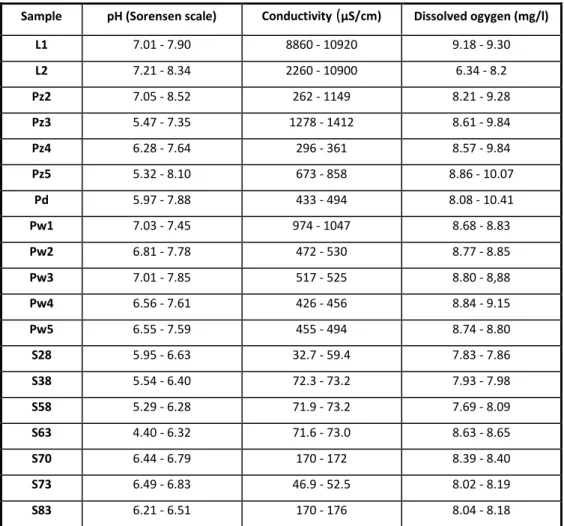
Table 4. Range (minimum - maximum) of pH, conductivity and dissolved oxygen levels measured during the performance of the toxicity tests in the 100% concentrated leachate (L1 and L2), groundwater (Pz), water puddle (Pd), soil extracts (S), and river water (Pw) samples collected within and nearby the landfill.
In what regards the sediments (Ps1-Ps2) they were characterized based on their content in
organic matter and particle size distribution, both estimated in percentage relatively to the
ash-free dry weight of the sediment (after ignition at 500 °C for 24 hours). These data were
provided by external colleagues and are presented in Table 5. All sediments presented high
percentages of particles with a size range equal to or higher than very coarse to coarse sand
(82 to 91%) and low percentages of silt and organic matter ( 2%).
Table 5. Organic matter content and particle size distribution of the five sediment samples (Ps1 to Ps5) collected in the rivers nearby the landfill in Autumn-Winter (all in % relatively to the sediment ash-free dry weight).
Sample pH (Sorensen scale) Conductivity(μS/cm) Dissolved ogygen (mg/l)
L1 7.01 - 7.90 8860 - 10920 9.18 - 9.30
L2 7.21 - 8.34 2260 - 10900 6.34 - 8.2
Pz2 7.05 - 8.52 262 - 1149 8.21 - 9.28
Pz3 5.47 - 7.35 1278 - 1412 8.61 - 9.84
Pz4 6.28 - 7.64 296 - 361 8.57 - 9.84
Pz5 5.32 - 8.10 673 - 858 8.86 - 10.07
Pd 5.97 - 7.88 433 - 494 8.08 - 10.41
Pw1 7.03 - 7.45 974 - 1047 8.68 - 8.83
Pw2 6.81 - 7.78 472 - 530 8.77 - 8.85
Pw3 7.01 - 7.85 517 - 525 8.80 - 8,88
Pw4 6.56 - 7.61 426 - 456 8.84 - 9.15
Pw5 6.55 - 7.59 455 - 494 8.74 - 8.80
S28 5.95 - 6.63 32.7 - 59.4 7.83 - 7.86
S38 5.54 - 6.40 72.3 - 73.2 7.93 - 7.98
S58 5.29 - 6.28 71.9 - 73.2 7.69 - 8.09
S63 4.40 - 6.32 71.6 - 73.0 8.63 - 8.65
S70 6.44 - 6.79 170 - 172 8.39 - 8.40
S73 6.49 - 6.83 46.9 - 52.5 8.02 - 8.19
17
Parameter Ps1 Ps2 Ps3 Ps4 Ps5
Particle size
Fine to very fine gravel (≥ 2 mm) 63.0 45.2 43.6 24.2 51.5
Very coarse to coarse sand (< 2 mm - > 500 µm) 27.8 46.1 43.9 58.7 34.8
Medium sand (< 500 - > 250 µm) 5.14 6.50 8.41 12.1 7.52
Fine to very fine sand (< 250 - > 63 µm) 2.44 1.51 2.22 3.07 3.83
Silt (< 63 µm) 1.62 0.713 1.90 1.97 2.27
Organic matter content 0.934 0.823 0.842 1.79 1.45
2.4 TEST ORGANISMS
The battery of eight laboratory toxicity tests was selected to cover a range of organisms
representative of different taxonomic (bacteria, algae, plants, rotifers, cnidarians, crustaceans,
and insects) and functional groups (primary producers, primary and secondary consumers,
epibenthic and benthic decomposers) and of environmental compartments (water and
sediment). From a practical viewpoint, other criteria used to select the test species were
availability in sufficient numbers, easily manipulated and species for which data exist on the
species sensitivity to a broad range of stressors (environmental/chemical) (Tesfaye, 2013).
Overall, test species originated either from dormant stages (V. fischeri, S. polyrhiza, B.
calyciflorus, and H. incongruens) or standard laboratory cultures (P. subcapitata, H. attenuata,
D. magna, and C. riparius).
All dormant stages were purchased from commercial suppliers and animate forms obtained as
described in the respective protocols. V. fischeri were reconstituted from lyophilized (freeze-dried) bacteria (Azur Environmental, Carlsbad, CA, USA), S. polyrhiza turions were germinated
for 72 hours (http://www.microbiotests.be/toxkits/Spirodelastp.pdf, last viewed October
2014) and cysts of B. calyciflorus and H. incongruens were hatched for 18 and 48 hours, respectively, and animated forms fed with artificial food for an additional period of 2 and 4
Chapter 2 - Materials and Methods
18
October 2014; http://www.microbiotests.be/toxkits/OstracodtoxkitFstpl.pdf, last viewed
October 2014).
Non-axenic stock cultures of the green freshwater microalgae were maintained in 250-ml
sterile glass Erlenmeyer flasks, with Woods Hole MBL growth medium (Stein, 1973)
supplemented ith ita i s 0. g/L B , 0.5 μg/L B 2 a d 0.5 μg/L biotin), at 19–21 °C,
under continuous cool-white fluorescent illumination (8000 lx). To start new cultures and
obtain organisms for the tests, algae were harvested while still in the exponential growth
phase (5–7 d old) (Tesfaye, 2013).
Hydra attenuata was maintained at 19-21 C, under a 14:10-hours light:dark photoperiod (6000 lx), in an artificial medium described in Trottier et al. (1997). The organisms were
cultured in crystallizers with 200 ml of medium. Cultures were fed three times a week with
Artemia franciscana nauplii (24-hours old), times at which the medium was renewed. Hydranths for toxicity tests were organisms without buds not fed for the previous 24 hours.
Organisms for tests with D. magna (Clone A originated from IRCHA in France; OECD, 1998)
were obtained from cultures maintained at 19-21 C, under a 14:10-hours light:dark
photoperiod, in reconstituted hard water (ASTM, 2002) supplemented with vitamins (7.5 µg/L
B1, 1 µg/L B12, and 0.75 µg/L biotin) and Marinure extract (Glenside, Stirling, UK; 7.5 ml/L of a
suspension with an absorbance of 620 units at 400 nm). Cultures were fed daily with P. subcapitata (3 × 10⁵ cells/ml; 25 and 15 daphnids/L up to the first brood and from there onwards, respectively) and the medium was renewed every other day. To perform the toxicity
tests, 4-days old organisms were used.
Cultures of C. riparius consisted of crystallizing dishes containing 180 - 200 g of quartz sea sand (0.1-0.4 mm particle size; Merck, Darmstadt, Germany) and 300 ml of reconstituted hard water
(ASTM, 2002), fed a suspension of ground Tetramin (Tetrawerk, Melle, Germany) three times
19
respectively), and maintained 19-21 C, under a 14-hours:10-hours light dark photoperiod with
90-minutes dawn and dusk periods (7000 lx) (for further details see Rosa et al., 2010). Larvae
used in tests were from 10 days old cultures.
2.5 ECOTOXICITY TESTS
The 5-minutes V. fischeri luminescence test was conducted following the 81.9% basic test
protocol for water samples and solid-phase test protocol for sediment samples (Azur
Environmental, Carlsbad, CA, USA). According to these protocols, maximum tested
concentrations are 81.9% for water and 197400 mg/L for sediment (on a wet weight basis).
The Microtox toxicity analyzer was used to measure the light emission (in Lt) of the bacteria
after an exposure periods of 5 minutes. A single reading was measured for the samples
subjected to a dilution gradient (L1, L2, Pz2-Pz5) whereas for the 100% tested samples two
replicates (Pd, Pw1-Pw5) or two replicates with two sub-replicates each (Ps1-Ps5) were read.
The 72-hours growth test with P. subcapitata was done following standard guidelines (OECD, 1984; EC, 1992). All waters were tested after being supplemented with nutrients in the same
amounts as the control medium to discriminate potential toxic effects from those due to
differences in nutrient levels among the treatments; the exception being the soil eluates. The
test was conducted in 24-wells plates with each replicate well co sisti g of 900 μl test solutio
plus 00 μl of algal i oculu ; three and at least six replicates for each test solution and the
control (also used as dilution medium; same as stock culture medium slightly diluted to adjust
for N/P ratio according to guidelines), respectively, were set up with an initial algal
concentration of 104 cell/ml; each plate had at least a control replicate to verify for variability
in environmental conditions within the tested area. The border line wells of each plate were
filled with distilled water to minimize water evaporation during the test duration. The test was
72-Chapter 2 - Materials and Methods
20
hours exposure period, the final cell densities were counted from well-mixed aliquots of each
replicate under a microscope (×400 magnification) using a Neubauer chamber to estimate the
growth rate as the difference between the final and initial cell density (r; /day).
The 72-hours growth of S. plyrhiza was based on the Spirodela duckweed microbiotest (http://www.microbiotests.be/toxkits/Spirodelastp.pdf, last viewed October 2014), which is
conducted in 48-wells test plates containing 1 ml of test solution per well (i.e., per replicate).
The standard control and dilution medium consisted of Steinberg medium (ISO, 2005). At least
eight controls were set up per test, with a minimum or four per test plate. For each tested
solution four replicates were set up. All tests were incubated at 24-26 C and at least 6000 lx.
The area measurements of the initial and final fronds were made by Image Analysis of the
photos of the test plates at the start and end of the test. The estimated test endpoint was the
increase in frond area after 72 hours of exposure (mm2/72 h).
The 48-hours population growth test with B. calyciflorus was performed following the Rotoxkit
F Chronic test (http://www.microbiotests.be/toxkits/RotoxkitFshort-chronicstp.pdf). This test
was also conducted in 48-wells plates and eight replicates (one organism per well per ml) of
each tested solution and control were set up; control and dilution medium was reconstituted
moderately hard water (ASTM, 2002). The test was incubated at 24-26 C and food was
provided (P. subcapitat; 2x10⁶ cells/ml). After the 48-hours exposure the number of live rotifers was counted in each well to estimate specific growth rates based on the number of
initial and final organisms per replicate (r; /day).
The 48-hours H. attenuata postexposure feeding is a test done with 12 replicates per tested solution and control, each consisting of 2-ml solution and one organism; the medium used in
the standard control and for test dilutions was reconstituted moderately hard water (ASTM,
2002). The postexposure feeding was done by providing 10 A. franciscananauplii per well after
21
darkness, nauplii not consumed were counted to estimate feeding rates (nauplii/hydranth/30 min).
The 24-hours D. magna feeding test was based on the methodology developed by McWilliam
& Baird (2002). The standard control and dilution medium was the same used for the stock
cultures, except that no vitamin supplement was provided. For each tested water and control
five replicates were set up, each consisting of 175-ml glass vessels filled with 120 ml of test
solution plus food (3.5 × 10⁵ cells/ml of P. subcapitata) and five organisms. A blank treatment, consisting of control medium with food but without organisms, was also run to control for
algal growth during the test period. The test was incubated at 19-21 C in darkness. After a
24-hours exposure period, the test endpoint was estimated as feeding rate (cells/daphnid/24
hours), calculated from initial and final cell densities; algal counting was performed as
described for the 72-hours P. subcapitata growth test.
The 6-days H. incongruens growth test was conducted according to the Ostracodtoxkit F
standard operating procedure (http://www.microbiotests.be/toxkits/OstracodtoxkitFstpl.pdf,
last viewed October 2014). The standard control consisted of reference sediment included in
the kit plus the same medium used for hatching the cysts, which was also used for samples
dilution. The same reference sediment was also used to test all liquid samples whereas in the
test with the river sediment samples the respective sediment was used and overlying water
was control medium. The tests were conducted in 6-wells plates with each replicate well
consisting of 1 ml of sediment plus 4 ml of solution already inoculated with food (3.75 × 10⁶
cells/ml of Scenedesmus sp.) and 10 organisms; six replicates were established for the control and three for the tested samples. After the 6-days exposure period, survival and final length (in
μ ere recorded. The specific growth rate was estimated from initial and final lengths (r;
Chapter 2 - Materials and Methods
22
The C. riparius 48-hours postexposure feeding test was conducted according to procedures described in Soares et al. (2005). The same medium as the stock cultures was used for diluting samples and the control. Only the four replicates of the control had sediment (the same used
to maintain the culture in the laboratory), whereas the three replicates of each remaining
treatment consisted of water only exposures; in the test with the river sediment samples the
respective sediment was used and overlying water was control medium. Each replicate
consisted of 175-ml glass vials filled with 50 g of sediment, only in the case of the treatments
specified above, plus 120 ml of water under continuous aeration. Five larvae were added per
replicate. At the end of the 48-hours exposure, larvae were retrieved from the test vials,
immediately individually transferred to a 30 ml glass vial filled with 5 ml of control medium
and 100 defrosted nauplii (< than 24-hours old) of A. franciscana. Then they were allowed to feed at 19-21 °C in darkness for 1 hour, time after which each larva was retrieved and the
remaining nauplii were counted. Feeding rates were calculated as the difference between the
initial and the final number of nauplii (nauplii/larvae/h).
2.6 DATA ANALYSIS
For all except the V. fischeri tests, effective concentrations inducing 20 and 50% inhibition in
organism responses (EC20 and EC50) and respective 95% CL were obtained by fitting organism
responses to a logistic model using the least squares method (OECD, 1998). For the V. fischeri
tests, median effective concentrations (EC50) and respective 95% CL were calculated using
Microtox Omni Software 1.18 (Azur Environmental), whereas EC20 values with respective 95%
CL were calculated using the software PriProbit 1.63
(http://ars.usda.gov/Services/docs.htm?docid=11284), applying the probit transformation to
23
When EC20 or EC50 values could not be estimated due to the low percentage inhibition at the
100% concentration and for the tests consisting simply of the standard control and 100%
sample one-way analysis of variance (ANOVA) or nested ANOVA was used, to test for the
existence of significant differences between the organism responses in the standard controls
and tested sample. Prior to all analysis of variance, the assumptions of normality (Shapiro–
24
Chapter 3
Results
All laboratory tests fulfilled the validity criteria for control performance (survival and sublethal
endpoint) required in the respective guidelines/standard operational procedures or
established for the present study based on known baseline values for each species. Table 6
presents the summary of the pH, conductivity and dissolved oxygen levels measured in the
standard control of all toxicity tests performed with P. subcapitata, H. attenuata, D. magna,
and C. riparius. For the V. fisheri, S. polyrhiza, B. calyciflorus, and H. incongruens tests no
physico-chemical measurements were performed because test volumes were too small.
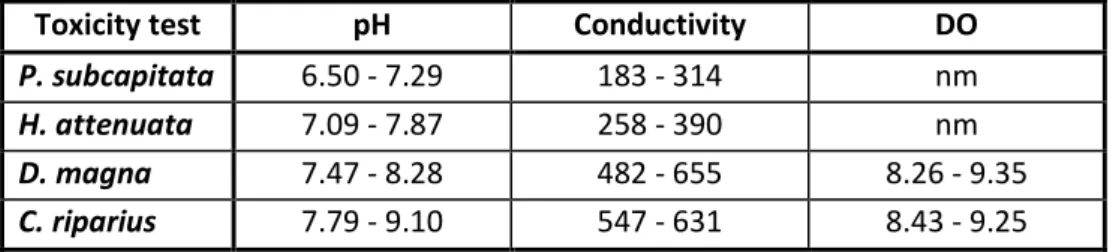
Table 6. Range (minimum – maximum) of pH, conductivity (μS/cm) and dissolved oxygen (DO in mg/l) levels measured in the standard control during the toxicity tests with
Pseudokirchneriella subcapitata (72-hours growth), Hydra attenuata (48-hours postexposure feeding), Daphnia magna (24-hours feeding), and Chrinomus riparius (48-hours postexposure feeding) on the matrices leachate, groundwater, water puddle, soil extracts, and river water and sediment.
Toxicity test pH Conductivity DO
P. subcapitata 6.50 - 7.29 183 - 314 nm
H. attenuata 7.09 - 7.87 258 - 390 nm
D. magna 7.47 - 8.28 482 - 655 8.26 - 9.35
C. riparius 7.79 - 9.10 547 - 631 8.43 - 9.25 nm: not measured
3.1 ECOTOXICOLOGICAL CHARACTERIZATION OF MATRICES WITHIN THE LANDFILL
MONITORING PROGRAM
The results described herein are those regarding the matrices included in the monitoring
program under the landfill management, i.e., leachates (L1 and L2) and groundwater (Pz2 to
Pz5). From all toxicity tests performed, mortality above the validity criterium of either 10 or
20%, the latter only for the ostracod toxicity test, was occasionally registered (Table 7).
25
H. attenuata for groundwater samples. Despite the observed mortality it was possible to estimate EC50 and EC20 values for all matrices, as sufficient alive organisms remained in at
least five test concentrations.
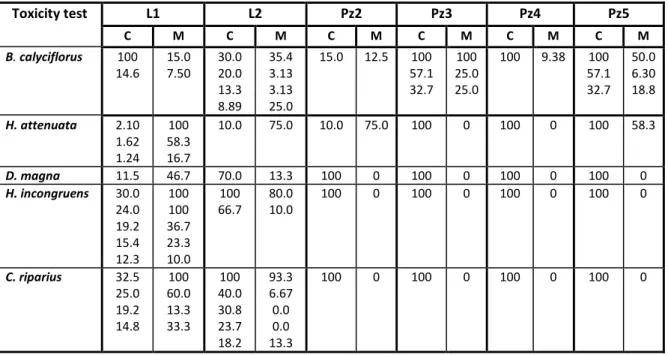
Table 7. Mortality (M, in %) for the test concentrations (C, in %) for which the validity criterium of 10 or 20% (only for the ostracod toxicity test) was not fulfilled during the toxicity tests with
Brachionus calyciflorus (48-hours population growth), Hydra attenuata (48-hours postexposure feeding), Daphnia magna (24-hours feeding), Heterocypris incongruens (6-days growth), and
Chrinomus riparius (48-hours postexposure feeding), to evaluate the toxicity of the matrices leachate (L1 and L2) and groundwater (Pz2 to Pz5). Range of concentrations is contiguous from highest to lowest even if at the highest or at intermediate concentrations mortality is within the validity criterium.
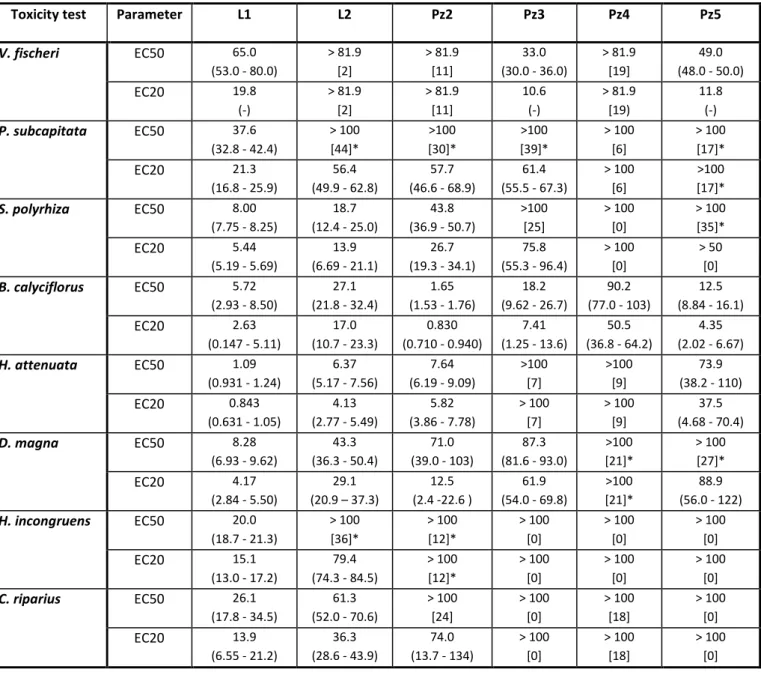
Results of the EC50 and EC20 values estimated for all test organisms for the matrices leachate
and groundwater are presented in Table 8. Values of EC50 for L1 could be estimated for all test
organisms, ranging from 1 (H. attenuata) to 65% (V. fischeri), whereas EC50 values for L2
ranged from 6 (H. attenuata) to 61% (C. riparius), but estimates higher than the 100% concentration were obtained for V. fischeri, P. subcapitata and H. incongruens; with the 100% concentration causing a significant inhibition of 2, 44 ans 33% in the bacteria luminescence,
microalgae growth and ostracod growth, respectively. The ratio between EC50 values for L2
and EC50 values for L1 ranged from a factor of 2 (bacteria, macrophyte and insect larvae) to 6
Toxicity test L1 L2 Pz2 Pz3 Pz4 Pz5
C M C M C M C M C M C M
B. calyciflorus 100
14.6 15.0 7.50 30.0 20.0 13.3 8.89 35.4 3.13 3.13 25.0
15.0 12.5 100 57.1 32.7
100 25.0 25.0
100 9.38 100 57.1 32.7
50.0 6.30 18.8
H. attenuata 2.10
1.62 1.24
100 58.3 16.7
10.0 75.0 10.0 75.0 100 0 100 0 100 58.3
D. magna 11.5 46.7 70.0 13.3 100 0 100 0 100 0 100 0
H. incongruens 30.0
24.0 19.2 15.4 12.3 100 100 36.7 23.3 10.0 100 66.7 80.0 10.0
100 0 100 0 100 0 100 0
C. riparius 32.5
25.0 19.2 14.8 100 60.0 13.3 33.3 100 40.0 30.8 23.7 18.2 93.3 6.67 0.0 0.0 13.3
Chapter 3 - Results
26
(cnidarian), whereas the correspondent ratio for EC20 values ranged from a factor of 3
(microalgae, macrophyte and insect larvae) to 6 (cnidarian)/7 (cladoceran).
Table 8. Effective leachate (L1 and L2) and groundwater (Pz2, Pz3, Pz4, and Pz5) concentrations inducing 50 (EC50) and 20% (EC20) inhibition in organism responses, for the toxicity tests performed with Vibrio fischeri (5-minutes luminescence), Pseudokirchneriella subcapitata (72-hours growth), Spirodela polyrhiza (72-hours growth), Brachionus calyciflorus (48-hours population growth), Hydra attenuata (48-hours postexposure feeding),
Daphnia magna (24-hours feeding), Heterocypris incongruens (6-days growth), and Chrinomus riparius (48-hours postexposure feeding). Values within curve brackets are 95% confidence limits and those within square brackets are organisms response inhibition caused by the 100% concentration of the sample relatively to the control with * indicating a significant inhibition.
Toxicity test Parameter L1 L2 Pz2 Pz3 Pz4 Pz5
V. fischeri EC50 65.0
(53.0 - 80.0)
> 81.9 [2]
> 81.9 [11]
33.0 (30.0 - 36.0)
> 81.9 [19]
49.0 (48.0 - 50.0)
EC20 19.8
(-) > 81.9 [2] > 81.9 [11] 10.6 (-) > 81.9 [19) 11.8 (-)
P. subcapitata EC50 37.6 (32.8 - 42.4)
> 100 [44]* >100 [30]* >100 [39]* > 100 [6] > 100 [17]*
EC20 21.3
(16.8 - 25.9)
56.4 (49.9 - 62.8)
57.7 (46.6 - 68.9)
61.4 (55.5 - 67.3)
> 100 [6]
>100 [17]*
S. polyrhiza EC50 8.00
(7.75 - 8.25)
18.7 (12.4 - 25.0)
43.8 (36.9 - 50.7)
>100 [25] > 100 [0] > 100 [35]*
EC20 5.44
(5.19 - 5.69)
13.9 (6.69 - 21.1)
26.7 (19.3 - 34.1)
75.8 (55.3 - 96.4)
> 100 [0]
> 50 [0]
B. calyciflorus EC50 5.72 (2.93 - 8.50)
27.1 (21.8 - 32.4)
1.65 (1.53 - 1.76)
18.2 (9.62 - 26.7)
90.2 (77.0 - 103)
12.5 (8.84 - 16.1)
EC20 2.63
(0.147 - 5.11)
17.0 (10.7 - 23.3)
0.830 (0.710 - 0.940)
7.41 (1.25 - 13.6)
50.5 (36.8 - 64.2)
4.35 (2.02 - 6.67)
H. attenuata EC50 1.09
(0.931 - 1.24)
6.37 (5.17 - 7.56)
7.64 (6.19 - 9.09)
>100 [7]
>100 [9]
73.9 (38.2 - 110)
EC20 0.843
(0.631 - 1.05)
4.13 (2.77 - 5.49)
5.82 (3.86 - 7.78)
> 100 [7]
> 100 [9]
37.5 (4.68 - 70.4)
D. magna EC50 8.28
(6.93 - 9.62)
43.3 (36.3 - 50.4)
71.0 (39.0 - 103)
87.3 (81.6 - 93.0)
>100 [21]*
> 100 [27]*
EC20 4.17
(2.84 - 5.50)
29.1 (20.9 – 37.3)
12.5 (2.4 -22.6 )
61.9 (54.0 - 69.8)
>100 [21]*
88.9 (56.0 - 122)
H. incongruens EC50 20.0 (18.7 - 21.3)
> 100 [36]* > 100 [12]* > 100 [0] > 100 [0] > 100 [0]
EC20 15.1
(13.0 - 17.2)
79.4 (74.3 - 84.5)
> 100 [12]* > 100 [0] > 100 [0] > 100 [0]
C. riparius EC50 26.1
(17.8 - 34.5)
61.3 (52.0 - 70.6)
> 100 [24] > 100 [0] > 100 [18] > 100 [0]
EC20 13.9
(6.55 - 21.2)
36.3 (28.6 - 43.9)
74.0 (13.7 - 134)
27
Regarding groundwaters, the species for which an EC50 value could be estimated varied with
the groundwater: B. calyciflorus, H. attenuata, S. polyrhiza, and D. magna for Pz2 (EC50 values of 2, 8, 44, and 71%, respectively), B. calyciflorus, V. fischeri and D. magna for Pz3 (EC50 values
of 18, 33 and 87%, respectively), and B. calyciflorus, V. fischeri and H. attenuata for Pz5 (EC50 values of 13, 49 and 74%, respectively). As for Pz4, an EC50 estimate was only possible for B.
calyciflorus, with a value as high as 90%; a significant organism response inhibition at the 100% concentration was only observed for D. magna (by 21%). Pz2 was the groundwater with lowest
EC50 values, close to those obtained with L2, except for the rotifer with EC50 values of 2 and
27%, respectively.
Table 9 summarizes the results of all toxicity estimates by ranking the EC50 and EC20 values in
accordance with five classes of toxicity commonly used in ecotoxicology. It can be observed
that based on EC50 estimates only for the species B. calyciflorus, H. attenuata, S. polyrhiza,
and D. magna matrices were ranked as very toxic; L1 for all four species, L2 for H. attenuata
and Pz2 for B. calyciflorus and H. attenuata. Moreover, L1 was never ranked as toxic or not toxic, whereas L2 and Pz2 were ranked as toxic or not toxic with the bacteria, microalgae,
ostracod toxicity tests, and Pz2 also with the insect larvae test. All remaining groundwaters
(Pz3, Pz4 and Pz5) were generally in the categories toxic or not toxic, with a few exceptions
appearing in the moderately toxic category; Pz3 and Pz5 with the bacteria and rotifer, Pz3 also
with the cladoceran and Pz5 also with the cnidarian, and finally Pz4 with the rotifer. The
species identifying samples as very toxic were only S. polyrhiza, B. calyciflorus, H. attenuata,
and D. magna. However, when EC20 estimates are considered only the rotifer and cnidarian identified samples as extremelly toxic (L1 and Pz2). Overall, results of EC20 values followed a
pattern similar to that described for values of EC50.
(48-Chapter 3 - Results
28
hours postexposure feeding), Daphnia magna (24-hours feeding), Heterocypris incongruens (6-days growth), and Chrinomus riparius (48-hours postexposure feeding), estimated by ranking the EC50 and EC20 values in accordance with classes of toxicity commonly used in ecotoxicology: extremely toxic (ET), very toxic (VT), moderately toxic (MT), toxic (T; 100%, when organism response inhibition at the 100% concentration is significant), and not toxic (NT; > 100%, when organism response inhibition at the 100% concentration is not significant). The matrices are ordered from lowest to highest EC50 or EC20 values.
3.2 ECOTOXICOLOGICAL CHARACTERIZATION OF MATRICES WITHIN AND OUTSIDE THE
LANDFILL AREA
This section describes the results of the toxicity tests performed with the matrices not included
in the landfill monitoring program, but potentially contaminated by the landfill leachate: water
puddle, soil eluates, river waters and sediments. The sample collected from a puddle (Pd)
within the landfill area did not significantly influence the responses of either V. fischeri, P. subcapitata, S. polyrhiza, or H. attenuata (one-way ANOVA: F1,2-22 < 1.10, P >0.31), but had a
significant effect on the responses of B. calyciflorus, D. magna, H. Incongruens, and C. riparius
Toxicity test ET (< 1%)
VT (1 – 9%)
MT (10 – 99%)
T (100%)
NT (> 100%)
EC50
V. fischeri Pz3 < Pz5 < L1 Pz4 < Pz2 < L2
P. subcapitata L1 L2 < Pz3 < Pz2 <Pz5 Pz4
S. polyrhiza L1 L2 < Pz2 Pz5 Pz3 < Pz4
B. calyciflorus Pz2 < L1 Pz5 < Pz3 < L2 < Pz4
H. attenuata L1 < L2 < Pz2 Pz5 Pz4 < Pz3
D. magna L1 L2 < Pz2 < Pz3 Pz5 < Pz4
H. incongruens L1 L2 < Pz2 Pz4 < Pz3 < Pz5
C. riparius L1 < L2 Pz2 < Pz4 < Pz3/Pz5
EC20
V. fischeri Pz3 < Pz5 < L1 Pz4 < Pz2 < L2
P. subcapitata L1 < L2 < Pz2 < Pz3 Pz5 Pz4
S. polyrhiza L1 L2 < Pz2 < Pz3 < Pz5 Pz4
B. calyciflorus Pz2 L1 < Pz5 < Pz3 L2 < Pz4
H. attenuata L1 L2 < Pz2 Pz5 Pz4<Pz3
D. magna L1 Pz2 < L2 < Pz3 < Pz5 Pz4
H. incongruens L1 < L2 Pz2 Pz3/Pz4/Pz5
29
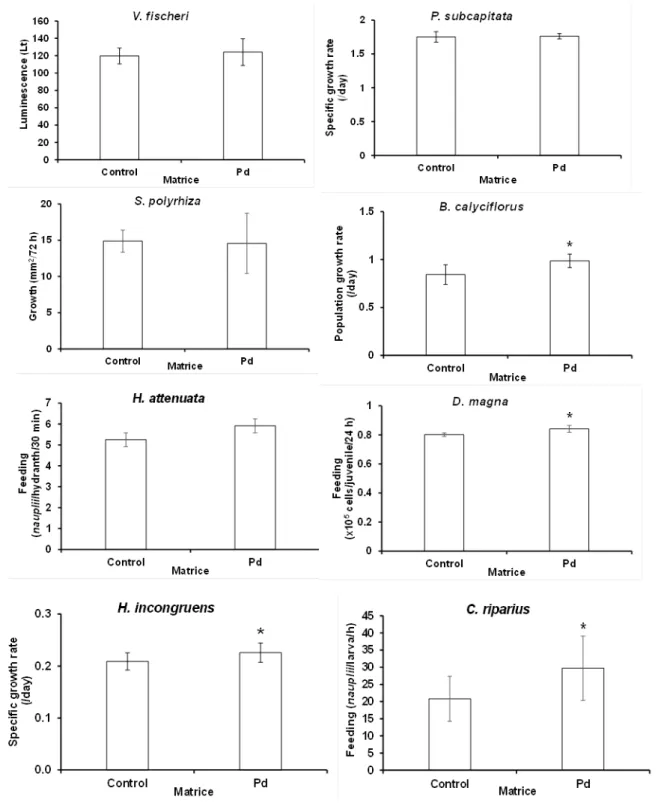
(one-way [nested] ANOVA) (Fig. 2). Yet, in all the latter organisms the Pd water significantly
increased the measured responses relatively to the control, by 17, 5, 8, and 30%, respectively.
Fig. 2. Sublethal effects of the matrice puddle (Pd) on Vibrio fischeri (5-minutes luminescence),
Pseudokirchneriella subcapitata (72-hours growth), Spirodela polyrhiza (72-hours growth),
Chapter 3 - Results
30
feeding), Daphnia magna (24-hours feeding), Heterocypris incongruens (6-days growth), and
Chironomus riparius. Error bars indicate ± 1 standard deviation; * indicates means significantly different from respective control (by one-way [nested] ANOVA).
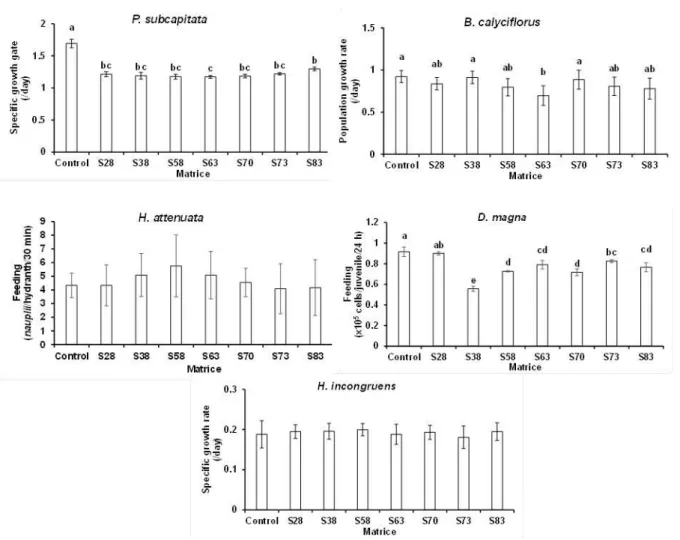
Regarding the soil eluates (Fig. 3), significant differences among the different matrices were
observed with P. subcapitata, B. calyciflorus and D. magna (one-way ANOVA: F7,17-56 > 4.60, P <
0.001). In detail, significant differences across eluates were only found between S83 and S63 in
the microalgae test, though of merely 10%, between S38/S70 and S63 by around 20% in the
rotifer test, and between S28 and all other eluates except S73 in the cladoceran test, by 12
(S28 versus S63) to 38% (S28 versus S38). On the other hand, no significant differences were
detected among eluates in the H. attenuata and H incongruens tests (one-way [nested]
ANOVA: F7,87-243 < 4.56, P > 0.20); whereas with hydrants the percentage of feeding rate
differences between eluates ranged from 12 (S58 versus S38/S63) to 29% (S58 versus S73),
with ostracods percentages of growth rate differences attained a maximum of 10% (S58 versus
31
Fig. 3. Sublethal effects of the matrices soil eluates (S28, S38, S58, S63, S70, S73, and S83) on
Pseudokirchneriella subcapitata (72-hours growth), Brachionus calyciflorus (48-hours population growth), Hydra attenuata (48-hours postexposure feeding), Daphnia magna (24-hours feeding), and Heterocypris incongruens (6-days growth). Error bars indicate ± 1 standard deviation; common letters above error bars indicate means not significantly different from each other within each toxicity test (by Tukey HDS test).
The toxicity tests performed to the river waters showed significant effects on the responses of
P. subcapitata, B. calyciflorus, H. attenuata, D. magna, and H. incongruens (one-way [nested] ANOVA: F5,13-183 > 3.17, P < 0.038). Tukey HSD tests revealed significant differences between
Pw4 and Pw3 (by 12%) in microalgae growth, between Pw5 and Pw1/Pw2 (by 20%) in the
rotifers population growth, between Pw2 and Pw4 (25%) and Pw2 and Pw1 (32%) in the
feeding of hydranths, and between Pw3/Pw4 and P1 (by 14%) in cladoceran feeding; in the
ostracod test maximum percentage growth difference between waters was 6%. No significant