Acute Effects of Smoking on Autonomic Modulation: Analysis by
Poincaré Plot
Beatriz Martins Manzano, Luiz Carlos Marques Vanderlei, Ercy Mara Ramos, Dionei Ramos
Faculdade de Ciências e Tecnologia - FCT - UNESP - Presidente Prudente, São Paulo, SP - BrazilMailing address: Beatriz Martins Manzano •
Rua José Bonifácio Mori, 239 - Centro - 19200-000 - Pirapozinho, SP - Brazil E-mail: [email protected], [email protected] Manuscript received January 11, 2010; revised manuscript received May 23, 2010; accepted August 6th, 2010.
Abstract
Background: Smoking affects the autonomic function.
Objective: To investigate the acute effects of smoking on the autonomic modulation and the post-smoking recovery of the heart rate variability (HRV) index through Poincaré plot and linear indices.
Methods: A total of 25 young smokers underwent beat-to-beat analysis of heart rate in the sitting position after 8 hours of tobacco abstinence, for 30 minutes at rest, 20 minutes while smoking and 30 minutes after smoking. The analysis of variance for repeated measures, followed by Tukey’s test or Friedman’s test followed by Dunn’s test, were applied depending on the normality of data, with p < 0.05.
Results: While smoking, there was a decrease in the indices: SD1 (23.4 ± 9.2 vs 13.8 ± 4.8), SD1/SD2 ratio (0.31 ± 0.08 vs 0.2 ± 0.04), RMSSD (32,7 ± 13 vs 19.1 ± 6.8), SDNN (47.6 ± 14.8 vs 35.5 ± 8.4), HFnu (32,5 ± 11.6 vs 19 ± 8.1) and the RR interval (816.8 ± 89 vs 696.5 ± 76.3) in relation to the rest period, whereas increases in the LFnu index (67.5 ± 11.6 vs 81 ± 8.1) and the LF/HF ratio (2.6 ± 1.7 vs 5.4 ± 3.1) were observed. The visual analysis of the plot showed a lower dispersion of RR intervals while smoking. Except for the SD1/SD2 ratio, the other indices presented recovery of values 30 minutes after smoking.
Conclusion: Smoking resulted in acute modifications of the autonomic control, characterized by sympathetic activation and vagal withdrawal, presenting recovery 30 minutes after smoking. (Arq Bras Cardiol 2011; 96(2): 154-160)
Keywords: Smoking; autonomic nervous system/drug effects; heart failure; nonlinear dynamics.
the act of smoking, are scarce and the studies that do analyze the issue11,12, do so through the use of linear indices.
To evaluate the HRV, linear methods, analyzed in both the time domain (TD) and the frequency domain (FD), as well as non-linear ones, can be used2,13. The linear analysis is broadly
used to study the autonomic control in several conditions, including smoking; however, recently the non-linear methods have been considered with great interest, as they describe the complex fluctuations of rhythm and can better discriminate, in the temporal series of heartbeats, non-linear behavior structures, when compared to the linear methods14. That has
provided a new insight on the abnormalities of HR behavior in several conditions, supplying additional prognostic information when compared with the traditional methods15,16.
One of the methods considered by some authors as based on non-linear dynamics is the Poincaré plot17,18, a
quantitative-visual technique, in which each RR interval is correlated with the preceding interval and defines a point in the plot19, being
considered one of the most important techniques used to visually represent HRV and one of great importance for its capacity to disclose non-linear aspects in a sequence of data20.
Thus, with the objective of adding more information on the aforementioned subject to the literature, the present study aimed at evaluating the acute effects of smoking on the cardiac autonomic control and the recovery of HRV indices
Introduction
The chronic effects of smoking on the heart rate variability (HRV), a noninvasive measurement of the autonomic impulses that indicate the capacity of the heart to respond to multiple physiological and environmental stimuli, as well as compensate disorders induced by diseases1-3, are well-established in the
literature, which indicates its decrease in smokers4,5. Such
condition is associated with the increase in the risk of mortality and potentially fatal arrhythmia susceptibility6-8 and, therefore,
studying the conditions that favor the decrease in HRV is of utmost importance.
Acutely, it is known that cigarette smoking results in the increase in blood pressure (BP), heart rate (HR), vascular resistance, sympathetic discharge and in the decrease in baroreflex activity6,9,10, which can alter the HRV index.
after smoking, using a Poincaré plot, together with the HRV indices at the TD and FD.
Methods
The present study analyzed the data of 25 young volunteers (16 men and 9 women), selected among the participants of the Smoking Cessation Program of Faculdade de Ciências e Tecnologia - FCT/UNESP. The volunteers’ mean age was 22.9 ± 3.2 years, with a mean BMI of 23.7 ± 4.1 kg/m2; they smoked
10 cigarettes/day (median) and had been smoking for 5.7 ± 4 years. Fargerström’s test score showed a predominance (52.0%) of zero to two points, which corresponds to a very low degree of dependence and expired carbon monoxide (CO) levels of 4.9 ± 2.4 ppm. Individuals that presented at least one of the following characteristics were excluded from the study: use of medications that could alter the cardiac autonomic activity, such as propranolol and atropine, alcohol consumers and individuals that presented known infections, metabolic or cardiorespiratory system diseases, which could interfere with the cardiac autonomic control.
The volunteers were adequately informed on the procedures and objectives of the study and signed the Free and Informed Consent Form after agreeing to participate in the study. All procedures used in the study were approved by the Ethics Committee in Research of Faculdade de Ciências e Tecnologia - FCT/UNESP (protocol #258/08) and followed the norms established by Resolution 196/96 of the National Council of Health.
Procedures
The experimental protocol was carried out in a room of which temperature varied from 22° and 24° Celsius, with humidity levels between 40-60.0%, at the same period of the day (between 8AM and 12PM), to attenuate possible influences on the circadian rhythm. Previously, all participants had been advised to abstain from caffeine, physical activity and cigarette smoking for at least 8 hours before the study. Smoking abstinence was confirmed through the measurement of CO concentrations using a Micro CO monoximeter device (Micro Medical Limited, Rochester,
England). Individuals presenting values ≤ 10 ppm21 were
accepted as being abstinent.
The collection of anthropometric data (weight and height), history of smoking, health history and medication use, in addition to the degree of dependence and cigarette consumption, through Fagerström questionnaire, also preceded the experimental protocol.
After such procedure, the chest strap with heartbeat sensor was placed on the volunteers’ thorax, on the distal third of the sternum and a Polar S810i (Polar Electro, Finland), heart rate receptor device was placed around the wrist. The equipment had been previously validated for beat-to-beat HR monitoring and the resulting data were used to calculate the HRV indices22,23. The volunteers remained in the sitting
position and were advised to rest, without high range-of-motion movements and without talking during the collection of data, which was carried out individually.
The collection of data lasted 80 minutes, continuously and consisted of three moments: 1) Rest - the volunteers remained at rest with spontaneous breathing for 30 minutes; 2) Smoking period - the volunteers were asked to smoke two cigarettes of the brand routinely smoked by them, in approximately 20 minutes; and 3) Post-smoking period - after they had finished smoking, the volunteers once again remained at rest, with spontaneous breathing, for 30 minutes.
For the analysis of the HRV, the pattern of its behavior was recorded beat-to-beat, throughout the protocol, with a sampling rate of 1,000 Hz. The analysis of the data was carried out using the first 1,000 consecutive RR intervals, after digital filtration using the Polar Precision Performance SW software (release 4.01.029) complemented by manual filtration, to eliminate premature ectopic beats and artifacts and only series with more than 95% of sinus beats were included in the study24.
The rest period was evaluated using the first 10 minutes to stabilize the hemodynamic parameters and the HR recorded during this period was disregarded for the analysis. The post-smoking period was divided in two periods of 15 minutes each and called Post 1 and Post 2.
Analysis of Poincaré plot
The Poincaré plot, used for the non-linear analysis, is a chart in which each RR interval is recorded as a function of the previous RR interval, that is, the duration of one RR interval (RRn) is represented in the “x” axis and the duration of the following interval (RRn+1) in the “y” axis, so that each point
(RRn, RRn+1) in the chart corresponds to two successive beats25.
The following indices were calculated for the quantitative analysis of the plot, through the adjustment of the ellipse of the figure formed by the attractor: SD1 (standard deviation of the instantaneous variability of the beat-to-beat heart rate), SD2 (standard deviation of long-term continuous RR interval variability) and the SD1/SD2 ratio1,15.
The qualitative analysis of the plotwas carried out through the analysis of the figures formed by its attractor, which were described by Tulppo et al26. The following patterns
were considered: figures with increased dispersion of RR intervals were considered characteristic of a normal plot and figures with little global dispersion, beat-to-beat and without increased dispersion of RR intervals in the long term.
Linear analysis of HRV
The HRV was also analyzed through linear methods, in the TD and FD. In the TD, the RMSSD index, which corresponds to the root mean square of the difference between successive normal adjacent R-R intervals, expressed in milliseconds (ms)27 and the SDNN index, which corresponds to the
standard deviation of all normal sinus R-R intervals, expressed in ms16, were used.
For the analysis of the HRV in the FD, the spectral components of low frequency (LF, 0.04-0.15 Hz) and high frequency (HF, 0.15-0.40 Hz) were used in normalized units and in ms2, as well as the ratio between these components
component in relation to the total potency, minus the components of very-low frequency (VLF). The spectral analysis was calculated using the fast Fourier transform (FFT) algorithm2.
Data on the duration of the RR intervals were also analyzed and the HRV indices were calculated using the HRV analysis software28.
Data analysis
Descriptive statistics was used to characterize the sample profile, with the following data being represented: mean values, standard deviations, medians and 95% confidence intervals. The normality of data was determined using the Shapiro-Wilks test.
The analysis of the rest, smoking and post-smoking periods, when the data presented normal distribution, was carried out through analysis of variance (ANOVA) for repeated measures, followed by Tukey’s test (SDNN variable). For data that did not present a normal distribution, Friedman’s test for repeated measures was used, followed by Dunn’s test (variables: RR interval, RMSSD, LFnu, HFnu, LFms2, HFms2, LF/HF, SD1,
SD2, SD1/SD2). The differences in these tests were considered statistically significant when p value was < 0.05.
The calculation of the study power (GraphPad StatMate Software, release 2.00 for Windows, GraphPad Software, San Diego, California, USA), with the number of volunteers analyzed and a level of significance of 5% (two-tailed test) guaranteed a test power > 80% to detect differences between the variables.
Results
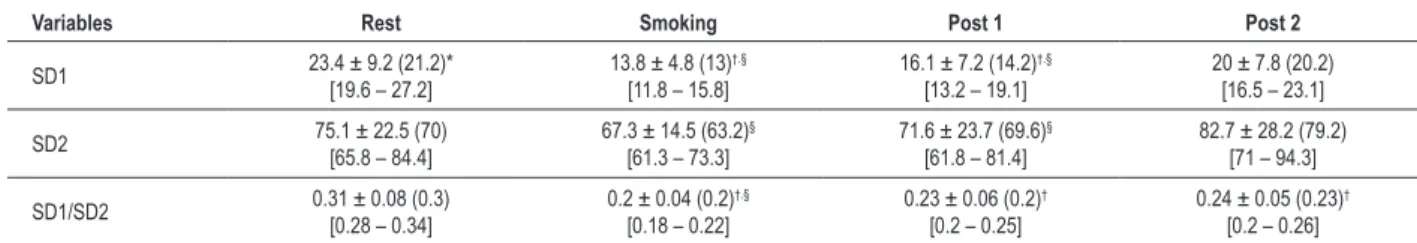
The values of the indices obtained through Poincaré plot for the volunteers before, during and after smoking are shown in Table 1. Significantly lower SD1 values were observed at the Smoking and Post 1 moments, when compared to the Rest and Post 2 moments. The SD2 index showed to be significantly lower at the Smoking and Post 1 moments when compared with the Post 2 moment. The SD1/SD2 ratio showed a significantly lower value in all moments when compared to the Rest moment. Additionally, the value in the Smoking moment was also significantly lower than in the Post 2 moment.
The RR interval values and the indices in the TD and FD before, during and after smoking are shown in Table 2. Significantly lower RR interval, RR, SDNN, RMSSD, LFms2
and HFms2 values are observed in the Smoking and Post 1
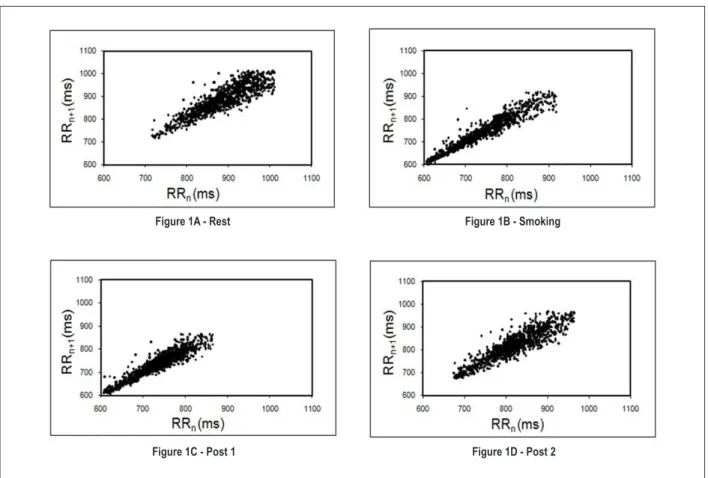
moments, when compared to the Rest and Post 2 moments. The LFnu and LF/HF ratio values were significantly higher, whereas the HFnu was significantly lower in the Smoking moment, when compared to the Rest moment. Figure 1 shows an example of qualitative analysis of the Poincaré plot before, during and in the periods analyzed after smoking.
Discussion
The results obtained through the HRV indices in the present study showed that smoking resulted in acute modifications in the HRV indices, characterized by a decrease in the parasympathetic activity and increase in the sympathetic activity, as well as the recovery of these indices 30 minutes after smoking cessation.
The analyses of the Poincaré plot indices showed that the vagal modulation, represented by the index SD129 and
the SD1/SD2 ratio presented a significant decrease during smoking, indicating a decrease in the HRV in these individuals (Table 01). Decreases in the linear indices RMSSD and HF, in normalized units and ms2, also occurred during the
smoking period, in addition to the increase in the LF/HF ratio, confirming the decrease in the parasympathetic activity demonstrated by the indices extracted from the plot (Table 02). Decrease in the vagal modulation during smoking was also observed by Karakaya et al11, who evaluated the acute effects
of smoking in 15 nonsmoker volunteers on HRV indices and observed changes in the TD and FD, particularly in the 5-10 minutes immediately after the act of smoking, characterized by a decrease in the SDNN, RMSSD and HF indices, as well as an increase in the LF index. Nabors-Oberg et al30 equally
verified a decrease in the HF index during smoking. These parasympathetic alterations seem to be related to the effects of smoking on the automaticity of the sinus node31.
The RR intervals showed to be decreased during smoking in comparison with the rest period; moreover, there was an increase in the LFnu index and the LF/HF ratio (Table 02), suggesting that during smoking, associated with the decrease in the parasympathetic activity, there was an increase in the sympathetic activity. Kobayashi et al32 observed an increase in
the LF/HF ratio within 5 minutes after smoking. These findings are also in agreement with the studies by Narkiewikz et al9 and
Gerhardt et al10, who observed an increase in the sympathetic
modulation during smoking.
Table 1 -Mean values and respective standard deviations, medians and conidence intervals for the indices extracted from the Poincaré plot
of smokers in the rest, smoking and post-smoking periods
Variables Rest Smoking Post 1 Post 2
SD1 23.4 ± 9.2 (21.2)*
[19.6 – 27.2]
13.8 ± 4.8 (13)†.§ [11.8 – 15.8]
16.1 ± 7.2 (14.2)†.§ [13.2 – 19.1]
20 ± 7.8 (20.2) [16.5 – 23.1]
SD2 75.1 ± 22.5 (70)
[65.8 – 84.4]
67.3 ± 14.5 (63.2)§ [61.3 – 73.3]
71.6 ± 23.7 (69.6)§ [61.8 – 81.4]
82.7 ± 28.2 (79.2) [71 – 94.3]
SD1/SD2 0.31 ± 0.08 (0.3) [0.28 – 0.34]
0.2 ± 0.04 (0.2)†.§ [0.18 – 0.22]
0.23 ± 0.06 (0.2)† [0.2 – 0.25]
0.24 ± 0.05 (0.23)† [0.2 – 0.26]
*Mean ± SD (median); [95%CI]; †Signiicant difference in relation to Rest; §Signiicant difference in relation to Post 2 (Friedman’s Test; p < 0.05); Legends: SD1 - standard
deviation of the instantaneous variability of the beat-to-beat heart rate; SD2 - standard deviation of long-term continuous RR interval variability; SD1/SD2 ratio - ratio
Table 2 -Mean values with respective standard-deviations, medians and conidence intervals for heart rate, RR interval, linear indices at DT e
DF of smokers in the rest, smoking and post-smoking periods
Variables Rest Smoking Post 1 Post 2
RR (ms) 816.8 ± 89 (851)*[780.2 – 853.5] 696.5 ± 76.3 (711)[665 - 728] †.§ 723.4 ± 93 (741)[685 – 761.8]†.§ 766.7 ± 96 (794)[727 – 806.3]
SDNN 47.6 ± 14.8 (44)
[41.5 – 53.7]
35.5 ± 8.4 (34)†.§ [32 - 39]
38.6 ± 13 (38)†.§ [33.2 – 43.7]
46.6 ± 14.9 (46) [40.4 – 52.7]
RMSSD 32.7 ± 13 (30)
[27.4 – 38]
19.1 ± 6.8 (18.2)†.§ [16.3 - 22]
22.4 ± 10.2 (20)†.§ [18.2 – 26.6]
27.2 ± 11 (28.2) [23.2 – 32.2]
LF (ms2) 524.8 ± 348.5 (440.0) [380.9 – 668.6]
307.9 ± 172.0 (258.0)†.§ [236.9 – 378.9]
340.7 ± 227.4 (369.0) †.§ [246.8 – 434.6]
502.7 ± 280.5 (483.0) [386.9 – 618.5]
HF (ms2) 246.8 ± 174.8 (189.0) [174.7 – 319.0]
81.24 ± 73.78 (65.0)†.§ [50.78 – 111.7]
120.96 ± 105.1 (102.0)†.§ [77.59 – 164.3]
182.4 ± 130.0 (153.0) [128.7 – 236.0]
LFnu 67.5 ± 11.6 (65.6)
[62.7– 72.3]
81 ± 8.1 (81)† [77.8 – 84.4]
74.7 ± 10.3 (76.6) [70.4 – 79]
74.5 ± 10 (75) [70.4 – 78.6]
HFnu 32.5 ± 11.6 (34.4)
[27.7 – 37.3]
19 ± 8.1 (19)† [15.5 – 22.2]
25.3 ± 10.3 (23.4) [21 – 29.5]
25.5 ± 10 (25) [21.4 – 30]
LF/HF 2.6 ± 1.7 (2)
[2 – 3.3]
5.4 ± 3.1 (4.2)† [4.1 – 6.7]
3.7 ± 2.1 (3.3) [2.8 – 4.2]
3.5 ± 1.7 (3) [2.8 – 4.2]
*Mean ± SD (median); [95%CI]; † Signiicant difference in relation to rest period; § Signiicant difference in relation to Post 2 period (Friedman’s Test or ANOVA for repeated
measures; p < 0.05); HR - heart rate; ms - milliseconds; SDNN - standard deviation of all normal sinus R-R intervals; RMSSD - root mean square of the difference between successive normal adjacent R-R intervals; LF - low frequency; nu - normalized unit; HF - high frequency.
Figure 1 -Visual pattern of Poincaré plot observed in smokers before (1A), during (1B) and after smoking (1C and 1D). 1A shows a good dispersion of points, characteristics
of a normal plot, whereas 1B and 1C show a decrease in dispersion, characterizing a reduction in HRV and increase in the sympathetic activity. Figure 1D shows the return to the same pattern observed in Figure 1A, suggesting post-smoking HRV recovery.
Figure 1A - Rest Figure 1B - Smoking
The SD2 index, characteristic of global autonomic modulation, presented lower values during smoking when compared to those observed in the rest period (Table 01) and the same occurred with the SDNN and LF indices in ms2 (Table 02).
The qualitative analysis (visual) of the plot also demonstrated the acute effect of smoking and showed the decrease in the HRV in smokers. The Poincaré plot chart shows a decrease in the dispersion of points at the Smoking and Post1 moments (Figures 1B and 1C) when compared with the Rest and Post 2 moments (Figures 1A and 1D). This chart pattern, according to the literature, demonstrates an increase in the sympathetic activity and, consequently, a decrease in the HRV5,33.
The acute effects of smoking are attributed mainly to the action of nicotine that binds to nicotinic cholinergic receptors present in the autonomic ganglia, neuromuscular junctions and central nervous system, which, when stimulated, increase the release of several neurotransmitters34,35. The nicotine and
others substances found in cigarettes also stimulate the release of adrenalin into the sympathetic nervous system (SNS). Additionally, the stimulation of the nicotinic receptors in the autonomic nervous system (ANS) has been associated with the sympathetic excitatory effects of smoking36.
There are three possible mechanisms to explain this sympathetic activation. The first is a direct effect on the central nervous system; and the second is a stimulatory effect on the ganglionic sympathetic transmission that leads to a subsequent increase in the postganglionic efferent sympathetic activity; and the third, is an effect on the sympathetic peripheral nervous terminations34,37. For Grassi et al38, in addition to the
peripheral adrenergic stimulation, there is a partial loss by baroreflex capacity to contain it.
During the recovery period, the analysis of the indices obtained through the Poincaré plot showed an increase in the vagal modulation evaluated through the SD1 index, reaching levels close to those observed in the Rest period at the Post 2 period. The SD2 index returned to basal levels at the end of the studied period, whereas the SD1/SD2 ratio remained decreased throughout the 30-minute period post-smoking (Table 01). The decrease in the SD1/SD2 ratio is due to the marked increase in the SD2 index.
As for the qualitative analysis of the plot, the alterations observed during smoking persisted throughout the period immediately after smoking (Post 1), with recovery and a pattern very similar to that observed in the Rest period in the Post 2 moment (Figure 1D).
This recovery was also observed in all linear indices of HRV throughout the 30-minute period that followed the act of smoking (Table 02), which corroborates the findings by Hayano et al12, who studied young smokers and observed an
increase in HR, a decrease in the HF index three minutes after smoking and an increase in the LF index 10 to 17 minutes after smoking, with values retuning to initial levels after 24 minutes. The recovery of the HRV indices might be related to the fact that, after smoking, there is a peak of circulating nicotine concentration, which rapidly declines during the subsequent 20 minutes due to tissue distribution39, indicating that the
nicotine-induced effects on the ANS might be attenuated throughout time.
Other factors can also be mentioned to explain the rapid post-smoking recovery and, in this sense, age and the smoking characteristics of the studied individuals must be taken into account. As the individuals are young and healthy, we suppose that the ANS is intact, which guarantees the sympathetic-vagal balance necessary to maintain the normality of the autonomic cardiac control. Regarding the smoking characteristics, the low consumption of cigarettes and time of smoking might also have influenced these results.
The Poincaré plot is a technique that allows the visualization of all points described in a series of consecutive RR intervals and also facilitates the identification of the abnormal points corresponding to premature beats, compensatory pauses or technical artifacts, which allows the easy correction of the RR series for the analysis of the HRV. This visualization is not possible through the spectral analysis or by the TD, which represents a good advantage of the Poincaré plot in relation to these methods.
The Poincaré plot allows the analysis of series of non-stationary RR intervals25 and provides both summarized and
detailed information, beat-to-beat, of the cardiac behavior40.
Such aspects represent important advantages of its use in relation to linear analysis methods; however, it is worth mentioning that the direct measurement of the autonomic activity can determine whether the Poincaré plot can be considered a more sensitive method to detect autonomic alterations in comparison to such methods.
In brief, the results of the present study show that smoking resulted in acute modifications in HRV indices, characterized by the decrease in the parasympathetic activity and increase in the sympathetic activity, as well as the recovery of these indices 30 minutes after smoking, which were evaluated quantitatively and qualitatively by Poincaré plot.
Conclusion
The analyses of the indices extracted from the Poincaré plot and the linear indices in the TD and FD showed that smoking resulted in acute modifications in the autonomic cardiac control, characterized by the decrease in the parasympathetic activity and increase in the sympathetic activity, as well as in the recovery of these indices 30 minutes after smoking. Additionally, the Poincaré plot showed to be a sensitive and simple method to detect acute alterations in HRV caused by smoking.
Potential Conflict of Interest
No potential conflict of interest relevant to this article was reported.
Sources of Funding
There were no external funding sources for this study.
Study Association
References
1. Task Force of the European Society of Cardiology and the North American Society of Pacing and Electrophysiology, Heart rate variability: standards of measurement, physiological interpretation and clinical use. Circulation. 1996;93(5):1043-65.
2. Acharya UR, Joseph KP, Kannathal N, Lim CM, Suri JS. Heart rate variability: a review. Med Bio Eng Comput. 2006;44(12):1031-51.
3. Santos MDB, Moraes FR, Maraes VRFS, Sakabe DI, Takahashi ACM, Oliveira L, et al. Estudo da arritmia sinusal respiratória e da variabilidade da freqüência cardíaca de homens jovens e de meia-idade. Rev Soc Cardiol Estado de São Paulo. 2003;13(3 supl):15-24.
4. Eryonucu B, Bilge M, Guler N, Uzun K, Gencer M. Effects of cigarette smoking on the circadian rhythm of heart rate variability. Acta Cardiol. 2000;55(5):301-5.
5. Barutcu I, Esen AM, Kaya D, Turkmen M, Karakaya O, Melek M, et al. Cigarette smoking and heart hate variability: dynamic influence of parasympathetic and sympathetic maneuvers. Ann Noninvasive Electrocardiol. 2005;10(3):324-9.
6. Arosio E, De Marchi S, Rigoni A, Prior M, Lechi A. Effects of smoking on cardiopulmonary baroreceptor activation and peripheral vascular resistance. Eur J Clin Invest. 2006;36(5):320-5.
7. Tsuji H, Venditti FJ, Manders ES, Evans JC, Larson MG, Feldman CL, et al. Reduced heart rate variability and mortality risk in elderly cohort. Circulation. 1994;90(2):878-83.
8. Kleiger RE, Miller JP, Bigger JT, Moss AJ. Multicenter post infarction myocardial infarction research group: decreased heart rate variability and its association with increased mortality after acute myocardial infarction. Am J Cardiol. 1987;59(4):256-62.
9. Narkiewicz K, van de Borne PJH, Hausberg M, Cooley PL, Winniford MD, Davison DE, et al. Cigarette smoking increases sympathetic outflow in humans. Circulation. 1998;98(6):528-34.
10. Gerhardt P, Vorneweg P, Riedasch M, Hohage H. Acute and persistent effects of smoking on the baroreceptor function. J Auton Pharmacol. 1999;19(2):105-8.
11. Karakaya O, Barutcu I, Kaya D, Esen AM, Saglam M, Melek M, et al. Acute effect of cigarette smoking on heart rate variability. Angiology. 2007;58(5):620-4.
12. Hayano J; Yamada M; Sakakibara Y, Fujinami T, Yokoyama K, Watanabe Y, et al. Short- and long- term effects of cigarette smoking on heart rate variability. Am J Cardiol. 1990;65(1):84-8.
13. Pumprla J, Howorka K, Groves D, Chester M, Nolan J. Functional assessment of heart rate variability: physiological basis and practical applications. Int J Cardiol. 2002;84(1):1-14.
14. Voss A, Kurths J, Kleiner HJ, Witt A, Wessel N, Saparin P, et al. The application of methods of non-linear dynamics for the improved and predictive recognition of patients threatened by sudden cardiac death. Cardiovasc Res. 1996;31(3):419-33.
15. Huikuri HV, Mäkikallio TH, Perkiömäki J. Measurement of heart rate variability by methods based on nonlinear dynamics. J Electrocardiol. 2003;36(Suppl):95-9.
16. Ribeiro JP, Filho RSM. Variabilidade da freqüência cardíaca como instrumento de investigação do sistema nervoso autônomo. Rev Bras Hipertens. 2005;12(1):14-20.
17. Khaled AS, Owis MI, Mohamed ASA. Employing time-domain methods and Poincaré plot of heart rate variability signals to detect congestive heart failure. BIME Journal. 2006;6(1):35-41.
18. Voss A, Schroeder R, Truebner S, Goernig M, Figulla HR, Schirdewan A. Comparison of nonlinear methods symbolic dynamics, detrended fluctuation, and Poincaré plot analysis in risk stratification in patients with dilated cardiomyopathy. Chaos. 2007;17(1):015120.
19. Acharya R, Kannathal N, Krishnan SM. Comprehensive analysis of cardiac health using heart rate signals. Physiol Meas. 2004;25(5):1139-51.
20. Karmakar C, Khandoker AH, Gubbi J, Palaniswami M. Complex correlation measure: a novel descriptor for Poincaré plot. Biomed Eng Online. 2009,8:17.
21. Jatlow P, Toll BA, Leary V, Krishnan-Sarin S, O’Malley SS. Comparison of expired carbon monoxide and plasma cotinine as markers of cigarette abstinence. Drug Alcohol Depend. 2008;98(3):203-9.
22. Vanderlei LCM, Silva RA, Pastre CM, Azevedo FM, Godoy MF. Comparison of the Polar S810i monitor and the ECG for the analysis of heart rate variability in the time and frequency domains. Braz J Med Biol Res. 2008;41(10):854-9.
23. Gamelin FX, Berthoin S, Bosquet L. Validity of the polar S810 heart rate monitor to measure R-R intervals at rest. Med Sci Sports Exerc. 2006;38(5):887-93.
24. Godoy MF, Takakura IT, Correa PR. Relevância da análise do comportamento dinâmico não-linear (Teoria do Caos) como elemento prognóstico de morbidade e mortalidade em pacientes submetidos à cirurgia de revascularização miocárdica. Arq Ciênc Saúde. 2005;12(4):167-71.
25. Guzik P, Piskorski J, Krauze T, Schneider R, Wesseling KH, Wykretowicz A, et al. Correlations between the Poincaré plot and conventional heart rate variability parameters assessed during paced breathing. J Physiol Sci. 2007,57(1):63-71.
26. Tulppo MP, Mäkikallio TH, Seppänen T, Laukkanen RT, Huikuri HV. Vagal modulation of heart rate during exercise: effects of age and physical fitness. Am J Physiol. 1998;274(2Pt 2):H424-9.
27. Lopes FL, Pereira FM, Reboredo MM, Castro TM, Vianna JM, Novo Jr JM, et al. Redução da variabilidade da freqüência cardíaca em indivíduos de meia-idade e o efeito do treinamento de força. Rev Bras Fisioter. 2007;11(2):113-9.
28. Niskanen JP, Tarvainen MP, Ranta-aho OP, Karjalainen PA. Software for advanced HRV analysis. Comput Methods Programs Biomed. 2004;76(1):73-81.
29. Mourot L, Bouhaddi M, Perrey S, Rouillon JD, Regnard J. Quantitative Poincaré plot analysis of heart rate variability: effect of endurance training. Eur J Appl Physiol. 2004;91(1):79-87.
30. Nabors- Oberg RE, Niaura RS, Sollers JJ, Thayer JF. The effects of controlled smoking on heart period variability. IEEE Eng Med Biol Mag. 2002;21(4):65-70.
31. Katz A, Grosbard A. Does it all go up in smoke? Cigarette smoking and tachyarrhythmias. J Cardiovasc Electrophysiol. 2006;17(19):937-9.
32. Kobayashi F, Watanabe T, Akamatsu Y, Furui H, Tomita T, Ohashi R, et al. Acute effects of cigarette smoking on the heart rate variability of taxi drivers during work. Scand J Work Environ Health. 2005;31(5):360-6.
33. Shi P, Zhu Y, Allen J, Hu S. Analysis of pulse rate variability derived from photoplethysmography with the combination of lagged Poincaré plots and spectral characteristics. Med Eng Phys. 2009;31(7):866-71.
34. Shinozaki N, Yuasa T, Takata S. Cigarette smoking augments sympathetic nerve activity in patients with coronary heart disease. Int Heart J. 2008;49(3):261-72.
35. Planeta CS, Cruz FC. Bases neurofisiológicas da dependência do tabaco. Rev Psiq Clin. 2005;32(5):251-8.
36. Adamopoulos D, van de Borne P, Argacha JF. New insights into the sympathetic, endothelial and coronary effects of nicotine. Clin Exp Pharmacol Physiol. 2008;35(4):458-63.
37. Hass M, Kübler W. Nicotine and sympathetic neurotransmission. Cardiovasc Drugs Ther. 1996;10(6):657-65.
38. Grassi G, Seravalle G, Calhoun DA, Bolla GB, Giannattasio C, Marabini M, et al. Mechanisms responsible for sympathetic activation by cigarette smoking in humans. Circulation. 1994;90(1):248-53.
39. Hukkanen J, Jacob III P, Benowitz NL. Metabolism and disposition kinetics of nicotine. Pharmacol Rev. 2005;57(1):79-115.