Systematic review of the synergist muscle ablation model
for compensatory hypertrophy
STELLA MARIS LINS TERENA1, KRISTIANNE PORTA SANTOS FERNANDES2, SANDRA KALILL BUSSADORI3, ALESSANDRO MELO DEANA3,
RAQUEL AGNELLI MESQUITA-FERRARI3*
1Doctoral Student in Biophotonics Applied to Health Sciences, Universidade Nove de Julho (Uninove), São Paulo, SP, Brazil 2Full Professor, Rehabilitation Sciences and Biophotonics Applied to Health Sciences, Uninove, São Paulo, SP, Brazil 3Full Professor, Biophotonics Applied to Health Sciences, Uninove, São Paulo, SP, Brazil
S
UMMARYStudy conducted by the Graduate Program in Biophotonics applied to
Health Sciences, Universidade Nove de Julho (Uninove), São Paulo, SP, Brazil
Article received: 2/21/2016
Accepted for publication: 6/26/2016
*Correspondence:
Departamento de Pós-Graduação, Uninove
Address: Rua Vergueiro, 249, Liberdade São Paulo, SP – Brazil
Postal code: 01504-001 [email protected]
http://dx.doi.org/10.1590/1806-9282.63.02.164
Objective: The aim was to evaluate the effectiveness of the experimental synergists muscle ablation model to promote muscle hypertrophy, determine the period of greatest hypertrophy and its inluence on muscle iber types and determine differences in bilateral and unilateral removal to reduce the number of animals used in this model.
Method: Following the application of the eligibility criteria for the mechanical overload of the plantar muscle in rats, nineteen papers were included in the review.
Results: The results reveal a greatest hypertrophy occurring between days 12 and 15, and based on the indings, synergist muscle ablation is an eficient model for achieving rapid hypertrophy and the contralateral limb can be used as there was no difference between unilateral and bilateral surgery, which reduces the number of animals used in this model.
Conclusion: This model differs from other overload models (exercise and training) regarding the characteristics involved in the hypertrophy process (acute) and result in a chronic muscle adaptation with selective regulation and modiication of fast-twitch ibers in skeletal muscle. This is an eficient and rapid model for compensatory hypertrophy.
Keywords: ablation of synergists, compensatory hypertrophy, experimental models, muscle mass, skeletal muscle cross-sectional area.
I
NTRODUCTIONSkeletal muscle is highly adaptive and has a self-regulat-ing capacity.1-3 Hypertrophy is an example of this
plastic-ity and refers to the increase in muscle mass necessary to enable the muscle to optimize its response to the demands of sustaining and generating force.1,2,4-6
Skeletal muscle mass is regulated by a variety of stim-uli, the best known of which is mechanical overload. The muscle adaptation process can be induced by stretching/ immobilization,44,46 compensatory mechanisms
(chron-ic).1,2-6,8,9,12,14,18-20,61-65 and exercise/training.33,46 Evidence of
this is derived from a large number of studies demonstrat-ing that overload leads to an increase in muscle mass and cross-sectional area of the muscle ibers and induces chronic changes in the balance between the synthesis and degradation of proteins.2,7-9 Compensatory hypertrophy
through the ablation of synergists of plantar lexion is one of the ways to produce chronic overload experimen-tally.3,7,12,13,20,59 The ablation of synergists for
compensa-tory hypertrophy consists of the surgical removal of all or part of synergistic muscles, which can be either unilat-eral or bilatunilat-eral, to generate chronic functional overload that causes hypertrophy.3,7,12,13,20,59 According to Parvaresh
et al.,1 complete muscle removal can compromise the
neurovascular supply, which increases edema and the recovery of the animal in the postoperative period. Thus, the removal of only the distal portion of synergist muscle is recommended (Figure 1).
The synergist muscle ablation model induces muscle hypertrophy in only a few days, thereby facilitating the study of adaptive responses.2,3,7,10-20 The most studied
skeletal muscle has different types of ibers (type I [slow--twitch] and type II [fast-twitch – IIa, IIb, IIx/IId]),21 a
number of authors justify the choice of the plantaris muscle due to its diversity of iber types (type I: 8 ± 2%; type IIA: 19 ± 3%; type IIB/D: 74 ± 4%) and its different adaptation possibilities.9 Compensatory hypertrophy
induced by the functional elimination of synergistic muscles results in an increase in muscle iber diameter and muscle mass as well as the regulation of protein syn-thesis in different types of muscle ibers.
The present systematic review of the literature dis-cusses the results found in studies using this experimen-tal model to cause overload in the plantar muscle of rats, comparing the indings with regard to the percentage increase in the mass of the plantar muscle, the period of greatest muscle mass gain and differences between uni-lateral and biuni-lateral surgery. The aim of this review was to evaluate the effectiveness of the experimental synergist muscle ablation model to promote muscle hypertrophy in different overload models, to determine the period of greatest hypertrophy and its inluence on muscle iber types, and to determine differences in bilateral and uni-lateral removal to reduce the number of animals used in
this model, thereby facilitating its reproduction and its choice among different chronic hypertrophy models.
M
ETHODThe methods were based on PRISMA guidelines. Search-es were performed in the PubMed, ScienceDirect, MED-LINE and CAPES Portal databases for articles published between January 1999 and July 2013 using the keywords “compensatory hypertrophy” AND “mechanical overload”
OR “ablation of synergists” AND “compensatory hyper-trophy” AND “experimental models” OR “skeletal muscle cross-sectional area.” The following criteria were used for the selection of papers: (1) the use of a rat model; (2) the use of synergist ablation to overload the plantaris muscle; (3) bilateral or unilateral muscle removal; and (4) deter-mination of the cross-sectional area of muscle ibers or muscle mass. Review articles were excluded, as well as other experimental models and in vitro studies. Articles that used overload in another muscle and did not report on their studies the cross-sectional area (CSA) or muscle mass were also excluded.
A total of 63 articles were retrieved using combinations of the keywords. Twenty-four papers were review articles;7,9,21-42
FIGURE 1 Synergist ablation surgery of plantaris muscle. A. Shaving the back of the hind leg. B. Incision of 2 cm. C. Tendon of gastrocnemius muscle. D. Partial removal of the lateral gastrocnemius muscle. E. Soleus muscle – total removal. F. Partial removal of the medial gastrocnemius muscle. G. The plantaris muscle is isolated. H. Suture with seven points.
Plantaris muscle
A B C D
H G
F
eight studies used a model other than the ablation of syner-gists to cause hypertrophy;43-50 and six were in vitro studies.51-56
All these studies were excluded. Among the remaining 25 studies, seven did not compare the cross-sectional area of the muscle and/or muscle mass to a control group and were excluded.3,13,15,48,57,59,60 Thus, 19 studies met the inclusion
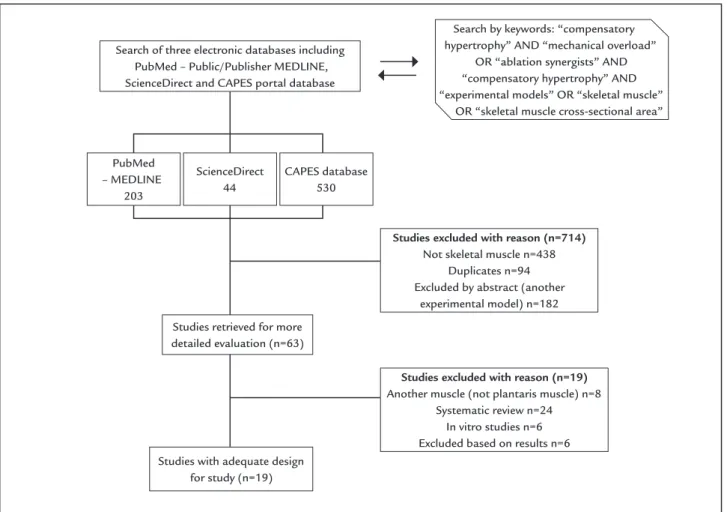
criteria and were selected for the present review (Figure 2).
Statistical analysis
The data from graphs were grouped based on collection time and percentage of increase in mass of the plantaris muscle with error propagation. A scatter plot was created to show the distribution of muscle mass gain in function of the number of days following the ablation procedure. Two regressions were employed: one for less than 15 days of data and another for more than 15 days of data. A slope of the regression line coeficient of 0.042 ± 0.002% and
linear coeficient of 0.095 ± 0.021% was used for this
cal-culation (slope of the regression line coeficient + x linear
coeficient, in which x is the number of days). R2 values
demonstrate how the data approaches the progression and form a straight line (R2 = 0.52 in the irst 15 days
following the ablation of synergist muscles and R2 = 0.06,
15 days after surgery). Values greater than 50% demonstrate that the linear it is adequate. Chebyshev’s inequality test was used to compare muscle mass following unilateral or bilateral removal. This test makes no assumptions regard-ing the normality of the data distribution and only re-quires the means and standard errors as inputs. Only periods of 14 and 28 days were compared, which were the periods used by most authors. The results were p=0.2996 for 14 days and p=0.2584 for 28 days.
R
ESULTSTable 1 summarizes the indings of the 19 articles ana-lyzed in the present systematic review. Considerable variation was found in the analysis period following the ablation of synergists. Increases in muscle mass (g) and
FIGURE 2 Flowchart of the selection process of literature according to the PRISMA guidelines.
Search of three electronic databases including PubMed – Public/Publisher MEDLINE, ScienceDirect and CAPES portal database
Studies with adequate design for study (n=19)
Studies excluded with reason (n=19)
Another muscle (not plantaris muscle) n=8 Systematic review n=24
In vitro studies n=6 Excluded based on results n=6
Studies excluded with reason (n=714)
Not skeletal muscle n=438 Duplicates n=94 Excluded by abstract (another
experimental model) n=182
Search by keywords: “compensatory hypertrophy” AND “mechanical overload”
OR “ablation synergists” AND “compensatory hypertrophy” AND “experimental models” OR “skeletal muscle”
OR “skeletal muscle cross-sectional area”
PubMed – MEDLINE
203
ScienceDirect 44
CAPES database 530
iber cross-sectional area (μm2) of the plantar muscle
were reported in all studies evaluated, demonstrating compensatory hypertrophy.
The data were grouped based on collection time and percentage of increase in mass of the plantar muscle with error propagation. The trend line revealed linear progression up to 15 days, with stabilization of the data after this period. The method of least squares was used, including the error of the data reported by the authors. For studies that did not provide such information, the mean error was used. The trend line in Figure 3 shows the percentage (± error) of increase in muscle mass ac-cording to days after surgery as follows: 13.6 ± 2.1% one day after ablation, 38.7 ± 2.6% seven days after ablation and 68.0 ± 3.6% 14 days after ablation.
Only periods of 14 and 28 days were compared, which were the periods used by most authors. Both groups presented a large effect size (1.15 and 1.39 for 14 and 28 days, respectively) but since the authors made no assump-tions regarding the data’s distribution, the p-values were higher than the signiicance level (p=0.2996 for 14 days and p=0.2584 for 28 days), thus no signiicant differ-ences were found between unilateral and bilateral surgery in the two periods. At 28 days, there is an overlap between both 95% conidence intervals ([68%, 85%] and [45%, 61%] for unilateral and bilateral, respectively) but no overlap was found at 14 days ([38%, 55%] and [45%, 61%] for uni-lateral and biuni-lateral, respectively). By not assuming the normality of the data’s distribution, the authors guar-antee the probability of the type I error at α = 0.05 at the expenses of an increased probability of the type II error. Therefore, despite the lack of statistical signiicance, the power of the test was low due to the limited data in the literature on unilateral synergist ablation reporting the percentage gain in plantaris muscle mass.
All data were grouped based on the period after the ablation of synergists (Figure 4). Greatest hypertrophy occurred between 12 and 15 days postoperatively. The increase in the cross-sectional area of the muscle and mus-cle ibers was studied using histological techniques.1,7-9,60
The mean increase in cross-sectional area in comparison to the control was 66 ± 4% at day 14, demonstrating that compensatory hypertrophy is an effective model for increas-ing muscle mass.
D
ISCUSSIONCompensatory hypertrophy occurs in response to a sus-tained increase in the mechanical load of skeletal muscle. Although the mechanisms involved in compensatory hypertrophy are not yet fully understood, this is an intense
topic of research, which includes the deinition, measur-ing, loading stimulus parameters, acute responses, hyper-plasia, experimental models, adaptations of muscle iber types, the involvement of satellite cells and endocrinol-ogy. The purpose of the present systematic review was to gather results reported by researchers who have used the standard ablation of synergists (gastrocnemius and so-leus muscles) model to determine the induction of hy-pertrophy in the plantar muscle of rats, comparing the percentage of muscle gain to facilitate and standardize the use of this model for the study of muscle plasticity following functional overload. Increasing interest in the molecular and cellular mechanisms responsible for hy-pertrophy in recent years1,6-9 underscores the need for a
reliable and easily reproducible model. Rats are often used due to their considerable activity and their larger size in comparison to mice. The mean weight of the animals used in the studies analyzed was 220 ± 12 g.1-5,7,14-16,18
Among the models described in the literature for changes in muscle demand, different protocols of me-chanical loading have been used: resistance training (RT) and compensatory hypertrophy after ablation and te-notomy.2,3,5-7,13,18,65 Current theories suggest differences
between mechanisms that induce hypertrophy through exercise and compensatory hypertrophy. Both methods cause changes in the muscle, but the molecular signaling pathways seem to be different.26,49 Compensatory
hyper-trophy due to the ablation of synergists and tenotomy differ in terms of phases. The former has two distinct phases: an inlammatory phase, followed by the response of the muscle to the demand for a functional increase. Tenotomy has the disadvantage of the rapid reconnection of the cut tendon, which limits functionality.65
Most commonly studied muscles
Compensatory hypertrophy by the ablation of synergists is an eficient model for studies on muscle hypertrophy,2,3,7,10-20
as the fast increase in muscle mass reduces the duration of the experiment. In recent years, changes have occurred in the standard of surgery (bilateral or unilateral) and the re-lationship between the number of days and increase in muscle mass, which justiies this systematic review.
In rats, the most commonly studied muscles are the tibial anterior, digitorum longus, soleus and plantar muscles.1-5,7,14-16,18 In the 1980s and 1990s, the model most
often employed was the entire removal of the tibialis anterior to generate overload of the digitorum longus.15
TABLE 1 Studies selected for review using the synergist ablation model for compensatory hypertrophy.
Article Ablation of synergists Study design Data collection Outcomes
(compared to control)
Adams et al.4 Unilateral Plantar mass Rat body mass
6, 12, 24 and 48 h 3, 7 and 12 days
12 d Body mass (g) (226 ± 5 to 257 ± 6) Muscle mass (mg/g) (1.07 ± 0.02 to 1.73 ± 0.18) Dunn et al.64 Bilateral Cross-sectional area of
muscle
7, 14 and 28 days 28 d Cross-sectional area increased 75% compared to control
Bodine et al5 Bilateral Muscle mass 7, 14 and 30 days 7 d Muscle mass increased by 25% 14 d Muscle mass increased by 38% Adams et al.65 Bilateral Cross-sectional area 6 and 24 h
3, 7, 15 and 90 days
90 d 46% increase in cross-sectional area of muscle ibers
Lee et al.62 Bilateral Muscle mass 1, 3, 7 and 21 days 1 d Increased by 10% 3 d Increased by 31% 21 d Increased by 21% Yamaguchi et al.12 Unilateral Cross-sectional area 3 and 14 days 14 d Increased by 43.3 ± 3.8% Sakuma et al.63 Unilateral Muscle mass 1, 2, 3, 4, 6, 8, 10, 14
and 28 days
1 d Increased by 56% 3 d Increased by 40,9% 6 d Increased by 31.3 % 10 d Increased by 44.8 % 14 d Increased by 46.8% 28 d Increased by 76.2% Pehme et al.14 Bilateral Muscle mass 14 days 14 d Increased by 40% DiPasquale et al.1 Bilateral Cross-sectional area 1, 3, 5 and 14 days 3 d Increase in peak edema
No statistical difference in cross-sectional area of muscle in 3 days
Marino et al.6 Bilateral Cross-sectional area Peak edema
3, 7 and 14 days 3 d Statistical difference in cross-sectional area of muscle
Retention of 90% water
7 d 5% Increase in cross-sectional area of muscle
Retention of 70% water
14 d 21% increase in cross-sectional area of muscle
Retention of 45% water Novack et al.18 Bilateral Plantar mass
Peak edema
1, 3, 5 and 14 days 14 d 80% increase in muscle mass Peak edema in 5 days
Huey et al.19 Bilateral Relative and absolute plantaris muscle
12 h, 1, 2, 3 and 7 days 7 d Relative mass increased by 15% Absolute mass increased by 21%
Pavaresh et al.2 Bilateral Absolute and relative mass 3 and 7 days 3 d Absolute mass increased by 10% Relative mass increased by 18% 7 d Absolute mass increased by 21% Relative mass increased by 20% Goodman et al.7 Bilateral Cross-sectional area 7 and 14 days 14 d Increased by 30%
Schuenke et al.9 Bilateral Cross-sectional area 28 days 28 d Increased by 35% in young rats Increased by 21% in older rats Goodman et al.8 Bilateral Cross-sectional area 10 days 10 d 1,000 ± 60 vs.
2,000 ± 200 (µm2)
Gordon et al.20 Bilateral Muscle mass 1 and 3 days 1 d Increased by 48 ± 9% (m±SD) 3 d Increased by 73 ± 17% (m±SD) Bentzinger et al.61 Unilateral Muscle mass 7 and 28 days 7 d Increased by 90%
Time after ablation of synergists (days)
Gain in mass (%)
140%
120%
100%
80%
60%
40%
20%
0%
10 15 20 25 30 35
0 5
> 15 days
Linear regression ≤ 15 days
FIGURE 3 Distribution of plantaris muscle hypertrophy according to number of days after ablation of synergists. Dark gray dots represent data collected in less than 15 days after ablation. Light gray dots represent data collected 15 days after ablation of synergists. The trend line demonstrates linear progression up to 15 days, with stabilization thereafter.
FIGURE 4 Mean gain in muscle mass according to time after the ablation of synergists based on the literature.
Time after ablation of synergists (days)
1-3 6-10 12-15 21 28-30
Gain in mass (%)
80%
70%
60%
50%
40%
30%
20%
10%
the gastrocnemius. Despite displaying anatomical prox-imity in rats, these muscles are distinct in their architec-ture and biochemistry.6,9,16,19,58
Considering the different types of muscle iber (slow--twitch [type I] and fast(slow--twitch [type IIa, IIb, IIx and IId]),21
a number of authors justify the choice of the plantar muscle for studies on adaptation due to its composition of different iber types. The plantar muscle is predomi-nantly composed of ibers IId and therefore has a smaller amount of mitochondria as such ibers use the glyco-lytic pathway for a faster response during gait. Authors attribute this adaptation feature of the plantar muscle to its constant activation during the stance phase and weight bearing in quadrupeds, which use this muscle to resume ambulation.9
Unilateral vs. bilateral surgery
Based on the data analyzed, both unilateral and bilateral synergist ablation lead to an increase in muscle mass, with no statistically signiicant difference between the two types of surgery. Researchers working with unilateral surgery report a mean increase in muscle mass of 46.8 ± 2.6% 14 days following synergist ablation,4,12,61,63 whereas those
working with bilateral surgery report an increase of 52.3 ± 3.1% in the same period.4,12,61,63 Although the number of
studies involving unilateral ablation (n=4) was smaller than the number involving bilateral ablation (n=14), the similar increase in muscle mass demonstrates the beneits of uni-lateral surgery, which reduces the number of animals used in experiments and is in line with the goals of the Interna-tional Council for Laboratory Animal Sciences.
Expected time for hypertrophy
The data collection period varied considerably among the studies analyzed. Moreover, it is important to determine how the data are distributed for adequate visualization of the period of greatest hypertrophy. The synergist abla-tion model led to an increase in muscle mass in the irst three days due to inlammation and edema caused by the surgical procedure.1,2,6,20,62,63 This disadvantage in the
com-pensatory hypertrophy model by synergist ablation is due to the inlammation process that occurs after surgery. However, Novack et al.18 demonstrated that components
of the acute inlammatory response are required in the muscle repair and remodeling process and the intensity of the inlammatory response is related to the magnitude of hypertrophy. With synergist ablation, the increase in prostaglandin-endoperoxide synthase 2 (COX-2) seems to be related to the considerable increase in muscle mass that occurs in this model and the inlammatory response
enables and facilitates the activity of extracellular prote-ases, the accumulation of macrophages and cell prolif-eration, including the activation and proliferation of satellite cells, which seems to exert an inluence on the greater hypertrophy achieved with this model in com-parison to exercise-induced hypertrophy.
According to Marino et al.,6 no statistically signiicant
difference in the cross-sectional area of the muscle ibers was found in the irst three days following ablation. At 3 to 5 days, the edema is reduced, followed by an increase in the cross-sectional area of the muscle ibers as well as en-zyme activity and protein synthesis, which constitute hy-pertrophy as an adaptation to the new condition of chron-ic overload.1,6,18,61,63 The period of 12 to 15 days was
identiied as that with the greatest percentage increase in muscle mass in comparison to the control (Figure 3), dem-onstrating a linear progression (i.e., a progressive gain in muscle mass over the irst 15 days after ablation). At 28 days, the authors found no further increase in gene expres-sion related to increased muscle mass,9,64,65 as
demonstrat-ed by the cessation of linear progression and stabilization of the data (Figure 2). Thus, peak hypertrophy (greatest increase in muscle mass and cross-sectional area of the muscle ibers) occurs between the second and third week following synergist ablation. Concentrating studies on this period is fundamental to determining the impact of novel therapies and interventions designed either to diminish or potentiate the effects of compensatory muscle hypertrophy.
Cross-sectional area and types of muscle iber
The increase in the cross-sectional area of the muscle and muscle fibers was studied using histological tech-niques.1,7-9,61 The mean increase in cross-sectional area in
comparison to the control was 18.66% in 14 days, dem-onstrating that compensatory hypertrophy is an effective model for increasing muscle mass. The trend line in Fig-ure 2 shows the percentage increase in muscle mass ac-cording to days following surgery: approximately 10% one day after ablation, 38% seven days after ablation and 68% 14 days after ablation.
The increase in the cross-sectional area of muscle is related to protein synthesis of the muscle ibers and the activation of satellite cells. Studies suggest that satellite cells are responsible for both the growth of muscle ibers and the regulation of the muscle iber phenotype.8,14,19,20,37,46
At the onset of compensatory hypertrophy, the muscle iber alters its response. The relationship among the cross--sectional area, hypertrophy and iber type37 indicates that
Goodman et al.8 demonstrated a signiicant increase
in protein synthesis in four types of muscle iber (slow--twitch [type I] and fast(slow--twitch [type IIa, IIb and IIx]) in the plantaris muscle in rats submitted to synergist abla-tion. Type IIb ibers exhibited the least amount of protein synthesis, whereas IIa ibers exhibited the most amount of protein synthesis, which did not differ signiicantly from that found in type I ibers. In the cross-sectional area, type IIb ibers were shorter than IIa ibers, which also exceeded the area found in type I ibers. These ind-ings suggest that this model results in the selective regulation and modiication of fast-twitch ibers in skeletal muscle.
C
ONCLUSIONBased on the indings of the present systematic review, the following conclusions may be drawn: 1. the synergist ablation model differs from other overload models regard-ing the characteristics involved in the hypertrophy process; 2. 12 to 15 days following ablation is the period of great-est muscle hypertrophy; 3. the lack of a signiicant differ-ence in the gain in muscle mass between unilateral and bilateral ablation demonstrates that contralateral limb can be used as the control, which reduces the number of animals used in this model; and 4. synergist muscle abla-tion is an eficient reproducible model for achieving rapid hypertrophy and results in the selective regulation and modiication of fast-twitch ibers in skeletal muscle.
A
CKNOWLEDGMENTFunding for this study was provided by Universidade Nove de Julho, São Paulo, Brazil.
C
ONFLICT OF INTERESTThe authors declare no conlict of interest.
R
ESUMORevisão sistemática do modelo de ablação dos músculos sinérgicos na hipertroia compensatória
Objetivo: Avaliar a eicácia do modelo experimental de ablação dos sinergistas para promover a hipertroia mus-cular, determinar o período de maior hipertroia, sua inluência sobre os tipos de ibras musculares e determi-nar diferenças na remoção unilateral ou bilateral para reduzir o número de animais utilizados nesse modelo.
Método: Após a aplicação dos critérios de elegibilidade para sobrecarga mecânica do músculo plantar em ratos, 19 artigos foram incluídos na revisão.
Resultados: Ocorre maior hipertroia entre os dias 12 e 15, o que torna o modelo eiciente para alcançar a hiper-troia rapidamente. O membro contralateral também pode ser usado, pois não houve diferença entre a cirurgia unilateral e bilateral, o que reduz o número de animais usados no experimento.
Conclusão: O modelo difere de outros modelos de so-brecarga (exercício e treinamento) em razão das caracte-rísticas envolvidas no processo de sobrecarga imposta (aguda), resultando em uma adaptação crônica muscular com modiicação de ibras de contração rápida do mús-culo esquelético. É um modelo rápido e eiciente para se estudar hipertroia compensatória.
Palavras-chave: ablação dos sinergistas, hipertroia com-pensatória, modelos experimentais, massa muscular, área de secção transversa do músculo esquelético.
R
EFERENCES1. DiPasquale DM, Cheng M, Billich W, Huang SA, Rooijen N, Hornberger TA, et al. Urokinase – type plasminogen activator and macrophages are re-quired for skeletal muscle hypertrophy in mice. Am J Physiol Cell Physiol. 2007; 293(4):1278-85.
2. Pavaresh KC, Huber AM, Brochin RL, Bacon PL, McCall G.E, Huey KA, et al. Acute vascular endothelial growth factor expression during hypertrophy is muscle phenotype speciic and localizes as a striated pattern within ibers. Exp Physiol. 2010; 95(11):1098-106.
3. McCarthy JJ, Mula J, Miyasaki M, Erfani R, Garrison K, Farooqui AB, et al. Effective iber hypertrophy in satellite cell-depleted skeletal muscle. Devel-opment. 2011; 138(17):3657-66.
4. Adams GR, Haddad F, Baldwin KM. Time course of changes in markers of myogenesis in overloaded rat skeletal muscles. J Appl Physiol (1985). 1999; 87(5):1705-12.
5. Bodine SC, Stitt TN, Gonzalez M, Kline WO, Stover GL, Bauerlein R, et al. Akt/mTOR pathway is a crucial regulator of skeletal muscle hypertrophy and can prevent muscle atrophy in vivo. Nat Cell Biol. 2001; 3(11):1014-9. 6. Marino JS, Taush BJ, Dearth CL, Manacci MV, McLoughlin TJ, Rakyta SJ,
et al. Beta2-integrins contribute to skeletal muscle hypertrophy in mice. Am J Physiol Cell Physiol. 2008; 295(4):1026-36.
7. Goodman CA, Mayhew DL, Hornberger TA. Recent progress toward under-standing the molecular mechanisms that regulate skeletal muscle mass. Cell Signal. 2011; 23(12):1896-906.
8. Goodman CA, Kotecki JA, Jacobs BL, Hornberger TA. Muscle iber type-de-pendent differences in the regulation of protein synthesis. PLoS One. 2012; 7(5):e37890.
9. Schuenke MD, Brooks NE, Hikida RS. Interactions of aging, overload and creatine supplementation in rat plantaris muscle. J Aging Res. 2011; 2011:393416.
10. White JP, Reecy MJ, Washington TA, Sato, Le M, Davis JM, et al. Overload--induced skeletal muscle extracellular matrix remodeling and myoibre
growth in mice lacking IL-6. Acta Physiol (Oxf). 2009; 197(4):321-32. 11. Almurshed KS, Grunewald KK. Dietary protein does not affect overloaded
skeletal muscle in rat. J Nutr. 2000; 130(7):1743-8.
12. Yamaguchi A, Ikeda Y, Hirai T, Fujikawa T, Morita I. Local changes of IGF-1 mRNA, GH receptor MRNA, and iber size in rat plantaris muscle following compensatory overload. Jpn J Physiol. 2003; 53:53-60.
13. Sakuma K, Nishikawa J, Nakao R, Nakano H, Sano M, Yasuhara M. Serum response factor plays an important role in the mechanically overload plan-taris muscle of rats. Histochem Cell Biol. 2003; 119(2):149-60.
15. Young RE, Young JC. The effect of creatine supplementation on mass and performance of rat skeletal muscle. Life Sci. 2007; 81(9):710-6.
16. Locke M. Heat shock protein accumulation and heat shock transcription factor activation in rat skeletal muscle during compensatory hypertrophy. Acta Physiol (Oxf) 2008; 192(3):403-11.
17. Choi H, Selpides IPJ, Novell MM, Rourke BC. Functional overload in ground squirrel plantaris muscle fails to induce myosin isoform shifts. Am J Physi-ol Regul Integr Comp PhysiPhysi-ol. 2009; 297(3):R578-86.
18. Novack ML, Billich W, Smith S, Sukhija KB, McLoughlin TJ, Hornberger TA, et al. COX-2 inhibitor reduces skeletal muscle hypertrophy in mice. Am J Physiol Regul Integr Comp Physiol. 2009; 296(4):R1132-9.
19. Huey KA, Burdette S, Zhong H, Roy RR. Early response of heat shock pro-teins to functional overload of the soleus and plantaris in rats and mice. Exp Physiol. 2010; 95(12):1145-55.
20. Gordon BS, Delgado Dias DC, White JP, Carson JA, Kostec MC. Six1 and Six1 cofactor expression is altered during early skeletal muscle overload in mice. J Physiol Sci. 2012; 62(5):393-401.
21. Schiafino S, Dyar KA, Ciciliot S, Blaauw B, Sandri M. Mechanisms regu-lating skeletal muscle grow and atrophy. FEBS J. 2013; 280(17):4294-314. 22. Bismuth K, Relaix F. Genetic regulation of skeletal muscle development.
Exp Cell Res. 2010; 316(18):3081-6.
23. Elliott B, Renshaw D, Getting S, Mackenzie R. The central role of myostatin in skeletal muscle and whole body homeostasis. Acta Physiol (Oxf). 2012; 205(3):324-40.
24. Glass DJ. Skeletal muscle hypertrophy and atrophy signaling pathways. Int J Biochem Cell Biol. 2005; 37(10):1974-84.
25. Aline G, Sotiropoulos A. A key factor controlling muscle hypertrophy by en-hance the recruitment of muscle stem cells. Bioarchitecture. 2012; 2:88-90. 26. Martin NRW, Lewis MP. Satellite cell activation and number following acute and chronic exercise: a mini review. Cell Mol Exerc Physiol. 2012; 1(1):e3. 27. Otto A, Patel K. Signalling and the control of skeletal muscle size. Exp Cell
Res. 2010; 316(18):3059-66.
28. Ohira Y, Kawano F, Wang XD, Nakai N, Ohira T, Okabe H, et al. Role(s) of mechanical load and satellite cells in the regulation of the size of soleus muscle iber in rats. Biol Sci Space. 2010; 24(3-4):135-44.
29. Kawano F, Nakai N, Ohira Y. Regulation of soleus muscle properties by me-chanical stress and/or neural activity. J Phys Sports Med. 2012; 1(1):29-36. 30. Morgan JE, Partridge TA. Muscle satellite cells. Int J Biochem Cell Biol. 2003;
35(8):1151-6.
31. Stewart CE, Pell JM. Point: IGF is the major physiological regulation of mus-cle mass. J Appl Physiol. 2010; 108:1820-4.
32. Sakuma K, Yamaguchi A. The functional role of calcineurin in hypertrophy, regeneration, and disorders of skeletal muscle. J Biomed Biotechnol. 2010; 2010:72129.
33. Sakuma K, Yamaguchi A. Molecular determinants of skeletal muscle hyper-trophy in animals. J Sport Medic Doping Studie. 2012; S1:002. Available from: https://www.omicsonline.org/2161-0673/2161-0673-S1-002.pdf. 34. Scharner J, Zammit PS. The muscle satellite cell at 50: the formative years.
Skelet Muscle. 2011; 1(1):28.
35. Schadrach JL, Wagers AJ. Stem cells for skeletal muscle repair. Phil Trans R Soc B. 2011; 366:2297-306.
36. Schmalbruch H. The satellite cell of skeletal muscle ibers. Braz J Morphol Sci. 2006; 23(2):159-72.
37. Teixeira CE, Duarte J.A. Myonuclear domain in skeletal muscle ibers. A crit-ical review. Arch Exerc Health. 2011; 2(2):92-101.
38. Yabolnka-Reuveni Z. The skeletal muscle satellite cell: still young and fas-cinating at 50. J Histochem Cytochem. 2011; 59(12):1041-59.
39. West DWD, Burd NA, Staples AW, Phillips SM. Human exercise-mediated skeletal muscle hypertrophy is an intrinsic process. Int J Biochem Cell Biol. 2010; 42(9):1371-5.
40. van Wessel T, de Haan A, van der Laarse WJ, Jaspers RT. The muscle iber type-iber paradox: hypertrophy or oxidative metabolism? Eur J Appl Physi-ol. 2010; 110(4):665-94.
41. Zanou N, Gailly P. Skeletal muscle hypertrophy and regeneration: interplay between the myogenic regulatory factors (MRFs) and insulin-like growth factors (IGFs) pathways. Cell Mol Life Sci. 2013; 70(21):4117-30. 42. Yan Z, Okutsu M, Alhtar YN, Lira V. Regulation of exercise-induced iber
type transformation, mitochondrial biogenesis, and angiogenesis in skele-tal muscle. J Appl Physiol (1985). 2011; 110(1):264-74.
43. Allouh MZ, Yabolnka-Reuveni Z, Rosser BWC. Pax7 reveals a greater fre-quency and concentration of satellite cells at the ends of growing skeletal muscle ibers. J Histochem Cytochem. 2008; 56(1):77-87.
44. Allen DL, Harrison BC, Sartorius C, Byrnes WC, Leinwand LA. Mutation of the IIB myosin heavy chain gene results in muscle iber loss and compensa-tory hypertrophy. Am J Physiol Cell Physiol. 2001; 280(3):C637-45. 45. Aoki MS, Miyabara EH, Soares AG, Salvini TF, Moriscot AS. Cyclosporin-A
does not affect skeletal muscle mass during disuse and recovery. Braz J Med Biol Res. 2006; 39(2):243-51.
46. Fuller PM, Baldwin KM, Fuller CA. Parallel and divergent adaptations of rat soleus and plantaris to chronic exercise and hypergravity. Am J Physiol Regul Integr Comp Physiol. 2006; 290(2):R442-8.
47. Qaisar R, Renaud G, Morine K, Barton ER, Sweeney HL, Larsson L. Is func-tional hypertrophy and speciic force coupled with the addition of myonu-clei at the single muscle iber level? FASEB J. 2012; 26(3):1077-85. 48. Kawano F, Goto K, Wang XD, Terada M, Oshira T, Nakai N, et al. Role(s)
of gravitational loading during developing period on the growth of rat so-leus muscle ibers. J Appl Physiol (1985). 2010; 108(3):676-85.
49. Seene T, Pehme A, Alev K, Kassik P, Umnova M, Aru M. Effects of resistance training on fast- and slow-twitch muscles in rats. Biol Sport. 2010; 27:221-9. 50. Zhang BT, Yeung SS, Liu Y, Wang HH, Wan YM, Ling SK, et al. The effects of low frequency electrical stimulation on satellite cell activity in rat skele-tal muscle during hindlimb suspension. BMC Cell Biol. 2010; 11:87. 51. Blaauw B, Canato M, Agatea L, Toniolo L, Mammucari C, Masiero E, et al.
Inducible activation of Akt increases skeletal muscle mass and force with-out satellite cell activation. FASEB J. 2009; 23(11):3896-905.
52. Chen JF, Tao Y, Li J, Deng Z, Yan Z, Xiao X, et al. microRNA-1 and microR-NA-206 regulate skeletal muscle satellite cell proliferation and differentia-tion by repressing Pax7. J Cell Biol. 2010; 190(:867-79.
53. Jacquemim V, Furling AB, Butler-Browne GS, Mouly V. IGF-1 induces hu-man myotube hypertrophy by increasing cell recruitment. Exp Cell Res. 2004; 299(1):148-58.
54. Shefer G, Wleklinski-Lee M, Yabolnka-Reuveni Z. Skeletal muscle satellite cells can spontaneously enter an alternative mesenchymal pathway. J Cell Sci. 2004; 117(Pt 22):5393-404.
55. Liadaki K, Casar JC, Wessen M, Luth EC, Jun S, Gussoni E, Kunkel LM. β4 integrin marks intersticial myogenic progenitor cells in adult murine skel-etal muscle. J Histochem Cytochem. 2012; 60(1):31-44.
56. Wang M, Yu H, Kim YS, Bidwell CA, Kuang S. Myostatin facilities slow and inhibits fast myosin heavy chain expression during myogenic differentia-tion. Biochem Biophys Res Commun. 2012; 426(1):83-8.
57. Ishido M, Kami K, Masuhara M. Localization of MyoD, myogenin and cell cycle regulatory factors in hypertrophying rat skeletal muscle. Acta Physi-ol Scand. 2004; 180(3):281-9.
58. Kawano F, Matsuoka Y, Oke Y, Higo Y, Terada M, Wang XD, et al. Role(s) of nucleoli and phosphorylation of ribosomal protein S6 and/or HSP27 in the regulation of muscle mass. Am J Physiol Cell Physiol. 2006; 293(1):C35-44. 59. Terada M, Kawano F, Ohira T, Nakai N, Nishimoto N, Ohira Y. Effects of
mechanical over-loading on the properties of soleus muscle ibers, with or without damage, in wild type and Mdx mice. PLoS One. 2011; 7(4):e.34557. 60. Reynolds TH 4th, Bodine SC, Lawrence JC Jr. Control of Ser2448 phosphor-ylation in the mammalian target of rapamycin by insulin and skeletal mus-cle load. J Biol Chem. 2002; 277(20):17657-62.
61. Bentzinger CF, Lin S, Romanino K, Castets P, Guridi M, Summermatter S, et al. Differential response of skeletal muscles to mTORC1 signaling dur-ing atrophy and hypertrophy. Skelet Muscle. 2013; 3(1):6.
62. Lee WJ, Thompson RW, McClung JM, Carson JA. Regulation of androgen receptor expression at the onset of functional overload in rat plantaris muscle. Am J Physiol Reg Integr Comp Physiol. 2003; 285(5):R1076-85. 63. Sakuma K, Watanabe K, Sano M, Uramoto I, Totsuka T. Differential
adaptation of growth and differentiation factor 8/myostatin, ibroblast growth factor 6 and leukemia inhibitory factor in overloaded, regener-ating and denervated rat muscles. Biochim Biophys Acta. 2000; 1497(1):77-88.
64. Dunn SE, Burn JL, Michel RN. Calcineurin is required for skeletal muscle hypertrophy. J Biol Chem. 1999; 274:21908-12.