SUMMARY
Objective: To identify factors associated with the risk of malnutrition in hospitalized patients. Methods: Cross-sectional study, performed in a general hospital located in São Paulo, in a convenience sample of 300 adult individuals, aged 18 to 64 years. A struc-tured questionnaire was applied consisting of anthropometric, clinical and dietary data, and the patients were evaluated and dichotomized into malnourished and non-malnour-ished. A multiple logistic regression was performed to identify the factors associated with malnutrition. he variables were organized according to the values of odds ratio (OR), conidence interval (95% CI), regression coeicient (β) and descriptive level of sig-niicance (p). Results: he malnutrition occurred in 60.7% and the variables associated with malnutrition were: recent and involuntary weight loss, apparent bony structure, decreased appetite, diarrhea, inadequate energy intake and male sex. Conclusion: he factors associated with malnutrition can be identiied at hospital admission and lead to a nutritional evaluation that will allow adequate intervention and nutritional therapy.
Keywords: Nutrition assessment; inpatients; malnutrition.
Study conducted at the Postgraduate Program in Public Health of Faculdade de Saúde Pública, Universidade de São Paulo, and at the Department of Nutrition and Hospital São Paulo, Universidade Federal
de São Paulo, São Paulo, SP, Brazil
Submitted on: 02/23/2011 Approved on: 08/04/2011
Correspondence to: Rita de Cássia de Aquino Rua Pires da Mota, 1011/113
Aclimação CEP: 01529-001 São Paulo, SP, Brazil [email protected]
Conlict of interest: None.
©2011 Elsevier Editora Ltda. All rights reserved.
Identification of malnutrition risk factors in hospitalized patients
RITADE CÁSSIADE AQUINO1, SONIA TUCUNDUVA PHILIPPI2
1 PhD in Public Health; Professor, Universidade São Judas Tadeu, Graduate Course in Nutrition and Multidisciplinary and Postgraduate Program in Sciences of Aging, São Paulo, SP, Brazil
INTRODUCTION
he high global prevalence of malnutrition in hospitalized patients has been widely documented over the past four decades1-6. Several studies analyzing hospital malnutrition have correlated its presence and consequences, such as in-creased frequency of clinical complications and mortality, impact on costs and hospital length of stay; the longer the patient stays in the hospital, the greater the risk of malnu-trition worsening7.
Malnutrition in hospitalized individuals is the result of a number of factors and may be associated with the dis-ease and/or its treatment7. One major cause is inadequate dietary intake and there are several clinical situations that can cause loss of appetite or impaired food intake, as well as examinations and procedures that require fasting and changes in diet composition8. Moreover, inadequate detec-tion and intervendetec-tion can lead to the worsening of nutri-tional status during hospitalization9.
he evaluation of a patient’s nutritional status is obtained through the nutritional assessment, consisting of methods based on anthropometric measurements, observation of clinical signs of malnutrition, altered biochemical test re-sults detecting low levels of plasma proteins and immunity-mediating cells, as well as evaluation of dietary intake10,11.
Nutritional status assessment may be preceded by the identiication of risks for malnutrition by nutrition screen-ing tools. Although there is no consensus on deinition and procedures, some institutions have published guide-lines on the subject. In 1994, the ADA (American Dietetic Association)12 deined nutritional risk as the “presence of factors that may cause and/or aggravate malnutrition in patients” and the ESPEN (European Society of Parenteral and Enteral Nutrition)13,14 as the “risk of nutritional status impairment due to current medical conditions.” he AS-PEN (American Society of Parenteral and Enteral Nutri-tion)15 considers that the risk factors that can compromise the nutritional status of patients are: weight loss, chronic diseases, increased nutritional needs, dietary changes and the need for enteral and/or parenteral nutrition.
Nutritional risk is associated with variables related to the patient’s general status and history of present illness, and may also include physical, social and psychological factors. In order to provide an adequate nutritional ther-apy, identifying patients at risk is crucial to treatment15,16.
he identiication of malnutrition is an important goal in the global attention to the hospitalized patient. A proper diagnosis is essential for an individualized nutrition ther-apy to be started as soon as possible. he identiication of risk factors is essential for the work of the healthcare team to beneit the patient.
Within this context, the objective of this study was to identify factors associated with risk of malnutrition in hos-pitalized patients.
METHODS
his was a cross-sectional observational study, carried out in a general hospital in São Paulo between January and December 2005. It included individuals that had been hos-pitalized for a day or two, of both sexes, aged between 18 and 64 years. he exclusion criteria were: patients unable to communicate, to be assessed by anthropometric param-eters and admitted for obstetric or psychiatric reasons.
Patients were informed about the study objectives and signed a free and informed consent form if they agreed to participate. he study was approved by the Ethics Research Committee of Faculdade de Saúde Pública, Universidade de São Paulo, protocol No. 828.
Considering the prevalence of malnutrition as about 50%4,5, a convenience sample of 300 patients was statisti-cally estimated.
PATIENTNUTRITIONALASSESSMENT
A structured questionnaire was prepared based on the cri-teria recommended by ADA12,17, consisting of six sets of data related to: patient identiication (personal and socio-demographic data), medical information (reason for hos-pital admission and diagnosis); nutritional data (appetite assessment and changes in the digestive tract), data on food consumption (recent dietary changes and description of present diet); observation of clinical signs of nutritional deiciencies (observation of hair, skin, nails, eyes, mouth, bones, muscles and presence of edema) and evaluation of anthropometric data (measurement and evaluation of weight, circumferences and skinfolds).
Anthropometric measurements were carried out dur-ing the interview and collected by a sdur-ingle examiner (study author) to avoid biases in data collection and interpreta-tion. Weight and height were measured with a portable scale and stadiometer. Measures of body circumferences (arm and calf) and triceps and subscapular skinfold were taken with the patient in the standing position and carried out three times to obtain a mean value. We employed the techniques adopted by Frisancho18 and the analysis was performed based on percentile tables.
Regarding the data on consumption, a regular diet was investigated in the last week before hospital admis-sion and analyzed using VIRTUAL NUTRI20, resulting in total energy value (TEV). he TEV was compared to patient needs, estimated from the formula for basal meta-bolic rate, adopting a multiple of very light physical activ-ity (1.3) or bedridden (1.2) and the injury factor of the disease21. he criterion for inadequate intake was ≤ 75% of the estimated energy needs22.
he criterion adopted for the diagnosis of malnutrition was the presence of at least one of the following anthro-pometric parameters: BMI < 18.5 kg/m2, with no recent history of weight loss, BMI < 20.0 kg/m2, with a history of recent and unintentional weight loss, triceps (TSF) and subscapular (SSSF) skinfold thickness or the sum of both ≤ 5th percentile, triceps (TSF) and subscapular skinfold thickness (SSSF) or sum of both ≤ 15th percentile, when associated with recent and unintentional weight loss; re-cent and unintentional weight loss ≥ 3% within a month or similar or ≥ 5% in the last six months or any period that the patient could not specify, but reported as recent.
STATISTICALANALYSIS
For statistical analysis of data, we chose the logistic regres-sion method, recommended by Jones23, with the objective of evaluating the efect of each variable on the risk of mal-nutrition. Malnutrition was established as the dependent variable and forty-ive independent variables were se-lected, organized from the general questionnaire. Malnu-trition was considered a binary variable (presence or ab-sence) and the strength of association between variables was expressed as odds ratios (OR) with 95% conidence interval (95% CI) and statistical signiicance level of 5%.
he analysis of variables that could be associated with malnutrition was initially performed using the Chi-square test, followed by single and multiple analysis, us-ing the stepwise backward model. he program used for data analysis was Statistical Package for Social Science (SPSS), version 10.0 for Windows.
RESULTS
he population consisted of 300 subjects, 52.7% fe-male and 47.3% fe-male. he most frequent age range was 30 to 49 years and the mean age was 45.2 years (SD = 11.8 years). Malnutrition occurred in 60.7% of the sample and the majority of the individuals were males (73.2%). At the univariate regression analysis, iteen variables were associated with malnutrition (p < 0.05) and were organized starting with the most frequently ob-served (Table 1).
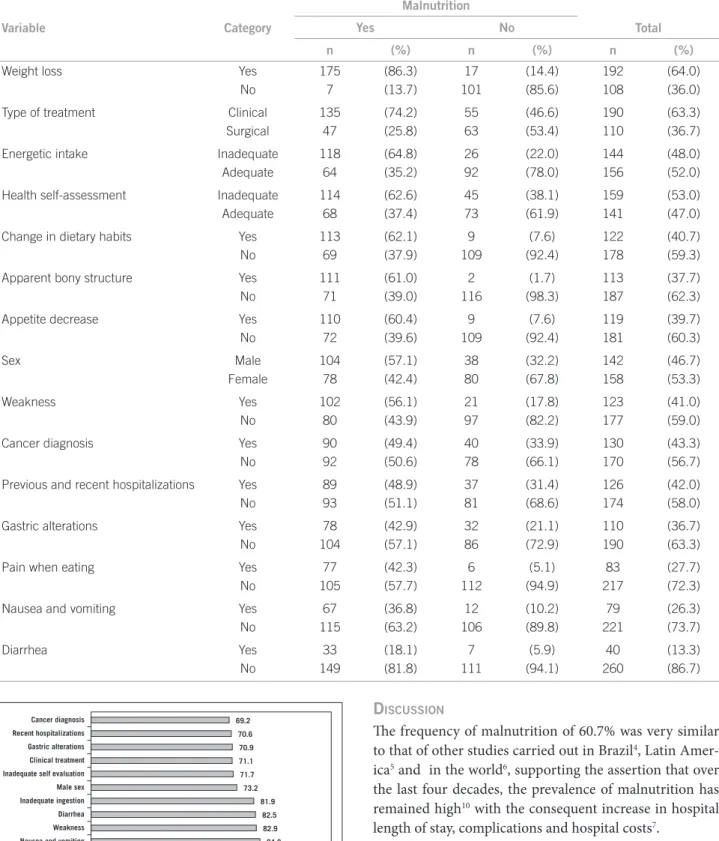
Considering the variables related to body weight as-sessment, recent and involuntary weight loss was the most frequent (64% of the sample) (Table 1) and 91.2%
were malnourished (Figure 1). he highest frequency in the percentage of loss in relation to the usual weight was between 10 to 20% (29.3%), in a period of 1 to 3 months (43.2%) and the mean loss was 15.8 kg (SD = 8.6 kg). At the assessment of clinical signs of malnutrition, the ap-parent bony structure was observed in 37.7% of the popu-lation (Table 1) and 98.2% were malnourished (Figure 1).
Regarding the type of hospital treatment, it was ob-served that most were admitted for clinical treatment (63.3%) and diagnosis of cancer was the cause of hospi-talization in nearly half the sample (43.3%) (Table 1) and most were malnourished (69.2%) (Figure 1).
Concerning the variables associated with the current food intake, recent changes in eating habits were reported by 40.7% of the population (Table 1) and the most frequent change was a reduction in the amount of food consumed (96.4%). When assessing the adequacy of energy intake, we observed that 48.0% of the population did not have individual needs met (Table 1) and of these, 81.9% were malnourished (Figure 1). he average energy consump-tion observed was 1507.0 kcal/day (SD = 763.8 kcal) and the mean among malnourished individuals (1241.7 kcal, SD = 711.5 kcal) was lower (p < 0.05) than among non-malnourished ones (1916.1 kcal, SD = 655.5 kcal).
In the assessment of clinical variables, most did not have recent hospitalizations (58.0%) or weakness (59.0%) (Table 1). However, when assessing these variables and the presence of malnutrition, frequencies of 70.6% and 82.9% were observed, respectively (Figure 1). Regard-ing the self-assessment of current health, 47.0% consid-ered it adequate, even considering the presence of disease and hospitalized patients and of these, 71.7% were mal-nourished.
Among the recent alterations in the digestive tract that were investigated (alterations in dentition and deglu-tition, nausea and vomiting, changes in gastric digestion, diarrhea, constipation and intolerance) the most frequent ones associated with malnutrition were gastric alterations (36.7%) and nausea and vomiting (23.3%) (Table 1) and the frequency of malnourished individuals between the two variables was 70.9 and 84.8%, respectively (Figure 1). Diarrhea was common in 13.3% of the sample and 82.5% of them were malnourished (Table 1 and Figure 1).
Figure 1 – Frequency of malnutrition among the nutritional risk associated factors (p < 0,05) in São Paulo, 2005.
Cancer diagnosis Recent hospitalizations Gastric alterations Clinical treatment Inadequate self evaluation Male sex Inadequate ingestion Diarrhea Weakness Nausea and vomiting Weight loss Appetite decrease Change in dietary habits Pain when eating Apparent bony structure
69.2 70.6 70.9 71.1 71.7 73.2
81.9 82.5 82.9 84.8
91.2 92.4 92.6 92.8 98.2 % 0 20 40 60 80 100 120
DISCUSSION
he frequency of malnutrition of 60.7% was very similar to that of other studies carried out in Brazil4, Latin Amer-ica5 and in the world6, supporting the assertion that over the last four decades, the prevalence of malnutrition has remained high10 with the consequent increase in hospital length of stay, complications and hospital costs7.
Within this context, the results of the regression anal-ysis identiied predictive variables, i.e., associated with malnutrition in this population. Regarding the variables (recent weight loss, apparent bony structure, decreased appetite, diarrhea and inadequate energy intake), it can be observed that they are oten found in similar studies to identify nutritional risk24-34, methods that are generally subjective and essentially clinical.
Table 1 – Frequency of factors associated with malnutrition (p < 0.05) after univariate logistic regression in São Paulo, 2005
Variable Category
Malnutrition
Total
Yes No
n (%) n (%) n (%)
Weight loss Yes 175 (86.3) 17 (14.4) 192 (64.0)
No 7 (13.7) 101 (85.6) 108 (36.0)
Type of treatment Clinical 135 (74.2) 55 (46.6) 190 (63.3)
Surgical 47 (25.8) 63 (53.4) 110 (36.7)
Energetic intake Inadequate 118 (64.8) 26 (22.0) 144 (48.0)
Adequate 64 (35.2) 92 (78.0) 156 (52.0)
Health self-assessment Inadequate 114 (62.6) 45 (38.1) 159 (53.0)
Adequate 68 (37.4) 73 (61.9) 141 (47.0)
Change in dietary habits Yes 113 (62.1) 9 (7.6) 122 (40.7)
No 69 (37.9) 109 (92.4) 178 (59.3)
Apparent bony structure Yes 111 (61.0) 2 (1.7) 113 (37.7)
No 71 (39.0) 116 (98.3) 187 (62.3)
Appetite decrease Yes 110 (60.4) 9 (7.6) 119 (39.7)
No 72 (39.6) 109 (92.4) 181 (60.3)
Sex Male 104 (57.1) 38 (32.2) 142 (46.7)
Female 78 (42.4) 80 (67.8) 158 (53.3)
Weakness Yes 102 (56.1) 21 (17.8) 123 (41.0)
No 80 (43.9) 97 (82.2) 177 (59.0)
Cancer diagnosis Yes 90 (49.4) 40 (33.9) 130 (43.3)
No 92 (50.6) 78 (66.1) 170 (56.7)
Previous and recent hospitalizations Yes 89 (48.9) 37 (31.4) 126 (42.0)
No 93 (51.1) 81 (68.6) 174 (58.0)
Gastric alterations Yes 78 (42.9) 32 (21.1) 110 (36.7)
No 104 (57.1) 86 (72.9) 190 (63.3)
Pain when eating Yes 77 (42.3) 6 (5.1) 83 (27.7)
No 105 (57.7) 112 (94.9) 217 (72.3)
Nausea and vomiting Yes 67 (36.8) 12 (10.2) 79 (26.3)
No 115 (63.2) 106 (89.8) 221 (73.7)
Diarrhea Yes 33 (18.1) 7 (5.9) 40 (13.3)
Detsky et al.24,25 validated the Subjective Global Assess-ment of Nutritional Status (SGA) with variables similar to those in this study. SGA is a commonly used method in clinical practice consisting of an interview about recent changes in body weight, changes in eating habits, gastroin-testinal alterations and illness stress assessment.
Weight loss was the main observed variable and the strongest predictor of malnutrition (OR = 58.03, 95% CI: 18.46-182.41, p < 0.001). In a study by Kruizenga et al.33, weight loss was the main risk factor and the values were similar (OR = 37.7, 95% CI: 10.7-57.3, p < 0.001). Elmore et al.26 developed a predictive equation based on variables associated with malnutrition, using the percentage of weight loss together with the levels of serum albumin and total lymphocyte count.
he process of weight loss, regardless of the individual’s usual weight, is considered a process of malnutrition in itself even if the patient remains within the normal stan-dards ater the body alterations35. However, weight loss is not an easy variable to quantify, as it depends on the pa-tient’s information and constant observation. Several stud-ies have shown that weight loss can be measured indirect-ly, as in the study by Ward et al.27, where it was associated with the patient’s perception and a signiicant association with malnutrition was observed.
Unlike the subjective information on body weight re-duction, clinical observation of an apparent bony struc-ture was evaluated with the aim of perceiving loss of body fat and muscle mass and identifying visibly emaciated patients. It was a variable associated with malnutrition (OR = 47.62, 95% CI: 5.89-384.96, p < 0.001) and observed in 60.9% of malnourished individuals. Egger et al.36 stud-ied patients undergoing nutritional therapy and observed anthropometric, biochemical, and clinical parameters and veriied that the physical examination was the best method to identify malnutrition.
he apparent bony structure, or any other variable used in order to identify clinical signs of malnutrition, is poorly studied in developed countries. Ward et al.27 found an association with the question, “has the patient
lost weight?” (p < 0.05) and among the studied variables, it was the most strongly associated with malnutrition. However, it is important to consider that about 40% of the sample had malnutrition, but no apparent bony struc-ture. he observation of clinical signs depends on the nutritional status of the individual when the process of malnutrition begins and the current phase in which the individual is when evaluated.
Regarding appetite decrease, it is oten observed that it is an important variable associated with malnutri-tion24-34. In the present study, appetite decrease increased the chance of malnutrition in about ten times (OR = 10.31, 95% CI: 2.23-47.55, p = 0.003) and in the study by Fer-guson et al.28 this variable showed the best sensitivity and speciicity. Decreased appetite is a variable that depends on information obtained from the patients and may indirectly assess food intake. It should be noted that appetite may be preserved even when reduced food intake is observed7,9,35. Alterations in the digestive tract that make nutri-ent digestion and/or absorption diicult or impossible are oten indicated as nutritional risk factors27,28,30. In the univariate analysis of the present study, all variables as-sociated with the digestive tract were signiicant: nausea and vomiting, diarrhea, lip, mouth and throat alterations, presence of pain with food intake impairment (p < 0.05). However, only diarrhea remained in multivariate analysis (OR = 8.54, 95% CI 1.32-55.38, p = 0.025). Changes in the gastrointestinal tract symptoms are usually a result of dis-ease or treatment consequence and may have an important impact on nutritional status of the individual, as they afect food intake.
In this study, inadequate food intake was a factor as-sociated with malnutrition, and the average energy con-sumption was lower among malnourished individuals than among non-malnourished ones (p < 0.05). However, the evaluation of energy intake adequacy depends on the ac-curacy with which individual needs and consumption are estimated. he use of predictive equations of basal metab-olism, multiple factors of physical activity and injury fac-tors related to the disease are subject to operating errors21.
Independent variable OR 95% IC β p
Recent weight loss 58.03 (18.46-182.41) 4.06 < 0.001
Apparent bony structure 47.62 (5.89-384.96) 3.86 < 0.001
Decrease in appetite 10.31 (2.23-47.55) 2.33 0.003
Diarrhea 8.54 (1.32-55.38) 2.14 0.025
Inadequate energetic intake 3.68 (1.03-13.12) 1.30 0.045
Male sex 3.51 (1.17-10.52) 1.26 0.025
Few studies to identify risk factors studied energy assess-ment and its relation with the needs, as it requires care-ful data collection and analysis30,31. What is most oten observed is the variable to be assessed indirectly with questions about the decrease in consumption, changes as-sociated with consistency and reduction in frequency of meals32,33.
Laporte et al.31 carried out a study to identify variables predictive of malnutrition, asking the population for in-formation on the current consumption (normal or less than half of what is usually eaten). Ward et al.36 assessed variables associated with malnutrition and dietary chang-es, according to changes in consistency (need for a higher amount of luids in the diet), decrease in the number of meals and recent directions not to consume some types of food. Both studies found an association between malnutri-tion and dietary variables (p < 0.05).
In longitudinal studies, the energy intake evaluation occurs during the hospitalization period. Barton et al.37 found that 40% of hospitalized patients do not have the energy needs met, as well as what was observed by Deper-tuis et al.38 in 57% of their sample.
In the study population, the male sex was a factor asso-ciated with malnutrition; the frequency observed among men and women was 73.2% and 49.4%, respectively, and males had an approximately three-fold higher chance of having malnutrition (OR = 3.51 95% CI 1.17 to 10.52, p = 0.025). Pirlich et al.39 studied social factors in hospital-ized patients (adult and elderly individuals) and found a positive association with the male sex aged 65 years and older (p < 0.05). However, Splett et al.35 observed that weight loss during hospitalization was higher in women than in men (p < 0.05).
To discuss the indings, some considerations are im-portant. In clinical practice, it is observed that men seek healthcare services later than women. his behavior is due to several reasons: men do not have the habit of consult-ing for preventive measures and are much less attentive to changes in weight and food consumption than women. hus, the hypothesis is that, when hospitalized, they may have more chances of being malnourished.
CONCLUSION
Ater the analysis of variables associated with malnutrition (recent weight loss, apparent bony structure, decreased ap-petite, diarrhea, inadequate energy intake and male sex), it can be observed that most can be obtained at hospital admission.
he identiication of malnutrition risk in patients based on predictive variables is the irst step to attain proper nu-tritional care, in order to reduce the frequency of malnutri-tion and its consequences. Each institumalnutri-tion must identify the most frequent factors in the population, develop their
own nutritional screening tools or adopt those among the recommended, developed and adequately validated ones.
Malnutrition prevention and treatment is a major chal-lenge. A proper diagnosis is essential for the nutritional therapy to be started as soon as possible, allowing an ef-icient dietetic-therapeutic intervention. Diagnosis needs to be achieved early, and nutritional status monitoring is the responsibility of the entire healthcare team that treats inpatients. Nutritional intervention in patients at risk of malnutrition leads to a better prognosis, reducing the morbidity and mortality, improving quality of life.
REFERENCES
1. Bistran BR, Blackburn GL, Vitale J, Cochran D, Naylor J. Preva-lence of malnutrition in general patients. J Am Med Assoc. 1976;233:1567-70.
2. Kamath SK, Lawler M, Smith AE, Olson R. Hospital malnutrition: a 33-hospital screening study. J Am Diet Assoc. 1986;86:203-6. 3. Coats KG, Morgan SL, Bartolucci AA, Weinsier RL. Hospital
as-sociated malnutrition: a reevaluation twelve years later. J Am Diet Assoc. 1993;93:27-33.
4. Waitzberg DL, Caiafa WT, Correia MITD. Hospital Malnutrition: he Brazilian National Survey (IBRANUTRI): a study of 4000 pa-tients. Nutrition. 2001;17:573-80.
5. Correia MITD, Campos ACL. Prevalence of hospital malnutri-tion in Latin America: he Multicenter ELAN Study. Nutrimalnutri-tion. 2003;19:823-5.
6. O’ Flynn, Peake H, Hickson M, Foster D, Frost G. he prevalence of malnutrition in hospitals can be reduced. Clin Nutr. 2005;24:1078-88. 7. Raslan M, Gonzalez MC, Dias MCG, Nascimento M, Castro M,
Marques P, et al. Comparison of nutritional risk screening tools for predicting clinical outcomes in hospitalized patients. Nutrition. 2010; 26:721-6.
8. Kondrup J, Johansen N, Plum LM, Bak L, Hojlund Larsen I, Mar-tinsen A, et al. Incidence of nutritional risk and causes of inad-equate nutritional care in hospitals. Clin Nutr. 2002; 21(6):461-8. 9. Kyle UG, Schneider SM, Pirlich M, Lochs H, Hebuterne X T,
Pich-ard C. Does nutritional risk, as assessed by Nutritional Risk Index, increase during hospital stay? A multinational population-based study. Clin Nutr. 2005;24:516-24.
10. Ulíbarri JIP. La desnutrición hospitalaria. Nutr Hosp. 2003;18:109-12. 11. Hornby ST, Nunes QM, Hillman TE, Stanga Z, Neal KR, Rowlands
BJ, et al. Relationship between structural and functional measures nutritional status in a normally nourished population. Clin Nutr. 2005;24:421-6.
12. American Dietetic Association (ADA 1994). ADA’s deinitions for nutrition screening and nutrition assessment. J Am Diet Assoc. 1994;94:838-9.
13. Kondrup J, Alisson SP, Elia M, Vellas B, Plauth M. ESPEN Guide-lines for Nutrition Screening 2002. Clin Nutr. 2003;22:415-21. 14. Lochs H, Allison SP, Meier R, Pirlich M, Kondrup S, Schneider
S, et al. Introductory to the E.S.P.E.N. guidelines on enteral nu-trition: terminology, deinitions, and general topics. Clin Nutr. 2006;25:180-6.
15. A.S.P.EN. (American Society for Parenteral and Enteral Nutrition) Board of Directors and Standards Committee. Deinition of terms, style, and conventions used in ASPEN Guidelines and standards. Nutr Clin Pract. 2005;20:281-5.
16. Charney P. Nutrition screening vs nutrition assessment: how do they difer? Nutr Clin Pract. 2008; 23:366-72.
17. American Dietetic Association (ADA 2002). Position of American Dietetic Association: nutrition services in managed care. J Am Diet Assoc. 2002;102:1471-8
19. Centro de Estudos em Informática em Saúde da UNIFESP/EPM. NUTWIN: Programa de Apoio à Nutrição [Computer program]. São Paulo; 2003.
20. Philippi ST, Szarfarc SC, Latterza AR. VIRTUAL NUTRI [Computer program]. São Paulo; 1996.
21. Barak N, Wall-Alonso E, Sitrin MD. Evaluation of stress factors and body weight adjustments currently used to estimate energy expenditure in hospitalized patients. JPEN J Parenter Enteral Nutr. 2002;26:213-8.
22. Kondrup J, Rasmussen HH, Hamberg O. Nutrition Risk Screening (NRS 2002): a new method based on an analysis of controlled clini-cal. Clin Nutr. 2003;22:321-36.
23. Jones JM. Development of a nutritional screening or assessment tool using a multivariate technique. Nutrition. 2004;20:298-306. 24. Detsky AS, McLaughlin JR, Baker JP, Johnston N, Whittajer S,
Men-delson R et al. What is subjective global assessment of nutritional status? JPEN J Parenter Enteral Nutr. 1987;11:8-13.
25. Detsky AS, Smalley PS, Change J. Is this patient malnourished? J Am Med Assoc. 1994;271:54-8.
26. Elmore MF, Wagner DR, Knoll DM, Eizemberg L, Oswalt MA, Glo-winski EA, et al. Developing an efective adult nutrition screening tool for a community hospital. J Am Diet Assoc. 1994;94:1113-21. 27. Ward J, Closet J, Little J, Boorman J, Perkins A, Coles SJ, et al.
De-velopment of a screening tool for assessing risk of undernutrition in patients in the community. J Hum Nutr Diet. 1998;11:323-30. 28. Ferguson M, Capra S, Bauer J, Banks M. Development of a valid
mal-nutrition screening tool for adult acute hospital patients. Nutrition. 1999;15:458-64.
29. Ulíbarri Pérez JI, González-Madrõno Jiménez A, González Perez P, Fernández G, Rodríguez Salvanés F, Mancha Alvarez-Estrada A, et al. Nuevo procedimiento para la detección precoz de la desnutrición hospitalaria. Nutr Hosp. 2002;17:179-88.
30. Burden ST, Bodey S, Bradburn YJ, Murdoch S, hompson AL, Sim JM, et al. Validation of a nutrition screening tool: testing the reliabil-ity and validreliabil-ity. J Hum Nutr Diet. 2001;14:269-75.
31. Laporte M, Villalon L, Payette H. Simple nutrition screening tool for healthcare facilities: development and validity assessment. Can J Diet Pract Res. 2001; 62:26-34.
32. Weeks CE, Elia M, Emery PW. he development validation and reliability of a nutrition screening tool based on the recommenda-tions of the British Association for Parenteral and Enteral Nutrition (BADEN). Clin Nutr. 2004;23:1104-12.
33. Kruizenga HM, Seidell JC, Vet HCW, Wierdsma NJ, Van Bokhorst-de van Bokhorst-der Schueren MAE. Development and validation of a hospi-tal screening tool for malnutrition: the short nutritional assessment questionnaire. Clin Nutr. 2005;24:75-82.
34. Anthony PS. Nutritional screening tool for hospitalized patients. Nutr Clin Pract. 2008; 23:373-82.
35. Splett PL, Roth-Yousey LL, Vogelzang JL. Medical nutrition therapy for the prevention and treatment of unintentional weight loss in resi-dential healthcare facilities. J Am Diet Assoc. 2003;103:352-62. 36. Egger NG, Carlson GL, Shafer JL. Nutritional status and assessment
of patients on home parenteral nutrition: anthropometry, bioelectri-cal impedance or clinibioelectri-cal judment? Nutrition. 1999;15:1-6. 37. Barton AD, Beigg CL, Macdonald A, Allison SP. High food
wast-age and low nutritional intakes in hospital patients. Clin Nutr. 2000;19:445-9.
38. Dupertuis YM, Kossovsky MP, Kyle UG, Raguso CA, Genton L, Pichard C. Food intake in 1707 hospitalized patients: a prospective comprehensive hospital survey. Clin Nutr. 2003; 22:115-23. 39. Pirlich M, Schütz T, Kemps M, Luhman N, Minko N, Lübke JH,