AR
TIGO
AR
TICLE
1 Programa de Pós-Graduação em Gerontologia Biomédica, Instituto de Geriatria e Gerontologia, Pontifícia Universidade Católica do Rio Grande do Sul. Av. Ipiranga 6681/ Prédio 81/703, Partenon. 90619-900 Porto Alegre RS Brasil. carolboettge@ gmail.com
2 Centro de Ciências da Saúde e Agrárias, Faculdade de Educação Física, Universidade de Cruz Alta. Cruz Alta RS Brasil.
Malnutrition risk and hospitalization
in elderly assisted in Primary Care
Risco de desnutrição e internação hospitalar
em idosos atendidos na Atenção Básica
Resumo O objetivo deste estudo foi investigar a associação do risco de desnutrição e dos itens iso-lados da Mini Avaliação Nutricional (MNA®) com
a ocorrência de internação hospitalar nos últimos 12 meses em idosos atendidos na atenção básica. Trata-se de um estudo transversal no qual foram avaliados 1229 idosos atendidos em Estratégias Saúde da Família de sete municípios da região Sul do Brasil. O risco de desnutrição foi avaliado através da MNA® e a ocorrência de hospitalização
foi determinada por uma questão do instrumento Probability of Repeated Admission (PRA). Os ido-sos eram, em sua maioria, mulheres (61,7%), com média de idade de 71,7 ± 7,7 anos. A frequência de risco de desnutrição foi de 23,3% e de hospitali-zação foi de 32,9%. A frequência de desnutrição e de risco de desnutrição foi duas vezes maior entre os idosos que internaram (36,8% versus 18,6% - P < 0,001). Houve associação significativa entre hospitalização e 11 (64,7%) dos 17 itens da MNA®
avaliados (P < 0,05). Destes, sete itens estavam independentemente associados com a ocorrência de hospitalização na análise multivariada. Ob-servou-se associação do risco de desnutrição, bem como da maioria dos itens isolados da MNA®, com
a ocorrência de internação hospitalar em idosos da atenção básica.
Palavras-chave Desnutrição, Avaliação nutri-cional, Idoso, Hospitalização, Atenção primária à saúde
Abstract The aim of this study was to investigate the association of malnutrition risk and single items of the Mini Nutritional Assessment (MNA®)
with hospitalization in the last 12 months in the elderly assisted in primary care. A cross-sectional study was conducted with the evaluation of 1229 elderly persons assisted in Family Health Strate-gies in seven cities of South Brazil. Malnutrition risk was evaluated using the MNA®, and
hospi-talization was determined by one question of the Probability of Repeated Admission (PRA) instru-ment. Most of the elderly were women (61.7%), with a mean age of 71.7 ± 7.7 years. The mal-nutrition risk rate was 23.3% and hospitalization was 32.9%. The frequency of malnutrition and risk of malnutrition was two times greater among the elderly who were hospitalized (36.8 versus 18.6% - P < 0.001). There was a significant asso-ciation between hospitalization and 11 (64.7%) of the 17 items on the MNA® evaluated (P < 0.05).
Of these, seven items were independently associ-ated with hospitalization by multivariate anal-ysis. We observed an association of malnutrition risk and most of the single MNA® items as well,
with hospitalization in the elderly assisted in pri-mary care.
Key words Malnutrition, Nutritional assess-ment, Elderly, Hospitalization, Primary health care
Carolina Böettge Rosa 1
Solange Beatriz Billig Garces 2
Dinara Hansen 2
Ângela Vieira Brunelli 2
Patrícia Dall’Agnol Bianchi 2
Janaina Coser 2
Marília de Rosso Krug 2
R
osa CB
Introduction
Malnutrition is the most important nutritional disturbance observed in the elderly1, and it is
as-sociated with functional impairment2, prolonged
hospital stay3, institutionalization4 and mortality5.
The Brazilian National Survey on Hospital Nutritional Assessment (IBRANUTRI)6 revealed
that almost half of hospitalized patients in the public network of the country (48,1%) showed some degree of malnutrition, and that malnutri-tion was related to the main cause of hospital-ization, age over 60 years, presence of cancer or infection and prolonged hospital stay.
The detection and identification of malnu-trition risk allows early numalnu-tritional intervention, preventing malnutrition7. However, in countries
such as Brazil, in which it is difficult to measure nutritional risk and its impact on public health, it is essential to employ accurate, rapid and easy to use tools at primary care8.
The Mini Assessment Nutritional (MNA®) is
an instrument that is widely used in nutrition-al assessment and screening of the elderly7. The
MNA® contains specific questions for the elderly
population related to nutrition and health, en-compassing autonomy, cognition, self-percep-tion of nutriself-percep-tional and health status and anthro-pometry. It is a tool capable of identifying mal-nutrition risk, recommended for geriatric rou-tine assessment by the American and European Societies of Enteral and Parenteral Nutrition9,10
and the Portuguese version has been validated for the Brazilian elderly11.
Studies in Brazil, conducted in the context of primary care, which investigate the association between risk of malnutrition and hospitaliza-tion, are scarce. Thus, the aim of this study was to investigate the association between malnutri-tion risk identified by the MNA® and
hospitaliza-tion in the last 12 months in the elderly assisted in Family Health Strategies (FHS). Additionally, we analyzed the association of each item on the MNA® with hospitalization.
Methods
This was a cross-sectional study in which we evaluated elderly individuals (60 years or older) assisted in FHS of seven municipalities of the Conselho Regional de Desenvolvimento do Alto Jacuí-RS (Corede Alto Jacuí), in the period of 2010 to 2012.
In 2010, the Corede Alto Jacuí region in-cluded a population of 155,264 inhabitants in
an area of 6905.5 km2, comprising 14
munici-palities, with Cruz Alta being the pole city. The elderly population of this Corede was estimated at 23,101 (14.87% of the whole population)12. To
consider 50% of the municipalities of the Corede Alto Jacuí, it was stipulated that seven munici-palities would be randomly selected, and these were Cruz Alta and six other municipalities. In each of these municipalities, the sample selected was 10% of the elderly registered and assisted in the last six months in FHS. The exclusion crite-ria were: (a) unable to provide necessary infor-mation (cognitive decline) and (b) residing in a long-term institution.
The elderly were evaluated in their home by a multidisciplinary team composed of nutrition-ists, physical educators, nurses, physiotherapists and academics trained to carry out the health assessment.
Malnutrition risk was evaluated using the MNA®, which is an instrument composed of
18 items (A-R)7: (A) decrease in food intake in
the past three months; (B) involuntary weight loss during the last three months; (C) mobil-ity; (D) psychological stress or acute disease in the past three months; (E) neuropsychologi-cal problems; (F) body mass index (BMI); (G) lives independently; (H) takes more than three prescription drugs per day; (I) pressure sore or skin ulcers; (J) number of full meals per day; (K) consumption markers for protein intake; (L) daily consumption of fruits and vegetables; (M) consumption of fluids per day; (N) mode of feeding; (O) self-view of nutritional status; (P) self-perception of health status; (Q) mid-arm circumference; and (R) calf circumference. Each item is scored from zero to three points, totaling a maximum score of 30 points. The elderly could be classified as “normal nutritional status” (24 to 30 points), “at risk of malnutrition” (17 to 23.5 points) or “malnourished” (<17 points).
The BMI was calculated by dividing the weight in kilograms by the square of the height in meters (weight/height2). To measure body weight,
Plenna® digital scales with maximum capacity of
150 kg was used with subjects standing barefoot and wearing light clothes (Plenna Wave, MEA – 03080, Plenna Especialidades Ltda. São Paulo, SP – Brazil). The height was estimated by the formu-la that utilizes the knee height13. Knee height was
e C
ole
tiv
a,
22(2):575-582,
2017
inelastic tape measure on the right side of the body. The mid-arm circumference was measured at the midpoint between the acromion and the olecranon, and the calf circumference was mea-sured as the maximum circumference of the calf muscle, with the calf uncovered14.
Hospitalization was determined by the question of the Probability of Repeated Admis-sion (PRA) instrument15,16: “In the previous 12
months, have you stayed overnight as a patient in a hospital?”, and the answers were dichotomized in “yes” or “no”.
This study was part of the project titled “Early identification and predictability of grievances in the elderly population assisted in FHS in cities of Corede Alto Jacuí”, approved by the Ethics Com-mittee of University of Cruz Alta. All participants were informed about the objectives and methods of the study and signed an informed consent form.
The data were analyzed using the SPSS Statis-tics software, version 17.0. Continuous variables with normal distribution were given as mean and standard deviation. Categorical variables were expressed as frequency (absolute and relative)
and compared using the chi-square test with analysis of adjusted residuals. The single MNA®
items were dichotomized into maximum versus less than maximum score. The question G was not evaluated, since all the elderly interviewed lived in their own home (inclusion criterion of the study). The single MNA® items that showed a
significant association with hospitalization were included in the adjusted multiple logistic regres-sion model, with the backward selection method (Wald), considering a significance level of P < 0.05 and 95% confidence interval.
Results
We evaluated 1229 elderly assisted in FHS in the municipalities of Cruz Alta (n = 628), Ibirubá (n = 292), Selbach (n = 77), Colorado (n = 73), Quinze de Novembro (n = 71), Salto do Jacuí (n = 54) and Boa Vista do Incra (n = 34).
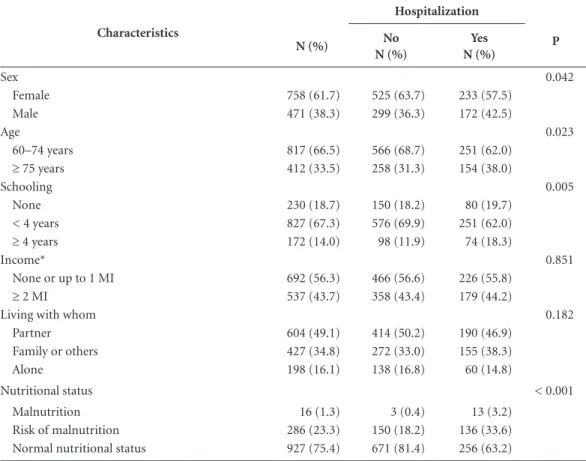
The characterization of the sample is given in Table 1. Mean age of the sample was 71.7 ± 7.7 years (varying from 60 to 102 years), and the
Table 1. Characteristics of the sample and their association with hospitalization in the last 12 months.
Characteristics
Hospitalization
P
N (%) No
N (%)
Yes N (%)
Sex 0.042
Female 758 (61.7) 525 (63.7) 233 (57.5)
Male 471 (38.3) 299 (36.3) 172 (42.5)
Age 0.023
60–74 years 817 (66.5) 566 (68.7) 251 (62.0)
≥ 75 years 412 (33.5) 258 (31.3) 154 (38.0)
Schooling 0.005
None 230 (18.7) 150 (18.2) 80 (19.7)
< 4 years 827 (67.3) 576 (69.9) 251 (62.0)
≥ 4 years 172 (14.0) 98 (11.9) 74 (18.3)
Income* 0.851
None or up to 1 MI 692 (56.3) 466 (56.6) 226 (55.8)
≥ 2 MI 537 (43.7) 358 (43.4) 179 (44.2)
Living with whom 0.182
Partner 604 (49.1) 414 (50.2) 190 (46.9)
Family or others 427 (34.8) 272 (33.0) 155 (38.3)
Alone 198 (16.1) 138 (16.8) 60 (14.8)
Nutritional status < 0.001
Malnutrition 16 (1.3) 3 (0.4) 13 (3.2)
Risk of malnutrition 286 (23.3) 150 (18.2) 136 (33.6)
Normal nutritional status 927 (75.4) 671 (81.4) 256 (63.2)
R
osa CB
majority were women, had less than four years of schooling and equal to or less than the minimum income and lived with a partner.
Malnutrition risk was found in 23.3% of the elderly and 1.3% were malnourished at the time of the interview.
Hospitalization occurring in the last 12 months was reported by 32.9% (n = 405) of the sample. Of those who had been hospitalized, 36.3% (n = 147) were admitted more than once in the period.
The group that reported hospitalization in the last 12 months differed significantly in sex (P
= 0.042), age (P = 0.023), schooling (P = 0.005) and nutritional status (P < 0.001). An association was observed between hospitalization and males, age 75 years or older, schooling higher than four years, malnutrition and risk of malnutrition.
On analyzing the association between malnu-trition risk and hospitalization, we observed that the frequency of malnutrition and risk of malnu-trition was twice as high in the elderly hospital-ized in the last 12 months compared to those not (36.8 versus 18.6%).
There was a significant association between hospitalization in the last 12 months and 11 of the 17 items on the MNA® evaluated (Table 2).
The final model of multivariate analysis showed that seven items on the MNA® were
inde-pendently associated with hospitalization in the last 12 months (Table 3).
Discussion
In this study, we described the association of malnutrition risk and single items of the MNA®
with hospitalization in the last 12 months in the elderly assisted in primary care. The results showed that there was an association of malnu-trition risk and 11 of the 17 items on the MNA®
evaluated with hospitalization, and seven of these 11 were independently associated. To the best of our knowledge, this is the first study that was dedicated to investigating this association at pri-mary care.
The prevalence of malnutrition in the elder-ly varies depending on location and method of
Table 2. Distribution of frequencies of MNA® items below maximum scores and association with hospitalization in the last 12 months.
MNA® item
Hospitalization
P
N (%) No
N (%)
Yes N (%)
Moderate or severe decrease in food intake 273 (22.2) 153 (18.6) 120 (29.6) < 0.001
Weight loss > 1 kg in 3 months or unknown 469 (38.3) 272 (33.0) 197 (48.6) < 0.001
Impaired mobility 92 (7.5) 45 (5.5) 47 (11.6) < 0.001
Psychological stress or acute disease 194 (15.8) 107 (13.0) 87 (21.5) < 0.001
Neuropsychological problems 129 (10.5) 76 (9.2) 53 (13.1) 0.048
Body mass index < 23 kg/m2 263 (21.4) 169 (20.5) 94 (23.2) 0.312
> 3 different medications/day 626 (50.9) 377 (45.8) 249 (61.5) < 0.001
Pressure sores or skin ulcers 99 (8.1) 59 (7.2) 40 (9.9) 0.125
< 3 full meals/day 133 (10.8) 82 (10.0) 51 (12.6) 0.192
< 3 dietary markers for protein intake 344 (28.0) 202 (24.5) 142 (35.1) < 0.001
< 2 daily portions of fruits or vegetables 161 (13.1) 99 (12.0) 62 (15.3) 0.129
< 5 cups of liquids/day 674 (54.8) 441 (53.5) 233 (57.5) 0.205
Eating dependency 75 (6.1) 31 (3.8) 44 (10.9) < 0.001
Feels malnourished or is uncertain of nutritional condition
203 (16.5) 101 (12.3) 102 (25.2) < 0.001
Considers health status not better compared to peers 235 (19.1) 132 (16.0) 103 (25.4) < 0.001
Mid-arm circumference < 22 cm 43 (3.5) 24 (2.9) 19 (4.7) 0.153
Calf circumference < 31 cm 157 (12.8) 85 (10.3) 72 (17.8) < 0.001
e C
ole
tiv
a,
22(2):575-582,
2017
assessment. In the community-dwelling elderly, the mean is 4.2%, but can be as high as 23.4% in hospitalized elderly patients. However, the risk of malnutrition is prevalent in the community as well as the hospital environment17. The
fre-quency of malnutrition risk in our study (23.3%) was comparable to that reported by Guigoz18
and Cereda17 in reviews of studies that used the
MNA® to evaluate community-dwelling elderly
persons (24 and 27.4%, respectively).
Feldblum et al.19 studied elderly patients up
to 48 hours after hospital admission and found that the risk of malnutrition significantly in-creases risk of hospital admission and length of stay. Moreover, the authors observed that the elderly at risk of malnutrition reported having used more health care services before admission. Amaral et al.2 also pointed out that malnutrition
was common at the time of hospital admission and that the risk of malnutrition appeared to be even more prevalent.
In a study evaluating risk of mortality factors in the elderly patients three months after visiting an emergency department, Gentile et al.20
indi-cated malnutrition as the strongest independent risk factor for predicting short-term mortality.
The group of items on the MNA® that
evalu-ate dietary habits (“number of full meals the pa-tients eats daily”, “consumption of protein foods”, “consumption of fruits and vegetables”, “daily fluid consumption”, “the reasons for any decline in food intake over the previous 3 months” and “mode of feeding”) was indicated as an inde-pendent predictor of mortality in hospitalized elderly21. In our study, three of these items were
associated with hospitalization (“consumption
of protein foods”, “decreased in food intake”, and “mode of feeding”), where two (“consumption of protein foods” and “mode of feeding”) were independently associated.
Bollwein et al.22 found an association between
12 items on the MNA® and diagnosis of frailty.
Among these, eight items were the same as those showing an association with hospitalization in our study (“moderate or severe decrease in food intake in the past three months”, “weight loss of more than 1 kg in the last three months”, “im-paired mobility”, “psychological stress or acute disease in the past three months”, “takes more than three prescription drugs per day”, “self-view of malnutrition or uncertain about nutritional condition”, “self-perception of health not as good as others the same age” and “decreased calf cir-cumference”). It should be noted that malnutri-tion risk is directly associated with frailty in the elderly22,23 and that this in turn is associated with
risk of hospitalization24.
In our study, the only anthropometric mea-sure associate with hospitalization was reduced calf circumference. The calf circumference has a positive correlation with nutritional status in the elderly inpatients and indicates loss of muscle mass25.
Just as we did not find any association of BMI and mid-arm circumference with hospi-talization, Bollwein et al.22 also did not observe
any association of these items with frailty. One explanation for the lack of association between BMI and hospitalization would be the high fre-quency of BMI ≥ 23 kg/m2 of our sample (mean
BMI = 26.4 ± 4.8 kg/m2). Additionally, BMI does
not appear to be a more reliable indicator of
Table 3. Crude and adjusted odds ratio for the association between MNA® items and hospitalization in the last 12 months.
MNA® item Crude OR
(95% CI)
Adjusted OR*
(95% CI) P
Weight loss > 1 kg in 3 months or unknown 0.520 (0.41 – 0.66) 1.524 (1.18 – 1.97) 0.001
Psychological stress or acute disease 0.545 (0.40 – 0.74) 1.593 (1.15 – 2.21) 0.005
> 3 different medications/day 0.528 (0.41 – 0.67) 1.682 (1.31 – 2.17) < 0.001
< 3 dietary markers for protein intake 1.663 (1.28 – 2.15) 1.466 (1.11 – 1.93) 0.006
Eating dependency 0.321 (0.20 – 0.52) 1.853 (1.10 – 3.12) 0.021
Feels malnourished or is uncertain of nutritional condition 0.415 (0.31 – 0.56) 1.670 (1.19 – 2.34) 0.003
Calf circumference <31 cm 0.532 (0.38 – 0.75) 1.526 (1.06 – 2.19) 0.023
R
osa CB
changes in nutritional status of the elderly, since it does not reflect changes in body composition (fat mass, lean body mass and body water) due to aging26. Winter et al.27 observed that even in
the community-dwelling older adults who have an annual health assessment, one in six is at risk of malnourishment, of whom one-third have a BMI of 25 kg/m2 or higher.
On the other hand, mid-arm circumference was found to be associated with risk of mortal-ity in Taiwanese communmortal-ity-dwelling elderly (cut-off point of < 23.5 cm for men and < 22 cm for women)28. Ordoñez et al.29 observed that in
hospitalized elderly, of the four assessment pa-rameters of nutritional status (subjective global assessment, triceps skinfold thickness, BMI and mid-arm circumference), only mid-arm circum-ference showed an association with increased mortality. Similar results were reported by Dent et al.30 who noted an association of smaller
mid-arm circumference with transfer to higher level of care for hospitalized elderly. One possible ex-planation for the absence of association between mid-arm circumference and hospitalization in our study could have been the small number of elderly with this altered parameter (3.5%), caus-ing further unreliability of the estimates.
In our study, the number of daily full meals, daily consumption of fruits, vegetables and fluids also were not associated with hospitalization. As these parameters are self-reported and are part of the information on healthy food available in Bra-zilian basic care (e.g., Ten steps for a healthy diet for elderly persons)31, the answers to these items
could have been overestimated. Closs et al.32
eval-uated the quality of diet of the elderly of South Brazil in a geriatric outpatient clinic of a univer-sity hospital, and found that 74.2% of the elderly had a diet that needed modification, where less than 1.1% of the elderly had a varied diet, and that none of those evaluated had a diet consid-ered healthy. Fisberg et al.33 also noted
inadequa-cy in the intake of nutrients by older Brazilians, affirming that the elderly consumed only a third of the recommended daily amounts of fruits and vegetables.
The main limitation of our study was its cross-sectional character, where we could not determine the causality between malnutrition
risk and hospitalization in the last 12 months. It has been demonstrated that nutritional risk is present in the elderly at the time of hospital admission and often precedes the appearance of acute illness that resulted in hospitalization19,34.
However, it cannot be excluded that hospitaliza-tion itself is a risk factor for nutrihospitaliza-tional decline. Another limitation was the lack of information regarding the hospitalization cause and premor-bid profile.
As a positive point, we highlight the impor-tance of studies on the nutritional status of the elderly assisted in primary care, since the physio-logical and psychosocial changes related to aging can predispose to malnutrition risk1, increasing
costs and demand for health services. The elderly are more often hospitalized and with longer hos-pital stays compared to other age groups35,36.
Be-tween the years 2004 and 2014, the expenditures of the Brazilian Unified Health System (Sistema Único de Saúde - SUS) increased considerably, where the total cost for hospital services grew 61.4% in the age group over 60 years and where the mean cost for hospitalization increased 53.5% in this population36. Therefore, the
moni-toring of life and health conditions of the elderly is essential, especially at primary care, through indicators such as nutritional status8,31.
Brazil has strived to meet the changes caused by the increase in elderly population, making ef-forts to achieve equal access to health services, strengthening SUS with cost-effective strategies, such as the FHS37. However, the rapid population
aging demands that health services be prepared to evaluate the nutritional risk of this age group8.
To be clinically useful, the assessment of nutri-tional status needs to be efficient and to predict adverse outcomes, because they affect the quality of life of the individuals38.
In conclusion, the findings of this study demonstrated the association of malnutrition risk, as well as the majority of single MNA® items,
e C
ole
tiv
a,
22(2):575-582,
2017
References
1. Sousa VMC, Guariento ME. Avaliação do idoso desnu-trido. Rev Bras Clin Med 2009; 7:46-49.
2. Amaral TF, Matos LC, Teixeira MA, Tavares MM, Ál-vares L, Antunes A. Undernutrition and associated factors among hospitalized patients. Clin Nutr 2010; 29(5):580-585.
3. Allard JP, Keller H, Jeejeebhoy KN, Laporte M, Duerk-sen DR, Gramlich L, Payette H, Bernier P, Davidson B, Teterina A, Lou W. Decline in nutritional status is as-sociated with prolonged length of stay in hospitalized patients admitted for 7 days or more: A prospective co-hort study. Clin Nutr 2015; XXX:1-9.
4. Payette H, Coulombe C, Boutier V, Gray-Donald K. Nutrition risk factors for institutionalization in a free-living functionally dependent elderly population. J Clin Epidemiol 2000; 53(6):579-587.
5. Ferreira LS, Amaral TF, Marucci M, Nascimento L, Leb-rão M, Duarte Y. Undernutrition as a major risk factor for death among older Brazilian adults in the commu-nity-dwelling setting: SABE survey. Nutrition 2011; 27(10):1017-1022.
6. Waitzberg DL, Caiaffa WT, Correia MITD. Hospital malnutrition: The Brazilian national survey (IBRA-NUTRI):A study of 4000 patients. Nutrition 2001; 17(7-8):573-580.
7. Vellas B, Villars H, Abellan G, Soto ME, Rolland Y, Gui-goz Y, Morley JE, Chumlea W, Salva A, Rubenstein LZ, Garry P. Overview of the MNA® - Its history and chal-lenges. J Nutr Health Aging 2006; 10(6):456-463. 8. Alvarenga MRM, Oliveira MADC, Faccenda O,
Amen-dola F. Avaliação do risco nutricional em idosos atendi-dos por equipes de saúde da família. Rev da Esc Enferm 2010; 44(4):1046-1051.
9. Mueller C, Compher C, Ellen D. A.S.P.E.N. clinical guidelines: Nutrition screening, assessment, and inter-vention in adults. J Parenter Enter Nutr 2011; 35(1):16-24.
10. Kondrup J, Allison S, Elia M, Vellas B, Plauth M. ES-PEN guidelines for nutrition screening 2002. Clin Nutr 2003; 22(4):415-421.
11. Machado RSP, Coelho MASC, Veras RP. Validity of the portuguese version of the mini nutritional assessment in brazilian elderly. BMC Geriatrics 2015; 15:132. 12. Brasil. Secretaria do Planejamento e Desenvolvimento
Regional do Governo do Estado do Rio Grande do Sul. Fundação de economia e estatística – FEE. [FEE Da-dos Abertos: Demografia, População Total, Agregação geográfica: CoredeS, 2010]. [cited 2015 Feb 23]. Avail-able from: http://dados.fee.tche.br/.
13. Chumlea WC, Roche AF, Steinbaugh ML. Estimating stature from knee height for persons 60 to 90 years of age. J Am Geriatr Soc 1985; 33(2):116-120.
14. Callaway CW, Chumlea WMC, Bouchard C, Himes JH, Lohman TG, Martin AD, Mitchell CD, Mueller WH, Roche AF, Seefeldt VD. Circumferences. In: Lohman TG, Roche AF, Martorell R, editors. Anthropometric standardization reference manual. 15th ed. New York: Human Kinetics Books; 1988. p. 39-54.
15. Boult C, Dowd B, McCaffrey D, Boult L, Hernandez R, Krulewitch H. Screening elders for risk of hospital ad-mission. J Am Geriatr Soc 1993; 41(8):811-817. 16. Pacala J, Boult C, Boult L. Predictive validity of a
ques-tionnaire that identifies older persons at risk for hos-pital admission. J Am Geriatr Soc 1995; 43(4):374-377. Collaborations
R
osa CB
17. Cereda E. Mini Nutritional Assessment. Curr Opin Clin Nutr Metab Care 2012; 15(1):29-41.
18. Guigoz Y. The Mini Nutritional Assessment (MNA) re-view of the literature-What does it tell us? J Nutr Health Aging 2006; 10(6):466-485.
19. Feldblum I, German L, Bilenko N, Shahar A, Enten R, Greenberg D, Harman I, Castel H, Shahar DR. Nutri-tional risk and health care use before and after an acute hospitalization among the elderly. Nutrition 2009; 25(4):415-420.
20. Gentile S, Lacroix O, Durand AC, Cretel E, Alazia M, Sambuc R, Gillaume-Bonin S. Malnutrition: A highly predictive risk factor of short-term mortality in elderly presenting to the emergency department. J Nutr Health Aging 2013; 17(4):290-294.
21. Kagansky N, Berner Y, Koren-Morag N, Perelman L, Knobler H, Levy S. Poor nutritional habits are predic-tors of poor outcome in very old hospitalized patients. Am J Clin Nutr 2005; 82(4):784-791.
22. Bollwein J, Volkert D, Diekmann R, Kaiser MJ, Uter W, Vidal K, Sieber CC, Bauer JM. Nutritional status ac-cording to the Mini Nutritional Assessment (MNA®) and frailty in community dwelling older persons: A close relationship. J Nutr Health Aging 2013; 17(4):351-356.
23. Abellan Van Kan G, Vellas B. Is the Mini Nutritional Assessment an appropriate tool to assess frailty in older adults? J Nutr Health Aging 2011; 15(3):159-161. 24. Perez M, Lourenço RA. Rede FIBRA-RJ: fragilidade e
risco de hospitalização em idosos da cidade do Rio de Janeiro, Brasil. Cad Saude Publica 2013; 29(7):1381-1391.
25. Portero-Mclellan KC, Staudt C, Silva FRF, Delbue Ber-nardi JL, Baston Frenhani P, Leandro Mehri VA. The use of calf circumference measurement as an anthro-pometric tool to monitor nutritional status in elderly inpatients. J Nutr Health Aging 2010; 14(4):266-270. 26. Donini LM, Poggiogalle E, Morrone A, Scardella P,
Piombo L, Neri B, Cava E, Cucinota D, Barbagallo M, Pinto A. Agreement between different versions of MNA. J Nutr Health Aging 2013; 17(4):332-338. 27. Winter J, Flanagan D, Mcnaughton S, Nowson C.
Nu-trition Screening of Older People in a Community. J Nutr Health Aging 2013; 17(4):322-325.
28. Tsai AC, Chang T-L. The effectiveness of BMI, calf cir-cumference and mid-arm circir-cumference in predicting subsequent mortality risk in elderly Taiwanese. Br J Nutr 2011; 105(2):275-281.
29. Ordoñez AM, Schieferdecker MEM, Cestonaro T, Car-doso Neto J, Campos ACL. Nutritional status influenc-es the length of stay and clinical outcominfluenc-es in patients hospitalized in internal medicine wards. Nutr Hosp 2013; 28(4):1313-1320.
30. Dent E, Chapman I, Piantadosi C, Visvanathan R. Nu-tritional screening tools and anthropometric measures associate with hospital discharge outcomes in older people. Australas J Ageing 2015; 34(1):E1-6.
31. Brasil. Ministério da Saúde (MS). Secretaria de Atenção à Saúde. Departamento de Atenção Básica. Envelheci-mento e saúde da pessoa idosa. Brasília: MS; 2006. (Série A. Normas e Manuais Técnicos). Cadernos de Atenção Básica n. 19.
32. Closs VE, Feoli AMP, Gomes I, Schwanke CHA. Healthy eating index of elderly: description and associ-ation with energy, macronutrients and micronutrients intake. Arch Latinoam Nutr 2014; 64(1):34-41. 33. Fisberg RM, Marchioni DML, Castro MA, Verly-Junior
E, Araújo MC, Bezerra IN, Pereira RV, Sichieri R. In-gestão inadequada de nutrientes na população de ido-sos do Brasil: Inquérito Nacional de Alimentação 2008-2009. Rev Saude Publica 2013; 47(Supl. 1):S222-230. 34. Mowé M, Bøhmer T, Kindt E. Reduced nutritional
sta-tus in an elderly population (> 70 y) is probable before disease and possibly contributes to the development of disease. Am J Clin Nutr 1994; 59(2):317-324.
35. Góis ALB, Veras RP. Informações sobre a morbidade hospitalar em idosos nas internações do Sistema Único de Saúde do Brasil. Cien Saude Colet 2010; 15(6):2859-2869.
36. Brasil. Ministério da Saúde. [Sistema de Informações Hospitalares do Sistema Único de Saúde – SIHSUS]. Assistência à Saúde: Produção Hospitalar por local de residência. [cited 2015 Jul 01]. Available from: http:// tabnet.datasus.gov.br/cgi/deftohtm.exe?sih/cnv/qrRS. def.
37. Macinko J, Harris MJ. Brazil’s Family Health Strategy - Delivering Community-Based Primary Care in a Uni-versal Health System. N Engl J Med 2015; 372(23):2177-2181.
38. Jeejeebhoy KN, Keller H, Gramlich L, Allard JP, Laporte M, Duerksen DR, Payette H, Bernier P, Vesnaver E, Da-vidson B, Teterina A, Lou W. Nutritional assessment : comparison of clinical assessment and objective vari-ables for the prediction of length of hospital stay and readmission. Am J Clin Nutr 2015; 101(5):956-965.
Artigo apresentado em 31/03/2016 Aprovado em 21/07/2016