ABSTRACT
http://dx.doi.org/10.1590/1678-775720140003
Perceptions of brachyfacial, mesofacial and
dolichofacial individuals with regard to the buccal
corridor in different facial types
Matheus Melo PITHON, Kayure Rocha da MATA, Karina Silva ROCHA, Brenda do Nascimento COSTA, Fernando NEVES, George Caique Gouveia BARBOSA, Raildo da Silva COQUEIRO
Departament of Health I, Southwest Bahia State University - UESB, Jequié, Bahia, Brazil.
Corresponding address: Matheus Melo Pithon - Centro Odontomédico Dr. Altamirando da Costa Lima - Av. Otávio Santos, 395, sala 705 - Bairro Recreio - 45020-750 - Vitória da Conquista - Bahia - Brazil - e-mail: [email protected]
6XEPLWWHG0DUFK0RGL¿FDWLRQ-XQH$FFHSWHG-XQH
O
bjective: Evaluate the esthetic perception and attractiveness of the smile with regard to the buccal corridor in different facial types by brachyfacial, mesofacial and dolichofacial individuals. Material and Methods: The image of a smiling individual with a mesofacial corridors (2%, 10%, 15%, 22% and 28%). To achieve this effect, a photo editing software was used (Adobe Photoshop, Adobe Systems Inc, San Francisco, CA, EUA). The images were submitted to evaluators with brachyfacial, mesofacial and dolichofacial types of faces, who evaluated the degree of esthetic perception and attractiveness by means of a ! "#$ Results: Brachyfacial individuals perceived mesofacial and dolichofacial types of faces with buccal corridor of 2% as more attractive. Mesofacial individuals perceived mesofacial and dolichofacial types of faces with buccal corridor of 2%, 10% and 15% as more attractive. Dolichofacial individuals perceived the mesofacial type of face with buccal corridor of 2% as more attractive. Evaluators of the female sex generally attributed higher scores than the male evaluators. Conclusion: To achieve an enhanced esthetic smile it is necessary to observe the patient’s facial type. The preference for narrow buccal corridors is an esthetic characteristic preferred by men and women, and wide buccal corridors are less attractive.Keywords: Orthodontic treatment. Esthetics. Orthodontics.
INTRODUCTION
A balanced and attractive smile is a primordial treatment objective of modern orthodontic therapy4,12,13,15,16,18. Dentofacial appearance is one of
the main determinants of physical attractiveness1,8.
During interpersonal interaction, individuals’ focus is mainly centered on the other person’s eyes and mouth, with little time spent on the other facial characteristics5. In the opinion of the public, the smile
appears in second place, losing out only to the eyes as the most important feature in facial attractiveness8.
Understanding the attractiveness of the smile and the buccal corridor space is important, since it provides a hierarchy of esthetic preference10,11.
In the smile, bilateral spaces appear between the
vestibular surface of the maxillary posterior teeth and the internal mucosa of the cheek, denominated buccal corridor17. Few studies have related the
MATERIAL AND METHODS
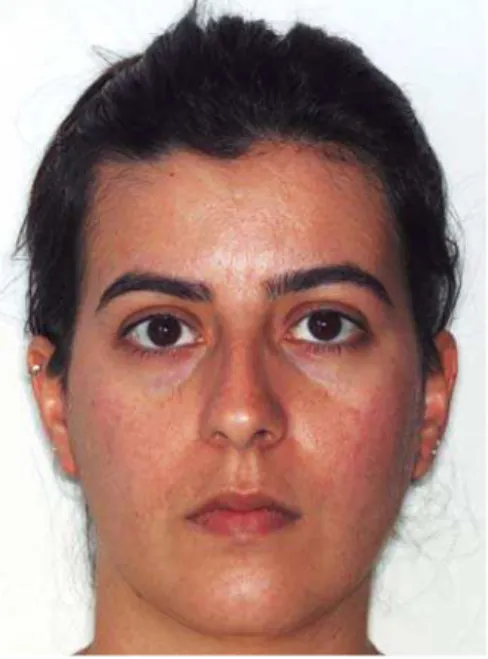
! based on a subjective analysis of the problem (Figure 1). The individual received previous orthodontic treatment, in which he presented complete dentition
and no rotation in the anterior region.The individual signed an informed consent form stating that he * in the present study.
A front view photograph was taken with a digital camera (Canon Rebel XTI, Tokyo, Japan), with a standardized beam-focus distance.After the image was obtained, a photo editing software (Adobe Photoshop, Adobe Systems Inc, San Francisco, CA, EUA) was used for removal of small imperfections and & + ' two other facial images were obtained (brachyfacial and dolichofacial). Five images were produced for
' :
narrow (buccal corridor 2%), medium-narrow (buccal corridor 10%), medium (buccal corridor 15%), medium-wide (buccal corridor 22%), and wide (buccal corridor 28%).
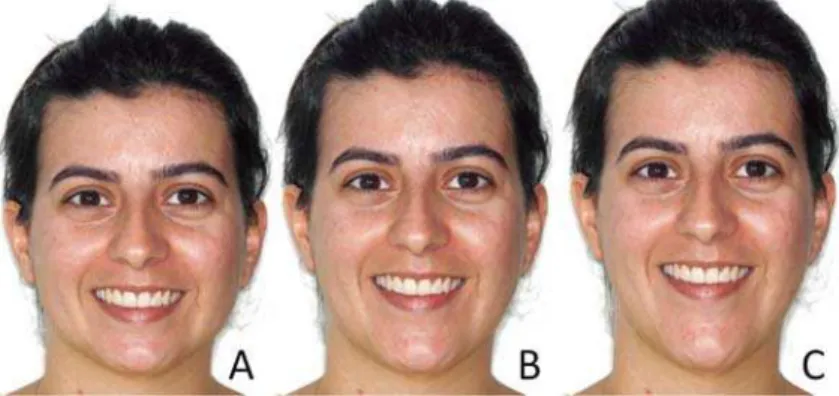
The images were shown by means of the // 9 ; <' =' !' >?!@ G evaluation 15 images (5 images X 3 facial types) were randomly organized and numbered from 1 to 15; the presentation time was 10 seconds for each photo (Figure 2). In the second stage of
evaluation the images with the same buccal corridor
measurement and with the three different facial types (A-brachyfacial; B-mesofacial; C-dolichofacial)
Figure 1- Initial frontal picture without any alteration. The patient signed informed consent authorizing the publication of these pictures.
Figure 2-
were grouped in a single slide, totaling 5 slides. The slides were numbered from 1 to 5 and organized in the following buccal corridor sequence: 15%, 28%, 2%, 10% and 22% (Figure 3). In this category the evaluators had to respond whether they were able to note the difference between the images; which was the image they liked most, and which they liked least; and then give scores to each image. The presentation time for each image was 45 seconds. The evaluators could not return to previous images in any of the categories.
A 70 mm long visual analog scale (VAS) was used to evaluate attractiveness. Numbered blocks were connected to the scale printed on white paper.The term “not very attractive” was printed on the left side of the scale and “attractive” on the right.
The image evaluations were performed by three groups of dental students (brachyfacial, mesofacial and dolichofacial type of face), who were previously Group (A) was made up of 50 evaluators with a brachyfacial type of face, Group (B) 50 evaluators with a mesofacial type of face and Group (C) 50 evaluators with a dolichofacial type of face. The evaluators had a mean age of 21.5 years. Before the study began, the sample size was calculated, showing the need to perform the study with a sample ranging from 42 to 65 evaluators. In view of this, it was decided to conduct the study with 50 individuals per group, which would be a median number in that interval.
All the evaluators were instructed to judge the attractiveness of the smiles by scores on the VAS.
The data were recorded in a table (Microsoft ;<'=' '>?!@ statistical analysis by the Exact Fisher, Mann-Whitney and Kruskal-Wallis tests, Analysis of Variance and the Chi-square test. established at 5%.
Statistical procedure
The scores given to each image were compared by means of the Kruskal-Wallis test and a comparison
between pairs was performed using the Mann-Whitney test.The frequencies of the responses given by the evaluators were compared by means of the Chi-square test. In cases in which the expected Q 9Y#@'+Z[
was used. #$
(α=0.05).The data were analyzed in the statistical
program BioEstat (version 5.0, Belém, Pará, Brazil).
RESULTS
Of the 150 participants in the study, 56 (37.3%) were male and 94 (62.7%), female. The evaluators with different facial types differed in their judgment about the mesofacial and dolichofacial types of face with buccal corridor of 2%, brachyfacial with buccal corridor of 10% and brachyfacial with buccal corridor of 22% (Table 1). For the other types of face and
In the analysis of the evaluators with the brachyfacial type of face, there was a difference between the sexes only with respect to the brachyfacial type of face with a buccal corridor of 2% (Table 2). In the analysis of the evaluators with a mesofacial type of face, there was difference between the sexes with respect to the brachyfacial type of face with buccal corridors of 10% and 22%, mesofacial type with buccal corridor of 2% and dolichofacial type with buccal corridors of 2%, 15% and 22% (Table 1). The men and women with a dolichofacial pattern evaluated the buccal corridors of the three types of face analogously.
Figure 4 shows a graphic illustration of the means of scores given by evaluators with different facial patterns on the visual analog scale. The individuals with a brachyfacial type of face demonstrated that they found the mesofacial and dolichofacial types with a buccal corridor of 2% more attractive, and evaluated the buccal corridor of 10% as the most attractive for their own facial pattern (Figure 2A). The individuals with the mesofacial pattern demonstrated that they perceived mesofacial and dolichofacial
Buccal Corridor Size
Facial type in the image
Facial type of the evaluator
Mean Standard
Deviation
p-Value*
2%
Brachyfacial
Brachyfacial Mesofacial Dolichofacial
4.10 3.54 3.67
1.50 1.73 1.79
0.234
Mesofacial
Brachyfacial Mesofacial Dolichofacial
5.45a 4.47b 5.19ab
1.28 1.76 1.43
0.030
Dolichofacial
Brachyfacial Mesofacial Dolichofacial
5.39a 4.24b 4.37b
1.43 1.65 1.73
0.001
10%
Brachyfacial
Brachyfacial Mesofacial Dolichofacial
4.49a 3.81b 3.43b
1.60 1.51 1.81
0.009
Mesofacial
Brachyfacial Mesofacial Dolichofacial
4.35 4.37 3.81
1.34 1.40 1.57
0.131
Dolichofacial
Brachyfacial Mesofacial Dolichofacial
4.76 4.13 4.25
1.47 1.70 1.74
0.160
15%
Brachyfacial
Brachyfacial Mesofacial Dolichofacial
3.62 3.43 3.40
1.42 1.47 1.79
0.761
Mesofacial
Brachyfacial Mesofacial Dolichofacial
4.45 4.28 3.72
1.35 1.60 1.73
0.082
Dolichofacial
Brachyfacial Mesofacial Dolichofacial
4.27 3.99 3.78
1.32 1.45 1.86
0.449
22%
Brachyfacial
Brachyfacial Mesofacial Dolichofacial
3.36a 3.03ab
2.54b
1.55 1.44 1.59
0.035
Mesofacial
Brachyfacial Mesofacial Dolichofacial
3.47 3.85 3.58
1.44 1.39 1.41
0.336
Dolichofacial
Brachyfacial Mesofacial Dolichofacial
3.64 3.50 3.10
1.58 1.55 1.52
0.248
28%
Brachyfacial
Brachyfacial Mesofacial Dolichofacial
2.12 2.23 1.88
1.26 1.25 1.56
0.079
Mesofacial
Brachyfacial Mesofacial Dolichofacial
2.21 2.53 2.25
1.62 1.41 1.51
0.197
Dolichofacial
Brachyfacial Mesofacial Dolichofacial
3.02 3.11 2.55
1.35 1.35 1.38
0.082
Table 1- !"
*Kruskal-Wallis Test
Buccal Corridor Size
Facial type in the image
Facial type of the evaluator
Mean Standard Deviation p-Value* 2% Brachyfacial Brachyfacial Mesofacial Dolichofacial 3.21 3.34 3.80 4.44 3.66 3.55 0.009 0.618 0.598 Mesofacial Brachyfacial Mesofacial Dolichofacial 5.12 3.67 5.05 5.58 4.92 5.33 0.177 0.020 0.554 Dolichofacial Brachyfacial Mesofacial Dolichofacial 4.96 3.51 4.41 5.55 4.65 4.33 0.138 0.019 0.799 10% Brachyfacial Brachyfacial Mesofacial Dolichofacial 4.11 3.14 3.36 4.64 4.18 3.50 0.302 0.041 0.741 Mesofacial Brachyfacial Mesofacial Dolichofacial 3.93 4.10 3.78 4.51 4.52 3.84 0.147 0.353 0.922 Dolichofacial Brachyfacial Mesofacial Dolichofacial 4.64 3.64 4.08 4.81 4.40 4.40 0.151 0.125 0.513 15% Brachyfacial Brachyfacial Mesofacial Dolichofacial 3.25 3.14 3.29 3.76 3.59 3.50 0.276 0.503 0.689 Mesofacial Brachyfacial Mesofacial Dolichofacial 3.96 3.82 3.73 4.64 4.53 3.72 0.163 0.166 0.930 Dolichofacial Brachyfacial Mesofacial Dolichofacial 3.96 3.39 3.72 4.39 4.33 3.84 0.281 0.044 0.845 22% Brachyfacial Brachyfacial Mesofacial Dolichofacial 3.18 2.42 2.71 3.42 3.37 2.39 0.496 0.026 0.453 Mesofacial Brachyfacial Mesofacial Dolichofacial 3.07 3.62 3.59 3.63 3.98 3.58 0.247 0.519 0.790 Dolichofacial Brachyfacial Mesofacial Dolichofacial 3.18 2.87 3.11 3.82 3.85 3.08 0.139 0.047 0.945 28% Brachyfacial Brachyfacial Mesofacial Dolichofacial 2.18 1.78 2.19 2.10 2.48 1.59 0.894 0.077 0.246 Mesofacial Brachyfacial Mesofacial Dolichofacial 2.57 2.29 2.40 2.07 2.67 2.11 0.592 0.141 0.585 Dolichofacial Brachyfacial Mesofacial Dolichofacial 2.57 2.73 2.62 3.19 3.32 2.48 0.100 0.113 0.784
Table 2- Mean of scores given by evaluators to the facial type of the image according to the buccal corridor size, evaluator’s facial type and sex
Images Replies Facial type of the evaluator p-Value
Brachyfacial Mesofacial Dolichofacial
Image 1 Perceive differences Yes No 47 (94.0%) 3 (6.0%) 49 (98.0%) 1 (2.0%) 48 (96.0%)
2 (4.0%) 0.871
‡
Photo I like the most* A B C 11 (23.4%) 9 (19.1%) 27 (57.4%) 4 (8.2%) 7 (14.3%) 38 (77.6%) 7 (14.6%) 6 (12.5%) 35 (72.9%) 0.205†
Photo I like the least* A B C 19 (40.4%) 20 (42.6%) 8 (17.0%) 25 (51.0%) 22 (44.9%) 2 (4.1%) 22 (45.8%) 22 (45.8%) 4 (8.3%) 0.329‡ Image 2 Perceive differences Yes No 45 (90.0%) 5 (10.0%) 49 (98.0%) 1 (2.0%) 46 (92.0%)
4 (8.0%) 0.345
‡
Photo I like the most* A B C 6 (13.3%) 8 (17.8%) 31 (68.9%) 7 (14.3%) 9 (18.4%) 33 (67.3%) 12 (26.1%) 8 (17.4%) 26 (56.5%) 0.513†
Photo I like the least* A B C 23 (51.1%) 20 (44.4%) 2 (4.4%) 21 (42.9%) 26 (53.1%) 2 (4.1%) 18 (39.1%) 22 (47.8%) 6 (13.0%) 0.407‡ Image 3 Perceive differences Yes No 46 (92.0%) 4 (8.0%) 46 (92.0%) 4 (8.0%) 47 (94.0%)
3 (6.0%) 1.000
‡
Photo I like the most* A B C 8 (17.4%) 14 (30.4%) 24 (52.2%) 10 (21.7%) 5 (10.9%) 31 (67.4%) 8 (17.0%) 13 (27.7%) 26 (55.3%) 0.211†
Photo I like the least* A B C 27 (58.7%) 13 (28.3%) 6 (13.0%) 17 (37.0%) 25 (54.3%) 4 (8.7%) 17 (36.2%) 20 (42.6%) 10 (21.3%) 0.043† Image 4 Perceive differences Yes No 47 (94.0%) 3 (6.0%) 46 (92.0%) 4 (8.0%) 47 (94.0%)
3 (6.0%) 1.000
‡
Photo I like the most* A B C 6 (12.8%) 13 (27.7%) 28 (59.6%) 5 (10.9%) 6 (13.0%) 35 (76.1%) 6 (12.8%) 6 (12.8%) 35 (74.5%) 0.287†
Photo I like the least* A B C 21 (44.7%) 21 (44.7%) 5 (10.6%) 24 (52.2%) 20 (43.5%) 2 (4.3%) 27 (57.4%) 16 (34.0%) 4 (8.5%) 0.594‡ Image 5 Perceive differences Yes No 41 (82.0%) 9 (18.0%) 46 (92.0%) 4 (8.0%) 47 (94.0%)
3 (6.0%) 0.114
†
Photo I like the most* A B C 8 (19.5%) 7 (17.1%) 26 (63.4%) 8 (17.4%) 9 (19.6%) 29 (63.0%) 6 (12.8%) 13 (27.7%) 28 (59.6%) 0.738†
Photo I like the least* A B C 16 (39.0%) 24 (58.5%) 1 (2.4%) 22 (47.8%) 19 (41.3%) 5 (10.9%) 22 (46.8%) 20 (42.6%) 5 (10.6%) 0.334‡
Table 3- Perception of the participants regarding differences and their preferences in relation to the images presented
Figure 4- Means of scores on the visual analog scale, given by volunteers with the brachyfacial (A), mesofacial (B) and dolichofacial (C) patterns, according to the buccal corridor size and type of face
types of faces with buccal corridor of 2%, 10% and 15% to be more attractive. The individuals with a dolichofacial pattern demonstrated that they found the mesofacial type of face with a buccal corridor of 2% more attractive, and evaluated the buccal corridor of 2% and 10% as the most attractive for their own facial pattern (Figure 2C).
Table 3 presents the perception of the evaluators with respect to the differences and preferences for the sets of images presented. The data of all the images showed that the large majority of the participants were able to notice the difference between the photos ' among the evaluators with different facial types. Only for image 3 (buccal corridor of 2%), as regards the least preferred photo, there was statistical difference between the groups of evaluators, with the larger proportion of evaluators with a brachyfacial pattern liking photo A (brachyfacial) the least, while the evaluators with mesofacial and dolichofacial patterns liked photos B (mesofacial) and C (dolichofacial) the least.
DISCUSSION
The aim of the present study was to analyze the & attractiveness of the smile of individuals with different facial types. A large portion of the authors who have investigated the subjects did not divide the evaluators according to their facial pattern3,5-7,9,11. Other related
* & * of buccal corridor only in short and long faces20.
Habitually only the image of the mouth is used as an evaluation parameter2,10,11,17.Some authors have used front view photos of the entire face for this type of study9,19.For Sachdeva19 (2012), the buccal
& evaluation of the smile, with other factors being more important, such as the arrangement of the teeth, tooth color, gingival architecture, gingival exposure, and lip thickness.
In the literature, some studies have not considered the entire face, which may interfere in the results, since they do not evaluate the facial pattern and other elements of the face11,17.A limitation of this study is the use of a single image of an individual of the female sex, as it has been demonstrated that the sex of the individual in the photo affects the perception of the attractiveness of the smile3; however, the
unisex characteristics of the chosen individual were important for minimal interference in the evaluation. The changes were made with the use of photo editing software, which was shown to be a most useful image manipulation method11,14,18,20. To exhibit the images, a slide presentation software was used, because of the possibility of obtaining a larger number of evaluators in a shorter time interval. The exhibition time of each slide was compatible with the time used in other studies20. The use of a black background between
the slides served to detach the evaluator from the & evaluation of the next image. The evaluators were not allowed to go back to images already evaluated so that there would be no comparison between them. * determine the degree of interference of this factor in the esthetics of the smile9,20.
The esthetic value of each image was judged by means of a visual analog scale (VAS). scale was designed for minimal restrictions and more freedom to express a style of personal response in a linear manner10,11. The choice of the 70 mm VAS scale was because it is easy to understand and to evaluate each image in a subjective manner, from the least to the most attractive.
and the images were divided into brachyfacial, mesofacial and dolichofacial patterns to verify whether the evaluator’s facial pattern would have an &_ In contrast to the study of Zange, et al.20 (2011), men were more critical
than women, and attributed lower scores, except for the evaluators with dolichofacial patterns, who attributed analogous scores. In a study conducted by Abu Alhaija, et al.19<{{@'
pleasant type in the three facial types among all the groups of evaluators, similar to the results described by Moore, et al.9(2005).It was found that a wide
buccal corridor was considered less attractive than a narrow one1,18, considering that irrespective of
the evaluator’s facial type, the highest scores were attributed to the sizes of 2% and 10%, followed by 15 and 22% while the buccal corridor of 28% obtained the lowest scores.
In the individual evaluation of the images, the brachyfacial evaluators assessed the buccal corridor of 10% as the most esthetically pleasant for their own facial type; however, they showed that they perceived the buccal corridor of 2% as more attractive in the mesofacial and dolichofacial types of faces, revealing greater preference for these types of faces. The evaluators with a mesofacial pattern revealed that they found buccal corridors of 2%, 10% and 15% attractive both for their own facial type and for the dolichofacial type, thus showing that they did not * of buccal core very attractive. The evaluators with a dolichofacial pattern preferred the buccal corridors of 2% and 10% for their own facial type; however, they revealed that they found the mesofacial pattern with a buccal corridor of 2% to be the most attractive.
When analyzing the set of images, the majority of the evaluators in the three groups noted differences with respect to the three types of faces. In this the evaluators with different facial types, except for the slide containing buccal corridors of 2%, for the larger proportion of those with a brachyfacial type of face liked the brachyfacial image the least, thus revealing that they found their own facial pattern with this size of buccal corridor less attractive.
Further studies should be conducted on the subject, with a view to evaluating, by means of ' & of the buccal corridor on the esthetics of the smile, particularly in different facial types.
CONCLUSION
By conducting this study, it could be concluded that:
The individuals with a brachyfacial type of face demonstrated that they found the mesofacial and dolichofacial types with a buccal corridor of 2% more attractive, and evaluated the buccal corridor of 10% as the most attractive for their own facial pattern.
Individuals with a mesofacial type of face demonstrated that they perceived mesofacial and dolichofacial types of faces with buccal corridors of 2%, 10 % and 15% to be more attractive.
I n d i v i d u a l s w i t h a d o l i c h o f a c i a l p a t t e r n demonstrated that they found the mesofacial type of face with a buccal corridor of 2% more attractive, and
evaluated the buccal corridor of 2% and 10% as the most attractive for their own facial pattern.
REFERENCES
1- Abu Alhaija ES, Al-Shamsi NO, Al-Khateeb S. Perceptions of Jordanian laypersons and dental professionals to altered smile aesthetics. Eur J Orthod. 2011;33:450-6.
2- Ackerman MB, Ackerman JL. Smile analysis and design in the digital era. J Clin Orthod. 2002;36:221-36.
3- Al-Ramahi SC, Al-Mulla AA. Evaluation of buccal corridor in posed smile for Iraqi adults sample with Class I normal occlusion. J Bagh Coll Dentistry. 2010;22:91-7.
4- Cavalcante JS, Castellucci e Barbosa M, Sobral MC. Evaluation of the susceptibility to pigmentation of orthodontic esthetic elastomeric ligatures. Dental Press J Orthod. 2012;18:20.e21-8.
#G}'~ '! & corridors on smile esthetics between Koreans and Japanese. Orthod Waves. 2009;68:166-70.
6- Ioi H, Nakata S, Counts AL. Effects of buccal corridors on smile esthetics in Japanese. Angle Orthod. 2009;79:628-33.
7- Janson G, Branco NC, Fernandes TM, Sathler R, Garib D, Lauris = G& ' ' corridor and smile arc on smile attractiveness. Angle Orthod. 2011;81:153-61.
8- Martin AJ, Buschang PH, Boley JC, Taylor RW, McKinney TW. The impact of buccal corridors on smile attractiveness. Eur J Orthod. 2007;29:530-7.
9- Moore T, Southard KA, Casko JS, Qian F, Southard TE. Buccal corridors and smile esthetics. Am J Orthod Dentofacial Orthop. 2005;127:208-13; quiz 261.
10- Parekh S, Fields HW, Beck FM, Rosenstiel SF. The acceptability of variations in smile arc and buccal corridor space. Orthod Craniofac Res. 2007;10:15-21.
11- Parekh SM, Fields HW, Beck M, Rosenstiel SF. Attractiveness of variations in the smile arc and buccal corridor space as judged by orthodontists and laymen. Angle Orthod. 2006;76:557-63. 12- Pithon MM, Bastos GW, Miranda NS, Sampaio T, Ribeiro TP, Nascimento LE, et al. Esthetic perception of black spaces between maxillary central incisors by different age groups. Am J Orthod Dentofacial Orthop. 2013;143:371-5.
13- Pithon MM, Santos AM, Campos MS, Couto FS, Santos AF, Coqueiro RS, et al. Perception of laypersons and dental professionals and students as regards the aesthetic impact of gingival plastic surgery. Eur J Orthod. 2014;36:173-8.
14- Pithon MM, Santos AM, Couto FS, Silva Coqueiro R, Freitas LM, Souza RA, et al. Perception of the esthetic impact of mandibular incisor extraction treatment on laypersons, dental professionals, and dental students. Angle Orthod. 2012;82:732-8.
15- Pithon MM, Santos AM, Viana de Andrade AC, Santos EM, Couto FS, Silva Coqueiro R. Perception of the esthetic impact of gingival smile on laypersons, dental professionals, and dental students. Oral Surg Oral Med Oral Pathol Oral Radiol. 2013;115:448-54.
16- Pithon MM, Silva IS, Almeida IO, Nery MS, Souza ML, Barbosa ' / between white and black evaluators. Angle Orthod. 2014;84:231-8. {=>' '/!'!>& negative space in the buccal corridor during smiling. Angle Orthod. 2006;76:198-203.
18- Roden-Johnson D, Gallerano R, English J. The effects of buccal corridor spaces and arch form on smile esthetics. Am J Orthod Dentofacial Orthop. 2005;127:343-50.
19- Sachdeva K, Singla A, Mahanjan V, Jaj HS, Negi A. Esthetic and smile characteristics at rest and during smiling. J Ind Orthod Soc. 2012;46:17-25.