ABSTRACT:Objective: In order to identify intraurban diferentials, the prevalence of major protection and risk factors for non communicable chronic diseases were analyzed in nine health districts of Belo Horizonte, Minas Gerais, Brazil. Methods: Analysis of data from a telephone survey conducted with 2,000 adults in Belo Horizonte, in 2010, using the average linkage method for cluster analysis among the health districts, using sociodemographic variables (education, race and marital status). The study compared the prevalence of risk factors for non communicable diseases among the health districts. Results: Four clusters were identiied. The best socio-demographic indicators were found in cluster 4 (South Central health district), which also showed a higher prevalence of protective factors such as higher consumption of fruits and vegetables, higher frequency of physical activity practice in the free time, use of ultraviolet protection, higher proportion of ex-smokers, and lower prevalence of whole milk and high-fat meat consumption. As a risk factor, cluster 4 showed a higher proportion of alcohol abuse. Cluster 1, with the worst socio-demographic indicators, concentrated more risk factors such as consumption of whole milk, low regular consumption of fruit and vegetables, and lower practice of physical activity in the free time. The most frequent protective indicators in cluster 1 were the regular consumption of beans, having breakfast at home, and lower alcohol abuse. Conclusion: Intra-urban diferences were found in the distribution of risk and protection factors or non transmissible diseases, these diferences can support planning aimed at actions for greater equity in health.
Keywords: Risk factors. Health Surveillance. Interview. Health inequalities. Health promotion.
Inequities in intraurban areas in the distribution
of risk factors for non communicable diseases,
Belo Horizonte, 2010
Desigualdades intraurbanas na distribuição dos fatores de
risco para doenças crônicas não transmissíveis, Belo Horizonte, 2010
Deborah Carvalho MaltaI,II, Regina Ivata Tomie BernalIII, Maria Cristina de Mattos AlmeidaIV,
Lenice Harumi IshitaniIV, Anne Marielle GirodoIV, Lucia Maria Miana Mattos PaixãoIV, Maria
Tereza da Costa OliveiraIV, Fabiano Geraldo Pimenta JuniorIV, Jarbas Barbosa da Silva JúniorI ORIGINAL ARTICLE / ARTIGO ORIGINAL
IDepartment of Non Communicable Disease of Surveillance and Health Promotion, Secretariat of Health Surveillance, Ministry
of Health – Brasília (DF), Brazil.
IIUniversidade Federal de Minas Gerais – Belo Horizonte (MG), Brazil.
IIISchool of Public health, Universidade de São Paulo – São Paulo (SP), Brazil. IVMuncipal Secretariat of Health of Belo Horizonte – Belo Horizonte (MG), Brazil.
Corresponding author: Deborah Carvalho Malta. Departamento de Vigilância de Doenças e Agravos Não Transmissíveis e Promoção
da Saúde, Secretaria de Vigilância em Saúde, Ministério da Saúde. SAF Sul, Trecho 2, Lote 5/6, Torre I, Edifício Premium, Sala 14, Térreo, CEP: 70070-600, Brasília, DF, Brasil. E-mail: deborah.malta@saude.gov.br
INTRODUCTION
Chronic Non Communicable Diseases (CNCD) are the main causes of death in the world, and have generated a high number of premature deaths, loss of quality of life and high level of limitation in work and leisure activities1. In Brazil, CNCDs were responsible, in 2007, for
72% of the total of deaths, especially diseases of the circulatory system, neoplasms, chronic respiratory diseases and diabetes2.
A small group of risk factors responds for most of the deaths caused by CNCDs and by a substantial fraction of disease loads due to these diseases. Among these factors, smoking, excessive consumption of alcohol, inadequate diets and physical inactivity stand out1,2.
There is strong evidence correlating social determinants, such as education, occupation, income, gender and ethnicity, with the prevalence of CNCDs and risk factors3,4.
The analysis of the distribution of CNCDs and their risk factors indicates inequities, which mostly afects mid and low-income countries1, low schooling and income populations2,5 and
vulnerable populations6. The CNDC epidemic has mostly afected people with low income,
since they are more exposed to risk factors and have less access to health services1,4.
RESUMO:Objetivo: Visando identiicar diferenciais intraurbanos, foram analisadas prevalências dos principais fatores de risco e proteção para doenças crônicas não transmissíveis nos nove distritos sanitários de Belo Horizonte, Minas Gerais. Métodos: Análise dos dados de inquérito telefônico realizado com 2.000 adultos em Belo Horizonte em 2010, empregando-se average linkage para análise de clusters entre os distritos sanitários, com base em variáveis sociodemográicas (escolaridade, cor da pele e estado civil). O estudo comparou as prevalências dos fatores de risco para doenças crônicas não transmissíveis entre os distritos sanitários. Resultados: Foram identiicados quatro clusters. O cluster 4 (distrito sanitário Centro Sul) apresentou as melhores condições sociodemográicas, além de maior prevalência de fatores de proteção, como maior consumo de frutas, legumes e verduras, maior frequência de atividade física no tempo livre, uso de proteção de raios ultravioleta, maior proporção de ex-fumantes e menor prevalência de consumo de leite com gordura integral e carne com gordura aparente. Como fator de risco, o cluster 4 apresentou maior proporção de consumo abusivo de álcool. O cluster 1, com piores indicadores sociodemográicos, concentrou mais fatores de risco, como maior consumo de leite com gordura, baixo consumo de frutas, legumes e verduras regular e menos atividade física no tempo livre. Os indicadores de proteção mais frequentes no cluster 1 foram: consumo regular de feijão, café da manhã em casa e menor consumo abusivo de álcool. Conclusão: Foram encontradas diferenças intraurbanas na distribuição dos fatores de risco e proteção para doenças crônicas não transmissíveis, que podem apoiar o planejamento visando ações na busca de maior equidade em saúde.
Family expenses with CNCDs reduce the availability of resources for needs such as food, housing, education, among others. This creates a vicious circle and increases the poverty status of families3,7. Therefore, they have an economic impact on families, communities
and the society in general, thus worsening inequities and increasing poverty7. In Brazil, it is
estimated that CNCDs can afect around 1% of the GDP3.
The approaches of descriptive epidemiology try to analyze the distribution patterns of health events and risk factors that afect diferent segments of populations in various spaces. Therefore, it enables to identify “diferences” that can be seen as incidence, prevalence of diseases, risk factors and other health indicators. The inding regarding these “diferences” leads to the development of hypotheses, epidemiological analyses, decisions and interventions8,9.
Studies have indicated heterogeneity among regions10, cities and also inside the urban space,
in the distribution of child mortality9,10, in the diversity of the distribution of risk factors, in
health indicators among the elderly11, among others.
The analysis of health conditions that are territorially referenced makes it possible to show intraurban inequities. Therefore, the conception of space begins to be understood not only in an ecological, natural or administrative dimension, but as the social space that is historically constituted as an expression of social transformations and speciic social forms of occupation8,9,12. These territorial analyses may support health promotion policies addressed
to more vulnerable groups and regions.
The Telephone-based Surveillance of Risk and Protective Factors for Chronic Diseases (VIGITEL), conducted by the Ministry of Health, has monitored risk factors in the Brazilian population and, in 2010, it was prepared to represent the nine sanitary districts (SD) in the city of Belo Horizonte, Minas Gerais.
In order to identify intraurban diferentials, prevalence rates of the main risk and protective factors for CNCDs in the nine SD, or health administrative regions, were analyzed in Belo Horizonte, Minas Gerais.
So, the intention is to contribute with the understanding of regional inequities and with the improvement of local planning to face these diseases.
METHODOLOGY
The study population was composed of adult inhabitants (18 years old or more) of households in the city of Belo Horizonte, Minas Gerais, with at least one landline in 2010. The sampling size was estimated in about 2,000 interviews, which would be suicient to estimate the prevalence with error between 2 and 3%13.
Replicas were used until the performance of 2,000 interviews. This procedure aims to facilitate operational tasks, including the substitution of commercial lines, those that were out of service, non-existing and refusals. For each eligible line, after their users agreed to participate in the study, individuals aged 18 years old or more living in the household were numbered, and, afterwards, they were raled for interview. Then, the VIGITEL questionnaire was applied, which approaches themes such as diet, physical activities, use of tobacco, alcohol, reported morbidity, preventive examinations, among others14.
The coverage rate of households with landlines was estimated in 76%, in Belo Horizonte15,
and so post-stratification weights were used for correction. Weights are the result of the multiplication of three weighting factors: (a) inverse of the number of landlines in the household of the interviewee; (b) number of adults in the household of the interviewee; (c) post-stratiication weight, which aims at balancing the sociodemographic composition of the sample of adults analyzed by VIGITEL in each city, distributed in 36 categories resulting from stratiication according to sex (male, female), age groups (18 – 24, 25 – 34, 35 – 44, 45 – 54, 55 – 64, 65 or older) and schooling (0 – 8, 9 – 11, 12 or more years). More details about the methodology used by VIGITEL can be consulted in other publications14.
This study adopted the population of the National Household Sample Survey (PNAD) 200815, to correct for estimation bias caused by the exclusion of households without landlines.
Data were analyzed by the software Stata116. The raled sample was proportional to
the number of landlines per SD, conirmed by the homogeneity test17.
In order to identify homogeneous groups between regionals, the hierarchical cluster analysis was employed18 by the method average linkage. Several demographic variables
were used (schooling, skin color, marital status, number of inhabitants in the household), and SD clusters were identiied.
The estimates of the variables coming from the 2010 survey in Belo Horizonte were presented in proportion (%), by SD, in order to compare the diferences between the SDs in the capitals.
The analyzed risk factors were: smokers, former smokers, passive smokers (report of inhaling cigarette smoke from another individual at home or at work); excessive weight (body mass index ≥ 25 kg/m2); obesity (body mass index ≥ 30 kg/m2); intake of meat with visible
portions of FVG for ive days a week or more); recommended FGV intake (ive or more daily portions of FVG a week); regular consumption of beans (ive or more days a week); breakfast (having breakfast at home); suiciente physical activity during free time (mild or moderate physical activity for at least 150 minutes a week, or vigorous activities for at least 70 minutes a week); active commute to work, and/or school (walking or riding a bicycle, for 150 minutes or more a week); protection against ultraviolet radiation and owning a private health insurance plan.
The study presents no conlicts of interests, and the VIGITEL survey is registered with n. 13081. The study was approved by the National Committee on Ethics in Research (CONEP). In telephone interviews, the informed consente form is replaced by the verbal report obtained at the time of telephone contact.
RESULTS
In the comparison between the distribution of landline records and the sample raled by SD, the result of the homogeneity test showed that both distributions are similar (p-value of 0.12). In 2010, 1,994 interviewes were conducted, ranging from 303 in the SD of Venda Nova and 145 in the SD of Pampulha.
The χ2 showed that the health regional is associated with the variables of schooling,
skin color, marital status and household inhabitants. By using these variables in the cluster analysis of SDs, the result of the hierarchical clustering showed that the SD can be grouped (Figure 1). By adopting 8 as the cutof point, in the distant scale of combined clusters, the nine clustered SDs were grouped in four homogeneous clusters based on the selected characteristics. By using the average linkage method, four groups were identiied: (a) cluster 1: adults with up to eight schooling years, married and self-declared as being mulattos. This group consists of the SDs of North, Venda Nova, Barreiro, Northeast and Northwest; (b) cluster 2: SDs of West and East; (c) in clusters 3 (SD of Pampulha) and (d) 4 (SD of Center-South) mostly had higher schooling and higher proportion of people with white skin.
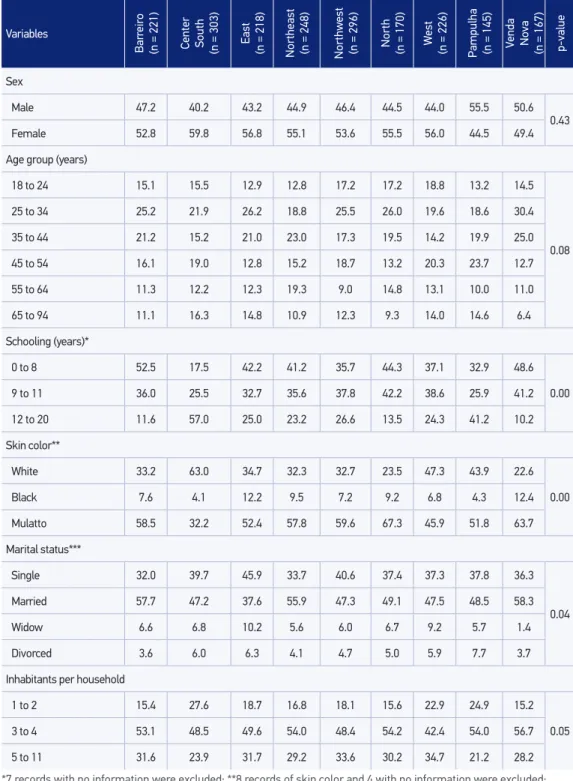
The population aged 12 schooling years or more was found in clusters 4 and 3, SD of Center-South (57%) and Pampulha (41.2%); while the population with lower schooling (0 to 8 schooling years) was found in cluster 1 (p < 0.01). With regard to white skin, higher proportions were identiied in the SD of Center-South (63%), and black race/color (black and mulattos) was more frequent in cluster 1: SD of North (76.5%), Venda Nova (76.1%), Northeast (67.3%) and Northwest (66.8%) (p < 0.01). The number of 1 to 2 inhabitants was more common in the SD of Center-South (27.6%) and Pampulha (24.9%) (p < 0.05). The married marital status was more common in Venda Nova (58.3%), Barreiro (57.7%) and Northeast (55.9%) (p = 0.04) (Table 1).
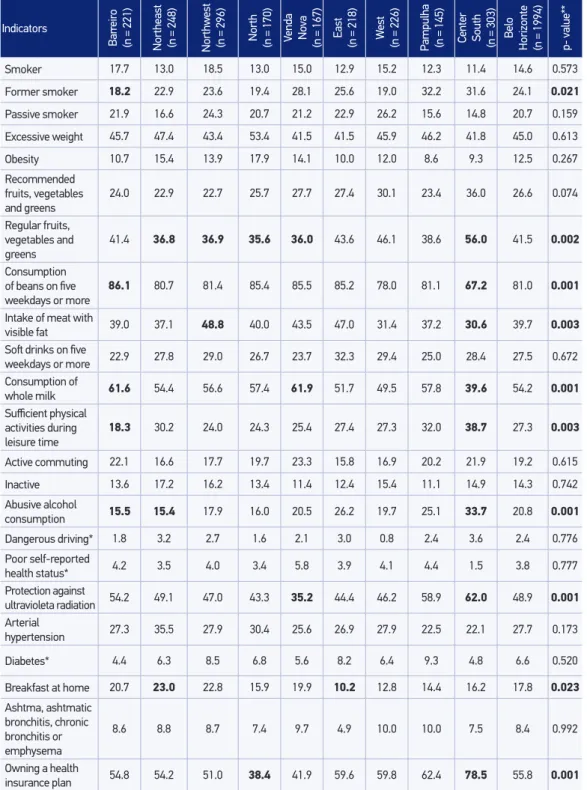
obesity, recommended FVG, ive or more soft drinks a week, whole milk, active commute, inactive, dangerous driving, poor health status, arterial hypertension, diabetes and asthma, asthmatic bronchitis or emphysema did not presente diferences between SDs. Table 2 shows, in bold, values with statistically signiicant diference.
The prevalence of former smokers in the capital was of 24.1%, and, after being stratiied by SDs, it presents with statistically signiicant diferences (p = 0.02): Pampulha, with 32.2%, Center-South, with 31.6%, and Barreiro, with 18.2%.
The regular intake of FVG was of 41.5% in the capital and, after SD stratiication, it was possible to observe signiicant diferences (p = 0.001) between the SDs of Center-South (56%) and cluster 1: North (35.6%), Northeast (36.8%), Venda Nova (36.8%) and Northwest (36.9%). The consumption of beans was of 81% in the capital and, after SD stratiication, signiicant diferences were observed (p < 0.001) between the SD of Barreiro (86.1%) and Center South (67.2%). The habit of having breakfast at home was of 17.8% in the capital, with signiicant diferences (p = 0.023) between the SD of Northeast (23.0%) and East (10.2%).
The prevalence of consuming whole milk in the capital was of 54.2%, and after SD stratiication it is possible to observe signiicant diferences (p = 0.001) between the SDs of Center South, with 39.6%, Venda Nova, with 61.9%, and Barreiro, with 61.6%.
The intake of meat with visible fat was of 39.7% in the capital and, after SD stratiication, there wer diferences (p = 0.003) between the SD of East (47.0%), Center South (30.6%) and West (31.4%).
Figure 1. Sanitary district clusters according to sociodemographic characteristics, obtained by the hierarchical clustering technique. Belo Horizonte, 2010.
HIERARCHICAL CLUSTER ANALYSIS
Dendrogram using Average Linkage (Within Group)
Rescaled Distance Cluster Combine
Cutof point
CASE n
North
Cluster 1
Cluster 2
Cluster 3 Cluster 4
6
0 5 10 15 20 25
Venda Nova 9
Barreiro 1
Northeast 4
Northwest 5
East 3
West 7
Pampulha 8
Table 1. Distribution of frequency (%) of demographic variables per sanitary district in Belo
Horizonte. VIGITEL, Brazil, 2010.
*7 records with no information were excluded; **8 records of skin color and 4 with no information were excluded; ***15 records with no information were excluded.
Variables
Bar
reir
o
(n = 221) Center South (n = 303) East (n = 218) Northeast (n = 248) Northw
est
(n = 296) North (n = 170) W
est
(n = 226) Pampulha (n = 145) Venda No
va
(n = 167) p-value
Sex
Male 47.2 40.2 43.2 44.9 46.4 44.5 44.0 55.5 50.6
0.43
Female 52.8 59.8 56.8 55.1 53.6 55.5 56.0 44.5 49.4
Age group (years)
18 to 24 15.1 15.5 12.9 12.8 17.2 17.2 18.8 13.2 14.5
0.08
25 to 34 25.2 21.9 26.2 18.8 25.5 26.0 19.6 18.6 30.4
35 to 44 21.2 15.2 21.0 23.0 17.3 19.5 14.2 19.9 25.0
45 to 54 16.1 19.0 12.8 15.2 18.7 13.2 20.3 23.7 12.7
55 to 64 11.3 12.2 12.3 19.3 9.0 14.8 13.1 10.0 11.0
65 to 94 11.1 16.3 14.8 10.9 12.3 9.3 14.0 14.6 6.4
Schooling (years)*
0 to 8 52.5 17.5 42.2 41.2 35.7 44.3 37.1 32.9 48.6
0.00
9 to 11 36.0 25.5 32.7 35.6 37.8 42.2 38.6 25.9 41.2
12 to 20 11.6 57.0 25.0 23.2 26.6 13.5 24.3 41.2 10.2
Skin color**
White 33.2 63.0 34.7 32.3 32.7 23.5 47.3 43.9 22.6
0.00
Black 7.6 4.1 12.2 9.5 7.2 9.2 6.8 4.3 12.4
Mulatto 58.5 32.2 52.4 57.8 59.6 67.3 45.9 51.8 63.7
Marital status***
Single 32.0 39.7 45.9 33.7 40.6 37.4 37.3 37.8 36.3
0.04
Married 57.7 47.2 37.6 55.9 47.3 49.1 47.5 48.5 58.3
Widow 6.6 6.8 10.2 5.6 6.0 6.7 9.2 5.7 1.4
Divorced 3.6 6.0 6.3 4.1 4.7 5.0 5.9 7.7 3.7
Inhabitants per household
1 to 2 15.4 27.6 18.7 16.8 18.1 15.6 22.9 24.9 15.2
0.05
3 to 4 53.1 48.5 49.6 54.0 48.4 54.2 42.4 54.0 56.7
*Estimate with low level of reliability **test of proprotion between sanitary districts
Note: Indicators with p < 0.05; values in bold present statistically signiicant diferences between sanitary districts. Table 2. Frequency (%) of risk and protective factors for chronic non communicable diseases
among adults per sanitary district in Belo Horizonte. VIGITEL, Brazil, 2010.
Indicators
Bar
reir
o
(n = 221) Northeast (n = 248) Northw
est
(n = 296) North (n = 170) Venda No
va
(n = 167) East (n = 218) W
est
(n = 226) Pampulha (n = 145) Center South (n = 303) Belo
Horizonte (n = 1994) p- value**
Smoker 17.7 13.0 18.5 13.0 15.0 12.9 15.2 12.3 11.4 14.6 0.573
Former smoker 18.2 22.9 23.6 19.4 28.1 25.6 19.0 32.2 31.6 24.1 0.021
Passive smoker 21.9 16.6 24.3 20.7 21.2 22.9 26.2 15.6 14.8 20.7 0.159
Excessive weight 45.7 47.4 43.4 53.4 41.5 41.5 45.9 46.2 41.8 45.0 0.613
Obesity 10.7 15.4 13.9 17.9 14.1 10.0 12.0 8.6 9.3 12.5 0.267
Recommended
fruits, vegetables
and greens
24.0 22.9 22.7 25.7 27.7 27.4 30.1 23.4 36.0 26.6 0.074
Regular fruits,
vegetables and greens
41.4 36.8 36.9 35.6 36.0 43.6 46.1 38.6 56.0 41.5 0.002
Consumption
of beans on ive weekdays or more
86.1 80.7 81.4 85.4 85.5 85.2 78.0 81.1 67.2 81.0 0.001
Intake of meat with
visible fat 39.0 37.1 48.8 40.0 43.5 47.0 31.4 37.2 30.6 39.7 0.003 Sot drinks on ive
weekdays or more 22.9 27.8 29.0 26.7 23.7 32.3 29.4 25.0 28.4 27.5 0.672 Consumption of
whole milk 61.6 54.4 56.6 57.4 61.9 51.7 49.5 57.8 39.6 54.2 0.001 Suicient physical
activities during leisure time
18.3 30.2 24.0 24.3 25.4 27.4 27.3 32.0 38.7 27.3 0.003
Active commuting 22.1 16.6 17.7 19.7 23.3 15.8 16.9 20.2 21.9 19.2 0.615
Inactive 13.6 17.2 16.2 13.4 11.4 12.4 15.4 11.1 14.9 14.3 0.742
Abusive alcohol
consumption 15.5 15.4 17.9 16.0 20.5 26.2 19.7 25.1 33.7 20.8 0.001
Dangerous driving* 1.8 3.2 2.7 1.6 2.1 3.0 0.8 2.4 3.6 2.4 0.776
Poor self-reported
health status* 4.2 3.5 4.0 3.4 5.8 3.9 4.1 4.4 1.5 3.8 0.777
Protection against
ultravioleta radiation 54.2 49.1 47.0 43.3 35.2 44.4 46.2 58.9 62.0 48.9 0.001
Arterial
hypertension 27.3 35.5 27.9 30.4 25.6 26.9 27.9 22.5 22.1 27.7 0.173
Diabetes* 4.4 6.3 8.5 6.8 5.6 8.2 6.4 9.3 4.8 6.6 0.520
Breakfast at home 20.7 23.0 22.8 15.9 19.9 10.2 12.8 14.4 16.2 17.8 0.023
Ashtma, ashtmatic bronchitis, chronic bronchitis or emphysema
8.6 8.8 8.7 7.4 9.7 4.9 10.0 10.0 7.5 8.4 0.992
Owning a health
The practice of suicient physical activities during leisure time was of 27.3% in the capital, with signiicant diferences (p = 0.002) between the SD of Center South (38.7%) and Barreiro (18.3%).
Concerning abusive alcohol consumption, 20.8% of the interviewees in the capital were identiied, with signiicant diferences (p < 0.001) between the SD of Center South (33.7%), Barreiro (15.5%) and Northeast (15.4%). The frequency of adults who reported being protected against ultraviolet radiation was of 48.9%, and there were signiicant diferences (p < 0.001) between the SDs, ranging from 62.0% in the SD of Center South to 35.2% in the SD of Venda Nova.
The proportion of adults who own an insurance health plan was of 55.8%, with signiicant diferences (p < 0.001) between the SDs of Center South (78.5%) and North (38.4%) (Table 2). The prevalence of driving after the abusive alcohol consumption and poor health self-evaluation are little accurate.
DISCUSSION
The analysis that shows the distribution of risk and protective factors for CNCDs per spatial areas inside the urban space, sub-regions, is new in VIGITEL. Studies indicate that ecological analyses may support the deinition of speciic actios for social and territorially deined populations8.
An ecological study conducted in Belo Horizonte showed the importance of spatial analysis in the conduction of public policies that prioritize risk areas, and can contribute with the reduction of inequalities in child mortality in risk areas of the SDs9.
The tradition of dealing with intraurban diferentials in Belo Horizonte oriented the Municipal Secretariat of Health to create the Health Vulnerability Index (IVS). This composite index was created based on socioeconomic and health indicators, by classifying the census sectors in low, medium and high risk strata, and then it started to guide the planning of health actions19. By using the IVS methodology, a study conducted
in Belo Horizonte, by Braga et al.11, analyzed health indicators, including risk factors for
CNCDs, according to the distribution of the population in three geographic areas of the city. The authors found signiicant associations between high risk stratum and health conditions, thus reinforcing the importance of spatial analysis in the identiication of intraurban diferentials20.
Indicators that are already known as determinants of health conditions in the deinition of clusters, like schooling, were used in this study. People with high schooling have more access to information, tend to value health care, as well as to adopt healthier behaviors and to look for health preventive services22. Besides, schooling tends to be the income proxy
and, consequently, of better health conditiosn23. The white color tends to be associated with
income and schooling and, in general, to better health conditions24.
The current study aggregated the SDs in 4 clusters, according to sociodemographic indicators. Cluster 4 (Center South SD) had better sociodemographic indicators and higher frequencies of protective factors, as well as lower frequencies of risk factors for CNCDs, unlike cluster 1, with worse indicators.
With regard to smoking, a study from the Brazilian Institute of Geography and Statitics (IBGE), in 2008 (PETab)25, showed there is an inverse relationship between
the level of income and schooling and the prevalence of tobacco use and former smokers25. The same situation was described in studies from other countries, like
Italy and South Africa, which showed lower prevalence of smokers in a population with higher schooling and, consequently, income26,27. In Belo Horizonte, Braga et al.11
found higher prevalence of smoking among elderly people in high risk areas, with lower socioeconomic status/schooling. This is compatible with the findings regarding the Center South SD (cluster 4), which presents the lowest prevalence of smoking and the highest prevalence of former smokers, even though these values are not statistically significant for smoking.
The healthy dietary pattern was also more common in the Center South SD (cluster 4), since it was possible to observe higher prevalence of the regular intake of FVG, lower frequency of whole milk consumption, meat with visible fat and milk with fat. The intake of beans is more common in the SDs of Barreiro and Venda Nova (cluster 1). Braga et al.11
showed unsatisfactory consumption of FVG in areas with higher risk in Belo Horizonte. Diets that are rich in FVG are associated with reduced mortality, decreased risk of cardiovascular diseases and reduced incidence of several types of cancer28. Studies associate
higher schooling to a better dietary pattern29. The higher intake of FVG in populations
with higher schooling has been attributed to the fact that these people have more access to information, which contributes with the adoption of healthy habits, besides the access to healthy foods, which tend to be more expensive29.
VIGITEL has shown that the population with more schooling years has consumed fewer beans, probably by replacing the calories of traditional foods with other types of food. The Family Budget Survey (POF) also identiied the less frequent consumption of beans for the population with higher income and schooling30.
Suicient physical activity during leisure time was more prevalent in the Center South SD and less common in the Barreiro SD. Insuicient physical activity is an essential risk factor for mortality, comparable to smoking32. People who are not physically active have more
risk of mortality due to any cause in comparison to those who perform at least 30 minutes of moderate physical activity on most weekdays21,32. High levels of physical activity are
associated with schooling and income32,33. Braga et al.11 found lower prevalence of physical
activity in areas with higher socioeconomic risk.
Excessive weight and obesity were high in the whole city, with no diferences between SDs. This is a warning for the deinition of preventive policies5,7.
Abusive alcohol consumption is a multiple risk factor for health, including conditions such as hypertension, cirrhosis, stroke, neoplasms, besides traic accidents and violence34.
The Center South SD (cluster 4) presented the highest prevalence of abusive alcohol consumption, besides a higher frequency with regard to the association between alcohol and driving. The association between abusive alcohol consumption and individuals with high purchasing power and schooling was also described34,35.
Arterial hypertension constitutes an important marker, being a risk factor for coronary heart disease and cerebrovascular disease, heart failure, kidney failure, peripheral vascular disease and other damages to blood vessels2. There were no diferences between SDs with
regard to arterial hypertension. Concerning diabetes, it is an important risk factor for heart diseases and, in general, the higher frequency of diagnoses of diabetes relects more access to the service network and the age group structure, being more common among older populations1,2.
Among VIGITEL limitations, we identified the landline coverage in some regions, even though the average of the capital presents high coverage, superior to 73%, which makes the population estimates of the city stable. Besides, weighting factors are used to correct the estimates. Other limitations were: this is a cross-sectional study, so it is not possible to establish temporal relationships, and the sample size in the SDs of Pampulha and Northwest, thus resulting in less accurate estimates, especially for low prevalence indicators.
The explanations based on the ecological model also have limitations concerning the interpretation of complex phenomena; therefore, they do not capture all of the territorial diferences. SDs can be internally heterogeneous in the socioeconomic and urban infrastructure aspects. So, the indings for the SDs of Center South and Pampulha, which presented better indicators, still have major internal territorial inequalities and, in order to plan for actions, these internal diferences should be considered.
CONCLUSION
The study design was adequate to estimate intraurban diferentials concerning risk and protective factors for CNCDs that are representative of the adult population, with access to landlines, in one of the largest urban centers in the country.
Studies conducted to identify inequities in the urban space may generate evidence and overcome possibilities, so they can increase discussions that lead to the development of intersectoral actions.
The results described here, with diferences between SDs, may relect socioeconomic situations, as well as schooling, income, age distribution and access to the service, thus resulting in a concentration of risk factors for CNCDs in speciic regions. Social inequities and life conditions constitute the main obstructions to the progress and improvement of the health situation, and this study can be useful to deine health priorities.
Data from VIGITEL may contribute with the approximation of the surveillance of risk factors for CNCDs, getting closer to the analysis of diferentials of the health situation and life conditions in the diferent sectors of the population. These studies should be connected to levels of decision-making, thus contributing with the eforts to prioritize more unequal sectors and territories20.
1. Bonita R, Magnusson R, Bovet P, Zhao D, Malta DC, Geneau R, et al. Country actions to meet UN commitments on non-communicable diseases: a stepwise approach. Lancet 2013; 381(9866): 575-84.
2. Schmidt MI, Duncan BB, Azevedo e Silva G, Menezes AM, Monteiro CA, Barreto SM, et al. Chronic non-communicable diseases in Brazil: burden and current challenges. Lancet 2011; 377(9781): 1949-61.
3. World Health Organization (WHO). Preventing chronic diseases: a vital investment. Geneva: WHO; 2005.
4. World Health Organization (WHO). Closing the gap in generation health equality through action on the social determinants of health. Commission on Social Determinants of Health Final Report. Geneva: WHO; 2008.
5. Malta DC, Morais Neto OL, Silva Junior JB. Apresentação do plano de ações estratégicas para o enfrentamento das doenças crônicas não transmissíveis no Brasil, 2011 a 2022. Epidemiol Serv Saúde 2011; 20(4): 425-38.
6. Welch JR, Ferreira AA, Santos RV, Gugelmin SA, Werneck GL, Coimbra Junior CEA. Nutrition transition, socioeconomic diferentiation, and gender among adult Xavante Indians, Brazilian Amazon. Hum Ecol 2009; 37(1): 13-26.
7. Brasil. Ministério da Saúde. Plano de ações estratégicas para o enfrentamento das doenças crônicas não transmissíveis (DCNT) no Brasil, 2011-2022. Brasília: Ministério da Saúde; 2011.
8. Barros MBA. Epidemiolog ia e superação das iniqüidades em saúde. In: Barata RB, Barreto ML, Almeida Filho N, Veras RP. Eqüidade e Saúde, Contribuições da Epidemiologia. Série Epidemiologia 1. Rio de Janeiro: Fiocruz/ABRASCO; 1997. p. 161-76.
9. Malta DC, Almeida MCM, Dias MAS, Merhy EE. A mortalidade infantil em Belo Horizonte, Minas Gerais, Brasil, por área de abrangência dos Centros de Saúde (1994-1996). Cad Saúde Pública 2001; 17(5): 1189-98.
11. Braga LS, Macinko J, Proietti FA, César CC, Lima-Costa MF. Diferenciais intra-urbanos de vulnerabilidade da população idosa. Cad Saúde Pública 2010; 26(12): 2307-15.
12. Assunção RM, Barreto SM, Guerra HL, Sakurai E. Mapas de taxas epidemiológicas: uma abordagem Bayesiana. Cad Saúde Pública 1998; 14(4): 713-23.
13. Silva NN. Amostragem Probabilística: um curso introdutório. 2 ed. São Paulo: EDUSP; 2001.
14. Brasil. Ministério da Saúde. VIGITEL Brasil 2009: vigilância de fatores de risco e proteção para doenças crônicas por inquérito telefônico. Brasília: Ministério da Saúde; 2010.
15. Instituto Brasileiro de Geografia e Estatística (IBGE). Pesquisa Nacional por Amostra de Domicílios. Rio de Janeiro: IBGE; 2008.
16. Stata Corporation. Stata Statistical Software: Release 11. Stata Corporation: Stata Press; 2009.
17. Bussab WO, Morettin PA. Estatística Básica. 5 ed. São Paulo: Saraiva; 2002.
18. Johnson RA, Wichern DW. Applied multivariate statistical analisys. New Jersey: Prentice and Hall Inc.; 1982.
19. Secretaria Municipal de Saúde de Belo Horizonte. Índice de vulnerabilidade à saúde 2003. Belo Horizonte: GEEPI; 2003. Disponível em: http:// www.pbh.gov.br/smsa/biblioteca/gabinete/ risco2003. (Acessado em 30 de outubro de 2012).
20. Castellanos PD. Epidemiologia, saúde pública, situação de saúde e condições de vida: considerações conceituais. In: Barata RB, Almeida Filho N. Eqüidade e Saúde, Contribuições da Epidemiologia. Série Epidemiologia 1. Rio de Janeiro: Fiocruz/ABRASCO; 1997. p. 137-60.
21. World health Organization (WHO). Global Atlas on Cardiovascular Disease Prevention and Control. Geneva: WHO; 2011.
22. Lima-Costa MF. Influência da idade e da escolaridade no uso de serviços preventivos de saúde – Inquérito de Saúde da Região Metropolitana de Belo Horizonte, Minas Gerais, Brasil. Epidemiol Serv Saúde 2004; 13(4): 209-15.
23. Noronha KVMS, Andrade MV. Desigualdades sociais em saúde e na utilização dos serviços de saúde entre os idosos na América Latina. Rev Panam Salud Pública 2005; 17(5/6): 410-8.
24. Instituto Brasileiro de Geografia e Estatística (IBGE). Censo 2010. Rio de Janeiro: IBGE; 2011. Disponível em: http://www.ibge.gov.br/home/presidencia/
noticias/noticia_visualiza.php?id_noticia=1717&id_ pagina=1. (Acessado em 30 de outubro de 2012).
25. Instituto Brasileiro de Geografia e Estatística (IBGE). Pesquisa Nacional por Amostra de Domicílios - Tabagismo. Rio de Janeiro: IBGE; 2008.
26. Sardu C, Mereu A, Minerba L, Contu P. The Italian national trends in smoking initiation and cessation according to gender and education. J Prev Med Hyg 2009; 50(3): 191-5
27. Peer N, Bradshaw D, Laubscher R, Steyn K. Trends in adult tobacco use from two South African Demographic and Health Surveys conducted in 1998 and 2003. S Afr Med J. 2009; 99(10): 744-9
28. Tourlouki E, Matalas AL, Panagiotakos DB. Dietary habits and cardiovascular disease risk in middle-aged and elderly populations: a review of evidence. Clin Interv Aging 2009; 4: 319-30.
29. Jaime PC, Figueiredo ICR, Moura EC, Malta DC. Fatores associados ao consumo de frutas e hortaliças no Brasil, 2006. Rev Saúde Pública 2009; 43(Suppl 2): 57-64.
30. Instituto Brasileiro de Geograia e Estatística (IBGE). Pesquisa de orçamentos familiares 2008-2009: análise da disponibilidade domiciliar de alimentos e do estado nutricional no Brasil. Rio de Janeiro: IBGE; 2010.
31. Enes CC, Slater B. Obesidade na adolescência e seus principais fatores determinantes. Rev Bras Epidemiol 2010; 13(1): 163-71.
32. Lee IM, Shiroma EJ, Lobelo F, Puska P, Blair SN, Katzmarzyk PT. Effect of physical inactivity on major non-communicable diseases worldwide: an analysis of burden of disease and life expectancy. Lancet 2012; 380(9838): 219-29.
33. Florindo AA, Hallal PC, Moura EC, Malta DC. Prática de atividades físicas e fatores associados em adultos, Brasil, 2006. Rev Saúde Pública 2009; 43(Suppl 2): 65-73.
34. Moura EC, Malta DC. Consumo de bebidas alcoólicas na população adulta Brasileira: características sociodemográficas e tendência. Rev Bras Epidemiol 2011; 14(Suppl 1): 61-70.
35. Barros MB, Botega NJ, Dalgalarrondo P, Marín-Leon L, de Oliveira HB. Prevalence of alcohol abuse and associated factors in a population-based study. Rev Saúde Pública 2007; 41(4): 502-9.
Received on: 01/11/2013