Development of a Food
Frequency Questionnaire for
adults in a population-based
sample in Cuiabá, Mid-Western
Region of Brazil
Márcia Gonçalves Ferreira
I,II,IIINeuciani Ferreira da Silva
IIFrancianny Danyella Schmidt
IRegina Maria Veras Gonçalves da Silva
I,II,IIIRosely Sichieri
IVLenir Vaz Guimarães
IIRosângela Alves Pereira
VI Departamento de Alimentos e Nutrição da Universidade Federal de Mato
Grosso-UFMT.
II Programa de Pós-Graduação em Saúde Coletiva da Universidade Federal de
Mato Grosso- UFMT.
III Programa de pós-Graduação em Biociências da Universidade Federal de Mato
Grosso- UFMT.
IV Departamento de epidemiologia da Universidade do Estado do Rio de Janeiro
–UERJ
V Departamento de Nutrição Social e Aplicada do Instituto de Nutrição Josué de
Castro da Universidade Federal do Rio de Janeiro-UFRJ.
Financial support: Conselho Nacional de Desenvolvimento Cientíico e Tecnológico (CNPq – Pro-cesso n° 402102-2005/3)
Corresponding author: Márcia Gonçalves Ferreira,Avenida Marechal Deodoro, n° 829, ap. 1202, Bairro Araés, Cuiabá, MT CEP 78005-50 - E-mail: [email protected]
Abstract
Objective: To describe the design of a Food
Frequency Questionnaire (FFQ) to be used in studies on food intake of adults from Cuiabá, Mato Grosso State, Brazil. Methods: A 24-hour dietary recall (24hR) was applied to a sub-sample of 104 men and women, randomly selected from a random popu-lation-based study sample. Based on the frequency of report and on the contribution to the intake of energy and nutrients in the 24hR, 81 food items and respective reference servings were selected to comprise the FFQ food list. Reference portions were deined based on the most reported portion sizes in the 24-hour dietary recalls. The FFQ list was associated to eight options of intake frequency. Results: Sugar, coffee, beans, rice, beef, bread, and soda were cited by at least 50% of the interviewed group and the latter four foods were the ones that most contributed to energy intake. There were no differences among men and women related to the foods that provided most macro and micronutrients. Conclusion: The FFQ inclu-ded the most relevant food items involved in the food habits of the adult population from Cuiabá, Mato Grosso. Once the validity and reproducibility of this tool are proven, it will be useful in epidemiologic and clinical investigations on the role of diet on disease development in the target population.
Keywords: Questionnaires. Food intake.
Introduction
In the light of the current epidemio-logical scenario in Brazil, food intake is a challenging but highly relevant area of research to elucidate relationships between diet and disease. The development of spe-ciic instruments for dietary assessment in different Brazilian regions associated with other indicators of nutritional status can help monitoring dietary trends and shaping public health policies.
The Food Frequency Questionnaire (FFQ) is a method widely applied in the assessment of food intake in epidemiolo-gical studies. This instrument consists of a list of food items that are most commonly consumed or included in the food habits of a given population. The FFQ is used to record the usual intake frequency of listed foods in a pre-established period as well as specifications of average portions consumed.1, 2
The FFQ is an easy-to-use, low-cost ob-jective instrument that can be adapted to the target population, thus justifying its use in population-based studies. It is believe to be the most practical and useful method for the assessment of food intake.1, 3, 4
However, the FFQ has limitations as it relies on respondents’ recall of past habits, provides less accurate quantiication of food intake by using standardized measures, and does not allow detailed food intake due to a pre-established food listing.1,4 In addition,
factors such as age, education, and ethnic origin may affect the validity of data collec-ted in the FFQ.5
These limitations can be minimized through the development of group-speciic questionnaires, which are less prone to misinterpretation and can provide more accurate, valid information.6,7
Given the importance and need of appropriate food intake assessment, the purpose of the present study was to deve-lop an FFQ based on a probability sample for use in studies on food intake in adults in the city of Cuiabá, Central-West Brazil. This study represents a major advance in
nutritional epidemiology as it is unpre-cedented the development of a FFQ in this region.
Methods
Study population
The development of the FFQ was based on prior administration of 24-hour dietary recalls (24hRs) on 104 adults living in the ur-ban area of Cuiabá, a subsample randomly selected from a probability sample in a po-pulation-based study.8 According to Willett,1
a sample of 100 respondents is considered suficient to develop instruments to provide acceptable results in FFQ validity studies.
Twenty-four-hour dietary recalls were administered to randomly selected re-sidents of two lower-middle and upper-middle income districts. These districts were selected from two lists of districts classiied according to household head income by the Institute of Urban Planning and Develop-ment of the City of Cuiabá.9 Districts with
predominantly low-income populations were excluded as they could lack the money to buy food and could not afford a variety of food, thus affecting the selection of food items in the FFQ.
Streets of the selected districts were ma-pped and households were drawn. Only one individual per household aged between 20 and 50 years was selected to avoid informa-tion interdependence among respondents. Bedridden and disabled individuals, preg-nant and breastfeeding women, patients with diseases requiring dietary changes were not eligible to participate in the study. All respondents selected agreed to partici-pate with no refusals recorded.
Data collection
anthropo-metric information. All interviews were per-formed by two trained 4th grade students of Nutrition at Universidade Federal de Mato Grosso (UFMT).
Weekdays and weekend days were evenly selected to the 24hDR application. Common household vessels, glassware, and silveware were used for the report of portion sizes – this was facilitated by the fact that all interviews were conducted in the households. Trademarks, product type, and packaging capacity of processed foods were recorded for more accurate assessment of portions consumed.
During the interviews, respondents were asked to report all food items and bevera-ges consumed in the previous 24 hours, and their amounts and portion sizes in household measures. To improve accuracy of data collected the following measures were taken:
a) Based on a pre-deined list of foods and dishes, available in the study manual, in-terviewers checked for missing items not usually reported in similar studies;1
b) All ingredients of dishes, as well as amounts consumed, were speciied; c) Time and place where foods were consu-med were recorded;
e) All items were carefully reviewed to en-sure that no food was missing.
Development of the FFQ
A list of 289 food items was constructed based on data from 24-hour dietary recalls. For the FFQ those items most commonly reported in the sample studied,10 at a
fre-quency of 15% or more, either as a single item or part of any preparation, or even to-gether with other foods of similar nutritional composition, were selected.
The FFQ list also included speciic food items that, despite below the established frequency cutoff, can possibly help identify dietary patterns or trends, e.g., seasonal or processed food, and regional dishes.10 Also,
some foods were grouped by their nutritio-nal similarity.
We also estimated the energy contri-bution of each food item and 13 nutrients – carbohydrate, protein, total fat, saturated and unsaturated fat, cholesterol, iber, iron, calcium, folate, thiamin, vitamin C and vitamin B6 – using Block et al. method,11
which calculates the ratio between the amount of a nutrient in each food item and total nutrient in all food items, multiplied by 100. There were also prepared lists of foods that contributed with 90% of intake of energy and major nutrients in the diet of the sample studied.
Frequency options were deined based on those used in FFQs developed for use in adults12 and adolescents13 in studies carried
out in the city of Rio de Janeiro.
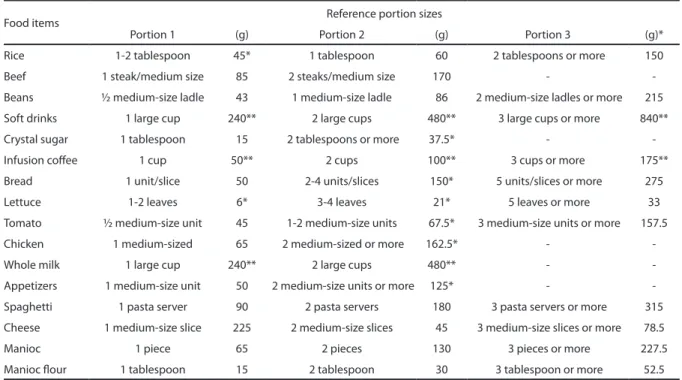
Reference portion sizes were defined based on the most common food portions reported in the 24-hour dietary recalls. Con-ventional portioning was used for some foods, for example, a French roll or an egg (one unit).
The nutritional composition of each food item was assessed based on the Nu-tWin software,14 preparations not originally
included in the program were estimated by composing food information of the components. The composition of food preparations/dishes that were added was based on detailed nutritional content records developed based on food items in the NutWin table. Missing information for any micronutrient was completed with nutritional data from the Brazilian Food Composition Table.15
Socioeconomic and nutritional status and energy contribution of macronutrients
Socioeconomic status (SES) of res-pondents was assessed according to the Brazilian Association of Market Research criteria:16 accumulation of material goods,
purchasing power, and household head schooling. Families were divided into ive socioeconomic classes, from A (highest) to E (lowest).
cutoffs as recommended by the World He-alth Organization (WHO).17
Energy contribution of macronutrients was based on the Brazilian Ministry of He-alth recommendations.18
Ethical considerations
All respondents were informed about the study purposes and signed an informed consent form following Resolution 196/96 of the Brazilian National Health Board. The study was submitted to and approved by Research Ethics Committee of Julio Muller University Hospital (Protocol No. 234/CEP-HUJM/05). No invasive procedures were performed.
Results
The sample included 53 (51.0%) women; the mean age was 34 years old (standard deviation = 9 years old); 37.5% of the res-pondents were between 20–39 years old; 46.2% completed the high school education and 20.2% completed elementary school education or never attended school; 51.0% of respondents were class B (table 1).
There was a 40.4% prevalence of excess weight in this sample (BMI ≥ 25 kg/m2), of
which 30.8% were overweight and 9.6% obe-se. Normal weight (BMI ≥ 18.5 and <25.0 kg/ m2) was found in 54.8% and only 4.8% were
underweight (BMI <18.5 kg/m2).
The food items reported at a frequency of at least 15% in the sample studied are lis-ted in Table 2. Rice, meat, beans, soft drinks, sugar, coffee and bread were consumed by over 50% of the sample. The intake of foods rich in protein, especially beef (63.5%), beans (68.3%), chicken (34.6%), and milk (34.6%) was remarkable. Lettuce (45.2%) and tomato (44.2%) were the most common vegetables consumed.
Food items less commonly reported were: eggs (9.7%), cookies (9.7%), canned food (9.7%), chocolate powder (13.5%), bonbon (13.5%), yoghurt (10.6%), ice cre-am/popsicle (7.7%), alcoholic beverages (8.7%), candied fruits/caramelized milk
(13.5%), pizza/pasta (4.8%), and hamburger snacks (5.8).
The FFQ list comprised 81 food items organized by food groups with eight cate-gories of frequency of consumption: more than 3 times a day; 2–3 times a day; once a day; 5–6 times a week, 2–4 times a week; once a week; 1–3 times a month; and never or almost never.
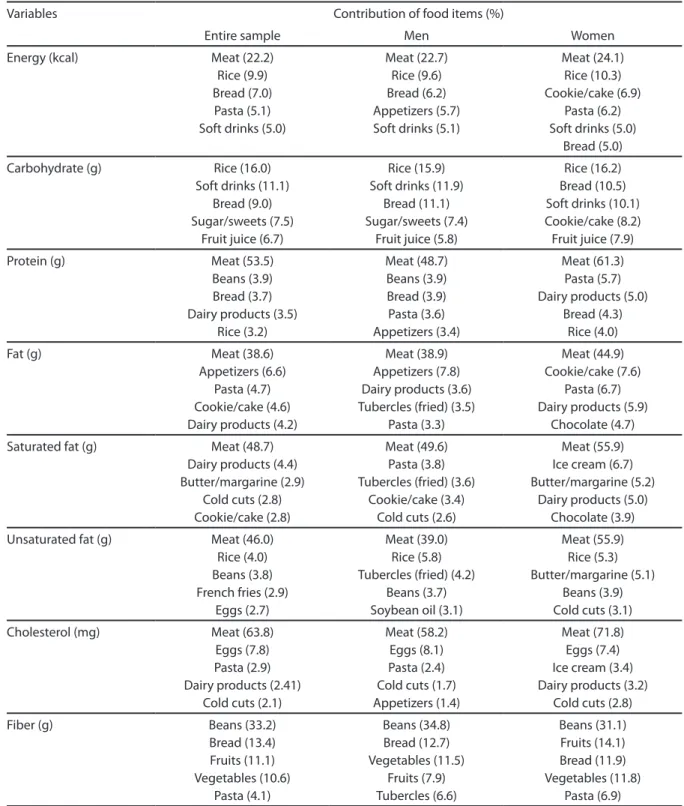
Tables 3 and 4 show major food sources of energy and nutrients in the entire sample and by gender. Food items that contribu-ted most to the energy intake were meat (22.2%), rice (9.9%), bread (9.9%), pasta (5.1%), and soft drinks (5.0%); the same was seen in women and men, except for pasta. However, appetizers (5.7%) were a main source of energy consumption in men and cookies/ cakes (6.9%) in women.
Sweet/baked goods contributed most to carbohydrate intake among men. Total protein intake from milk and dairy products
Table 1 – Socioeconomic and demographic
characteristics of adults living in the urban area of Cuiabá, Brazil, 2007 (N = 104).
Variable N %
Age (years)
20–39 39 37.5
30–39 32 30.8
≥ 40 33 31.7
Gender
Male 51 49.0
Female 53 51.0
Schooling
Did not attend school/ incomplete elementary school education
21 20.2
Elementary school education 9 8.7
High school education 48 46.2
College education 19 18.3
Graduate education 7 6.7
Socioeconomic classiication*
B 53 51.0
C 34 32.7
D 17 16.3
was only signiicant among women (5.0%). Appetizers (7.8%) and chocolate (4.7%) contributed signiicantly to total fat intake in men and women, respectively.
Beans were the main food source of iber and folate in the entire sample and in both men and women. It is noteworthy that fruit juice is a major source of vitamin C (90.3%) in women, whereas fruit juice (28.5%), fruits (19.5%), and vegetables (16.6%) are impor-tant sources of vitamin C in men.
The FFQ developed offers up three choi-ces of servings consumed for 63 food items. For all other items we considered only their dietary frequency as they were food condi-ments or foods and dishes with nutritional composition similar to other items in the list. Table 5 describes reference portions sizes (in grams and common household
measures) of the food items most commonly reported in the sample.
Diet was high in protein, which provided 19.0% of total energy intake. Fat intake was in the recommended limit (30.0%), and carbohydrate supplied 51.0%, of dietary energy intake.
Discussion
In the present study, the FFQ food list was elaborated from information obtained in 24-hour dietary recalls, given the lack of studies on the most consumed foods among adults in the city of Cuiabá. Previous studies have assessed dietary intake of speciic popula-tion groups such as adolescents, pregnant women,19 and staff of a university hospital.20
Meat, rice, and bread were the main sources of energy. Brazilian studies23,31 have
reported similar indings in people living in other Brazilian regions. However, in the target population of this study, meat was a major source of energy, which was twice as much as that reported in a São Paulo study31
and more than ive times higher than that seen in women living in the state of Paraí-ba.23 It is also remarkable the fact that soft
drinks are a moderately important source of energy intake in men and women studied.
Traditional Brazilian foods such as rice and beans remain in the diet of Cuiabá population, which can be seen as a positive inding, since trends have shown that these foods have declined in importance in Bra-zil.32 On the other hand, unhealthy eating
habits were evidenced such as high intake of simple carbohydrates and soft drinks and low fruit and vegetable intake, which suggest risk behaviors and similar dietary patterns in the Brazilian population.32
Unhealthy eating has a direct associa-tion with nutriassocia-tional status and is a risk fac-tor for several chronic non-communicable diseases as well. Data on nutritional status in this study showed a high prevalence of excess weight. The Brazilian Institute of Geography and Statistics (IBGE)32 National
Household Survey (POF 2002–2003) pointed out that Cuiabá is the Brazilian capital with
Table 2 – Frequency of food items mostly
consumed in the study population assessed by 24-hour dietary recalls. Cuiabá, Brazil, 2007.
Food items n %
Rice 87 83.7
Beef 66 63.5
Beans 71 68.3
Soft drinks 67 64.4
Crystal sugar 66 63.5
Infusion cofee 67 64.4
Bread 59 56.7
Lettuce 47 45.2
Tomato 46 44.2
Chicken 36 34.6
Whole milk 36 34.6
Appetizers (fried turnover, kibbeh, fried pastry, chicken croquette, siha)
29 27.9
Margarine 23 22.1
Spaghetti 23 22.1
Cheese 21 20.2
Manioc 17 16.3
Cold cuts(ham, mortadella, smoked turkey breast)
17 16.3
Manioc lour, farofa [toasted
cassava lour], or manioc mush
the highest prevalence of overweight among men (54.8%), higher than the average preva-lence in Brazilian male population (41.1%). According to data from theTelephone-based
Surveillance System of Risk and Protective
Factors for Chronic Non-Communicable Diseases (VIGITEL),33 Cuiabá ranks third
among Brazilian capitals with the highest overweight prevalence in men (51.4%) and sixth in women (38 5%).
Table 3 –Contribution to total energy and macronutrient intake among adults from Cuiabá, Brazil, 2007.
Variables Contribution of food items (%)
Entire sample Men Women
Energy (kcal) Meat (22.2) Rice (9.9) Bread (7.0) Pasta (5.1) Soft drinks (5.0)
Meat (22.7) Rice (9.6) Bread (6.2) Appetizers (5.7) Soft drinks (5.1)
Meat (24.1) Rice (10.3) Cookie/cake (6.9)
Pasta (6.2) Soft drinks (5.0)
Bread (5.0)
Carbohydrate (g) Rice (16.0) Soft drinks (11.1)
Bread (9.0) Sugar/sweets (7.5)
Fruit juice (6.7)
Rice (15.9) Soft drinks (11.9)
Bread (11.1) Sugar/sweets (7.4)
Fruit juice (5.8)
Rice (16.2) Bread (10.5) Soft drinks (10.1) Cookie/cake (8.2) Fruit juice (7.9)
Protein (g) Meat (53.5)
Beans (3.9) Bread (3.7) Dairy products (3.5)
Rice (3.2) Meat (48.7) Beans (3.9) Bread (3.9) Pasta (3.6) Appetizers (3.4) Meat (61.3) Pasta (5.7) Dairy products (5.0)
Bread (4.3) Rice (4.0)
Fat (g) Meat (38.6)
Appetizers (6.6) Pasta (4.7) Cookie/cake (4.6) Dairy products (4.2)
Meat (38.9) Appetizers (7.8) Dairy products (3.6) Tubercles (fried) (3.5)
Pasta (3.3)
Meat (44.9) Cookie/cake (7.6)
Pasta (6.7) Dairy products (5.9)
Chocolate (4.7)
Saturated fat (g) Meat (48.7) Dairy products (4.4) Butter/margarine (2.9)
Cold cuts (2.8) Cookie/cake (2.8)
Meat (49.6) Pasta (3.8) Tubercles (fried) (3.6)
Cookie/cake (3.4) Cold cuts (2.6)
Meat (55.9) Ice cream (6.7) Butter/margarine (5.2)
Dairy products (5.0) Chocolate (3.9)
Unsaturated fat (g) Meat (46.0) Rice (4.0) Beans (3.8) French fries (2.9)
Eggs (2.7)
Meat (39.0) Rice (5.8) Tubercles (fried) (4.2)
Beans (3.7) Soybean oil (3.1)
Meat (55.9) Rice (5.3) Butter/margarine (5.1)
Beans (3.9) Cold cuts (3.1)
Cholesterol (mg) Meat (63.8) Eggs (7.8) Pasta (2.9) Dairy products (2.41)
Cold cuts (2.1)
Meat (58.2) Eggs (8.1) Pasta (2.4) Cold cuts (1.7) Appetizers (1.4)
Meat (71.8) Eggs (7.4) Ice cream (3.4) Dairy products (3.2)
Cold cuts (2.8)
Fiber (g) Beans (33.2)
The Brazilian Ministry of Health recom-mends a diet where 55%–75% of total energy should be provided by carbohydrate, 10% and 15% from protein and between 15% and 30% from fat.18 The percent contribution of
proteins to total energy in adults in Cuiabá was found slightly higher than recommen-ded. It can be mainly attributed to high consumption of beef, which was the second most consumed food identiied in this stu-dy. However, there was found an adequate fat intake, although some Brazilian studies have shown excessive fat consumption, especially saturated fat.32,34
The strategies used in this study to cons-truct the food list of the FFQ are considered
the most suitable as they allow to obtaining a list that is not limited, enabling the de-velopment of an instrument with greater ability to assess actual food intake.27 The
advantages of 24-hour dietary recalls inclu-de its short administration, low cost, high acceptance and being easily understandable by respondents.10,28,29 A comparison between
the list obtained from food frequency re-ports and that obtained from the percentage contribution of food to energy and nutrients showed that the former included all food items of greatest relevance to the diet in the sample studied.
The food list of the proposed FFQ was supplemented with food items considered
Table 4 –Contribution to micronutrient intake among adults from Cuiabá, Brazil, 2007.
Variables Contribution of food items (%)
Entire sample Men Women
Calcium (mg) Dairy products (19.9) Meat (11.5) Bread (10.3) Pasta (8.8) Appetizers (7.2)
Dairy products (15.5) Meat (12.7) Bread (11.7) Pasta (10.5) Appetizers (9.5)
Dairy products (25.8) Meat (8.8) Bread (7.4) Pasta (6.7) Ice cream (5.8)
Iron (mg) Meat (36.7)
Bread (8.1) Beans (6.9) Pasta (5.2) Vegetables (4.1)
Meat (43.7) Bread (9.8) Beans (8.3) Pasta (5.9) Appetizers (4.5)
Meat (34.6) Cookie/cake (13.3)
Bread (7.5) Vegetables (7.4)
Beans (6.3)
Vitamin C (mg) Fruit juice (83.6) Fruits (3.5) Tubercles (2.9) Vegetables (1.8)
Fruit juice (28.25) Tubercles (17.2)
Fruits (19.5) Vegetables (16.6)
Pasta (2.8)
Fruit juice (90.3)
Thiamine (mg) Meat (28.1) Bread (13.3) Beans (12.9) Pasta (9.0)
Rice (5.4)
Meat (29.5) Bread (15.0) Beans (14.8) Pasta (8.3) Appetizers (5.2)
Meat (29.9) Bread (11.2) Beans (10.5) Pasta (9.1)
Tea (8.5)
Folate (mcg) Beans (37.4) Pasta (7.9) Meat (6.4) Bread (6.1) Fruit juice (5.8)
Beans (37.5) Pasta (8.3) Vegetables (7.2)
Fruit juice (6.7) Meat (6.9)
Beans (38.0) Vegetables (11.5)
Pasta (7.4) Meat (6.4) Bread (5.6)
Vitamin B6 (mg) Vegetables (42.9) Appetizers (6.0) Chocolates (6.0)
Pasta (5.7) Meat (5.5)
Vegetables (35.1) Appetizers (9.3)
Meat (9.2) Pasta (8.5) Fruit juice (5.9)
Vegetables (49.2) Chocolate (7.4) Cookie/cake (5.9) Butter/margarine (5.4)
of interest to describe food intake in the sample studied. For example, we included seasonal items (fruits, leafy vegetables, and legumes), processed foods that may cause health effects (chocolate powder, cookies, canned meats and vegetables, yogurt, mayonnaise, alcoholic beverages, etc.) and regional foods and dishes (guarana powder, ish, meat and rice, fried plantain, etc.). These additions have made the list more comprehensive and minimized the possibility of missing important foods for the target population. The food list of the FFQ was reviewed by nutritionists of public and private health services in the city and they veriied that the main foods of the diet of the local population were included in the instrument.
The quantity of food items included in the FFQ is consistent with that suggested by Fisberg et al.,4 whereby small food lists
(less than 50 items) may underestimate food intake, and very large lists (over than 100 items) may tire respondents and thus overestimate food intake. Some authors also
argue that very large lists do not improve the validity of the FFQ when compared to smal-ler lists. Moreover, very large questionnaires tend to have higher rates of non-response, increasing study costs and duration.1,28,30
We chose closed questions to report fre-quency of consumption. The consensus is that closed questions are more appropriate because they reduce coding time and trans-cription errors as well as missing question-naires due to incomplete or incomprehensi-ble answers.26 In this study, we deined eight
categories of frequency of consumption that are easy to understand and organized in a continuous decreasing order as proposed by Willett.1 It should be noted that all items
had the same frequency options. Frequency options in FFQs should range between ive and 10; questionnaires with less than ive categories may have signiicant amount of missing information while those with excess categories may be confusing. Most impor-tantly, they must be able to discriminate foods that are most frequently consumed and those that are rarely consumed.1,10
Table 5 – Food items and portion sizes reported in the 24-hour dietary recalls of adults from Cuiabá, Brazil, 2007.
Food items Reference portion sizes
Portion 1 (g) Portion 2 (g) Portion 3 (g)*
Rice 1-2 tablespoon 45* 1 tablespoon 60 2 tablespoons or more 150
Beef 1 steak/medium size 85 2 steaks/medium size 170 -
-Beans ½ medium-size ladle 43 1 medium-size ladle 86 2 medium-size ladles or more 215
Soft drinks 1 large cup 240** 2 large cups 480** 3 large cups or more 840**
Crystal sugar 1 tablespoon 15 2 tablespoons or more 37.5* -
-Infusion cofee 1 cup 50** 2 cups 100** 3 cups or more 175**
Bread 1 unit/slice 50 2-4 units/slices 150* 5 units/slices or more 275
Lettuce 1-2 leaves 6* 3-4 leaves 21* 5 leaves or more 33
Tomato ½ medium-size unit 45 1-2 medium-size units 67.5* 3 medium-size units or more 157.5
Chicken 1 medium-sized 65 2 medium-sized or more 162.5* -
-Whole milk 1 large cup 240** 2 large cups 480** -
-Appetizers 1 medium-size unit 50 2 medium-size units or more 125* -
-Spaghetti 1 pasta server 90 2 pasta servers 180 3 pasta servers or more 315
Cheese 1 medium-size slice 225 2 medium-size slices 45 3 medium-size slices or more 78.5
Manioc 1 piece 65 2 pieces 130 3 pieces or more 227.5
Manioc lour 1 tablespoon 15 2 tablespoon 30 3 tablespoon or more 52.5
In the FFQ, standardized portion sizes were included in order to describe the food intake amount. The use of standardized por-tions in the FFQ is still controversial. Some authors claim that this information does not signiicantly improve the instrument’s validity, arguing that in determining the instrument’s validity the quantiication of portion size may be less relevant than fre-quency of consumption.1,25 Despite these
controversies, a review study found that 42% of the questionnaires reviewed provided in-formation on portion size, 22% did not have this information and the remaining 36% asked respondents to describe the portion size regularly consumed.26
Some questionnaires developed in Brazil use median or mean portion size as reference.21-23 Given that reference portion
sizes in FFQs should be adequate to the study population to avoid underestimating or overestimating intake,7,10 we found it
appropriate to include in the FFQ the most frequently reported portions in the 24-hour dietary calls or traditional portion sizes for foods like bread and eggs (units).
One limitation of the present study is that only one 24-hour dietary recall was administered to construct the FFQ food list because a single administration may not be enough to capture information on usual dietary habits.21 We tried to minimize this
limitation through two approaches: repre-sentation of all days of the week to capture different dietary intake;22 and the inclusion
in the FFQ of food items rarely reported. For better discrimination of food intake it is key that the food list in the FFQ includes not only food items that are consumed by a fairly substantial proportion of the sample
studied but also those whose consumption varies among individuals.1,10,23,24
The lack of a full Brazilian food com-position database is a limiting factor for conducting studies on food intake. Software programs available in Brazil are mostly based on collected international tables. Da-tabases developed in other countries have a limited application because the chemical composition of foods can vary signiicantly and food cooking and/or preparation are not always consistent with local dietary habits. Furthermore, many typical foods consumed by our population are not inclu-ded in these tables.35
Given the importance of diet in the etiology of various diseases and conditions, there has been growing interest in the development of more appropriate reliable instruments for the assessment of food intake. The strategy for FFQ development described in this study can provide input for the development of similar dietary as-sessment instruments in other scenarios and population groups.
Final considerations
The development of the FFQ took into account dietary habits and practices of the population studied. After appropriate ve-riication of its validity and reliability, this questionnaire may be a valuable tool in studies investigating foods and their level of consumption that may be determinants (protective or risk factors) of nutritional status and overall health in the adult po-pulation of Cuiabá. This is a critical step to improve quality of information collected on food intake in this population.
References
1. Willett W. Nutritional Epidemiology. New York: Oxford University Press; 1998.
2. Vasconcelos FAG. Tendências históricas dos estudos dietéticos. História, Ciências, Saúde 2007; 14 (1): 197-219.
3. Slater B, Philippi ST, Marchioni DML, Fisberg RM. Validação de Questionários de Freqüência Alimentar - QFA: considerações metodológicas. Rev Bras Epidemiol 2003; 6 (3): 200-8.
5. Kristal AR, Feng Z, Coates RJ, Oberman A, George V. Associations of race/ethnicity, education, and dietary intervention with the validity and reliability of a food frequency questionnaire. Am J Epidemiol 1997; 146 (10): 856-69.
6. Sales RL, Silva MMS, Costa NMB, Euclydes MP, Eckhardt VF, Rodrigues CMA, et al. Desenvolvimento de um inquérito para avaliação da ingestão alimentar de grupos populacionais. Rev Nutr 2006; 19 (5): 539-52.
7. Colucci ACA, Philippi ST, Slater B. Desenvolvimento de um questionário de freqüência alimentar para avaliação do consumo alimentar de crianças de 2 a 5 anos de idade. Rev Bras Epidemiol 2004; 7 (4): 393-401.
8. Barbosa LS, Scala LCN, Ferreira MG. Associação entre marcadores antropométricos de adiposidade corporal e hipertensão arterial na população adulta de Cuiabá, Mato Grosso. Revista Brasileira de Epidemiologia 2009; 12(2): 237-47.
9. Cuiabá. Prefeitura Municipal de Cuiabá. Peril
socioeconômico dos bairros de Cuiabá. Ano 2007. IPDU – Instituto de Planejamento e Desenvolvimento Urbano. Cuiabá: 2007. 124 p.
10. Pereira RA, Sichieri R. Métodos de avaliação do consumo alimentar. In: Kac G, Sichieri R, Gigante DP. Epidemiologia Nutricional. Rio de Janeiro: Fiocruz e Atheneu; 2007. p. 181-200.
11. Block G, Dresser CM, Hartman AM, Carroll MD. Nutriente sources in the Americam diet: quantitative data from the NHANES II survey. I. Vitamins and minerals. Am J Epidemiol 1985; 122 (1): 13-26.
12. Sichieri R, Everhart JE. Validity of a Brazilian food frequency questionnaire against dietary recalls and estimated energy intake. Nutr Res 1998; 18 (10): 1649-59.
13. Araújo MC, Ferreira DM, Pereira RA. Reprodutibilidade de questionário semiquantitativo de freqüência alimentar elaborado para adolescentes da Região Metropolitana do Rio de Janeiro, Brasil. Cad Saúde Pública 2008; 24 (12): 2775-86.
14. Programa de apoio à Nutrição – NutWin [software]. Departamento de Informática em Saúde. Universidade Federal de São Paulo; 2005.
15. NEPA - Núcleo de Estudos e Pesquisa em Alimentação. Tabela brasileira de composição de alimentos. Campinas: NEPA-UNICAMP; 2006.
16. ABEP – Associação Brasileira de Empresas de Pesquisa. Critério de Classiicação Econômica Brasil. São Paulo; 2003. [acesso em 10 dez 2007]. Disponível em: http:// www.anep.org.br/codigosguia/cceb
17. WHO (World Health Organization), 1998. Obesity: preventing and managing the global epidemic. Geneva: WHO, 1998. (WHO Technical Report Series, 894).
18. Ministério da Saúde. Secretaria de Atenção à Saúde. Guia alimentar para a população brasileira: promovendo a alimentação saudável. Brasília: Ministério da Saúde, 2006. p. 210.
19. Camargo RMS, Veiga GV. Ingestão e hábitos alimentares de adolescentes gestantes. Folha Med 2000; 119: 37-46.
20. Lemos-Santos, MGF, Gonçalves-Silva RMV, Botelho C. Tabagismo, composição corporal, distribuição da adiposidade e ingestão alimentar de fumantes, não fumantes e ex-fumantes. Folha Med 2000; 119: 23-31.
21. Ribeiro AB, Cardoso MA. Construção de um questionário de freqüência alimentar como subsídio para programas de prevenção de doenças crônicas não transmissíveis. Rev Nutr 2002; 15 (2): 239-45.
22. Furlan-Viebig R, Pastor-Valero M. Desenvolvimento de um questionário de freqüência alimentar para o estudo da dieta e doenças não transmissíveis. Rev Saúde Pública 2004; 38 (4): 581-4.
23. Lima FEL, Fisberg RM, Slater B. Desenvolvimento de um questionário quantitativo de freqüência alimentar (QQFA) para um estudo caso-controle de dieta e câncer de mama em João Pessoa - PB. Rev Bras Epidemiol 2003; 6 (4): 373-9.
24. Cardoso MA. Desenvolvimento, validação e aplicações de questionários de freqüência alimentar em estudos epidemiológicos. In: Kac G, Sichieri R, Gigante DP. Epidemiologia Nutricional. Rio de Janeiro: Fiocruz e Atheneu; 2007. p. 201-12.
25. Molag ML, Vries JHM, Ocké MC, Dagnelie PC, Brandt PAVD, Jansen MCJF, et al. Design characteristics of food frequency questionnaires in relation to their validity. Am J Epidemiol 2007; 166 (12): 1468-78.
26. Cade J, Thompson R, Burley V, Warm D. Development, validation and utilization of food-frequency
questionnaires – a review. Public Health Nutr 2002; 5 (4): 567-87.
27. Block G, Hartman AM, Dresser CM, Carroll MD, Gannon J, Gardner L. A data-based approach to diet questionnaire design and testing. Am J Epidemiol 1986; 124 (3): 453-69.
28. Thompson FE, Byers T. Dietary assessment resource manual. J Nutr 1994; 124: S2245-S2317.
29. Martin-Moreno JM, Gorgojo L. Valoración de la ingesta dietética a nível poblacional mediante cuestionarios individuales: sombras y luces metodológicas. Rev Esp Salud Pública 2007; 81 (5): 507-18.
30. Burley V, Cade J. Consensus document on the development, validation and utilization of a food frequency questionnaire. The Fourth International Conference on Dietary Assessment Methods. Tucson, Arizona (USA); 2000.
31. Fisberg RM, Colucci ACA, Mariomoto JM, Marchioni DML. Food frequency questionnaire for adults from a population-based study. Rev Saúde Pública 2008; 42 (3): 1-4.
33. Ministério da Saúde. Estimativas sobre freqüência e distribuição sócio-demográica de fatores de risco e proteção para doenças crônicas nas capitais de 26 estados brasileiros e no Distrito Federal em 2007. Brasília: Ministério da Saúde, 2008. p. 138.
34. Monteiro CA, Mondini L, Costa RBL. Mudanças na composição da dieta familiar nas áreas metropolitanas do Brasil (1988-1996). Rev Saúde Pública 2000; 34 (3): 251-8.
35. Cuppari L, Anção MS. Métodos de inquéritos alimentares. In: Fisberg RM, Slater B, Marchioni DML, Martini LA. Inquéritos Alimentares: métodos e bases cientíicos. São Paulo: Manole; 2005. p. 71-82.