Benchmark Dose Estimation for
Cadmium-Induced Renal Tubular Damage among
Environmental Cadmium-Exposed Women
Aged 35–54 Years in Two Counties of
China
Jia Hu1, Mei Li1, Tian-xu Han1, Jian-wei Chen1, Lin-xiang Ye2, Qi Wang2*, Yi-kai Zhou1*
1.MOE Key Lab of Environment and Health, Institute of Environmental Medicine, School of Public Health, Tongji Medical College, Huazhong University of Science & Technology, Wuhan, China,2.Department of Epidemiology and Biostatistics, School of Public Health, Tongji Medical College, Huazhong University of Science & Technology, Wuhan, China
*lwq95@126.com (QW);zhouyk@mails.tjmu.edu.cn (YZ)
Abstract
Background:A number of factors, including gender, age, smoking habits, and occupational exposure, affect the levels of urinary cadmium. Few studies have considered these influences when calculating the benchmark dose (BMD) of cadmium. In the present study, we aimed to calculate BMDs and their 95% lower confidence bounds (BMDLs) for cadmium-induced renal tubular effects in an age-specific population in south-central China.
Methods:In this study, urinary cadmium, b2-microglobulin, and N-acetyl-b -D-glucosaminidase levels were measured in morning urine samples from 490 randomly selected non-smoking women aged 35–54 years. Participants were selected using stratified cluster sampling in two counties (counties A and B) in China. Multiple regression and logistic regression analyses were used to investigate the dose-response relationship between urinary cadmium levels and tubular effects. BMDs/BMDLs corresponding to an additional risk (benchmark response) of 5% and 10% were calculated with assumed cut-off values of the 84th and 90thpercentile of urinaryb2-microglobulin and N-acetyl-b-D-glucosaminidase levels of the controls.
Results: Urinary levels ofb2-microglobulin and N-acetyl-b-D-glucosaminidase increased significantly with increasing levels of urinary cadmium. Age was not associated with urinary cadmium levels, possibly because of the narrow age range included in this study. Based on urinaryb2-microglobulin and N-acetyl-b -D-OPEN ACCESS
Citation:Hu J, Li M, Han T-x, Chen J-w, Ye L-x, et al. (2014) Benchmark Dose Estimation for Cadmium-Induced Renal Tubular Damage among Environmental Cadmium-Exposed Women Aged 35–54 Years in Two Counties of China. PLoS ONE 9(12): e115794. doi:10.1371/journal.pone. 0115794
Editor:Emmanuel A. Burdmann, University of Sao Paulo Medical School, Brazil
Received:June 26, 2014
Accepted:November 26, 2014
Published:December 23, 2014
Copyright:ß2014 Hu et al. This is an open-access article distributed under the terms of the
Creative Commons Attribution License, which permits unrestricted use, distribution, and repro-duction in any medium, provided the original author and source are credited.
Data Availability:The authors confirm that all data underlying the findings are fully available without restriction. All relevant data are within the paper.
Funding:The study was supported by the Special Fund for the Environmental Protection Research in the Public Interest (Grant no. of 201109058), the National Natural Science Foundation of China (Grant no. of 81102185), and the Fundamental Research Funds for the Central Universities (Grant no. of 2011QN202). The funders had no role in study design, data collection and analysis, decision to publish, or preparation of the manuscript.
glucosaminidase, BMDs and BMDLs of urinary cadmium ranged from 2.08 to 3.80 (1.41–2.18)mg/g cr for subjects in county A and from 0.99 to 3.34 (0.74–1.91)mg/g cr for those in county B. The predetermined benchmark response of 0.05 and the 90thpercentiles of urinaryb2-microglobulin and N-acetyl-b-D-glucosaminidase levels of the subjects not exposed to cadmium (i.e., the control group) served as cut-off values.
Conclusions: The obtained BMDs of urinary cadmium were similar to the
reference point of 1 mg/g cr, as suggested by the European Food Safety Authority, indicating that cadmium exposure must be reduced to protect human health.
Introduction
Cadmium (Cd) is a heavy metal that is toxic to human beings; however, it remains a widespread environmental pollutant primarily due to the agricultural and industrial use of Cd and its associated compounds [1,2]. Cd-contaminated food and tobacco smoke are the major sources of Cd intake for the general population [3]. The kidney is particularly affected by Cd, as even low-level Cd exposure can result in renal tubular damage, which is characterized by increased urinary excretion of low-molecular-weight proteins or intracellular tubular enzymes [4–
6]. To prevent these negative effects of Cd on human health, a reference level for Cd should be established based on sensitive indices of Cd exposure-related health effects. The Cd content in urine (U-Cd) is an index of internal Cd burden, and dose-response relationships between U-Cd and indicators of renal dysfunction, such as urinary b2-microglobulin (U-b2M) concentration and N-acetyl-b
-D-glucosaminidase activity (U-NAG), have been found among people in both Cd-polluted and non-Cd-polluted areas [7–12]. Various methods have been used to estimate the U-Cd thresholds for Cd-induced renal tubular effects and have demonstrated large variations among people in different countries (0.3–10 mg/g cr) [3,13].
monopropyl ether, etc.) [15]. However, this approach has not been appropriately applied to assess Cd exposure in the Chinese population, particularly among women.
Women are at high risk of suffering from Cd-related health effects [5,17–19]. In the present study, we included non-smoking women aged 35–54 in two typical Cd-polluted areas in China and their corresponding controls (i.e., women from non-Cd-polluted areas). All participants in the present study engaged in farming as an occupation and did not have occupational Cd exposure. BMDs and BMDLs of U-Cd were tested for Cd-induced kidney effects to provide evidence for the prevention and control of environmental Cd exposure.
Materials and Methods
This research was approved by the Ethics Committee of Tongji Medical College of Huazhong University of Science and Technology (IORG No: IORG0003571). The participants were informed about the purpose and methods of the study, and each participant provided written informed consent. This study was based on data collected through two epidemiological investigations, one of which was launched in county A (CA) in 2011, and the other of which was launched in county B (CB) in 2006.
Study Area
CA and CB are both located in south-central China. In 1980, a smelter was established in CA. This smelter was the largest in this area during the study period, with an annual copper production of approximately 400,000 tons. Over the past 20 years, industrial wastewater was used for irrigation of local farmlands, resulting in serious Cd pollution of soils and contamination of rice crops. Three villages approximately 2–3 km on the leeward side of the smelter (Cd-polluted areas) and two comparable villages approximately 10 km in the opposite direction from the smelter (controls) were selected. A non-ferrous smelter was established in CB in 1960. Three villages in CB were selected, including two villages located
approximately 2–4 km on the leeward side of the smelter (Cd-polluted areas) and one comparable village approximately 30 km in the opposite direction from the smelter (control).
Study Population
occupation. Those exposed to occupational Cd (or other toxic metals, such as lead and mercury) were excluded. Smokers were also excluded. A questionnaire designed by our team specifically for this study was used to collect data on the demographics of all participants, and the entire questionnaire was administered by interviewers.
Sample Collection and Analysis
Morning urine samples (first sample after the first morning void) of
approximately 50–100 mL were collected from all subjects. The samples were collected in 250 mL polyethylene bottles that were soaked in 3 mol/L nitric acid for 16 h and rinsed in deionized water prior to ruse. Each sample was then divided equally and stored in three tubes, one of which had crystalline sodium carbonate on the tube wall for pH adjustment to stabilize U-b2M. The second tube was used
for Cd analysis and the third tube was used for the determination of U-NAG activity and creatinine (Cr) concentration. All urine samples were stored and frozen at 280
˚
C until further analysis. U-b2M was detected throughradio-immunoassay, whereas U-Cd concentration was determined by graphite-furnace atomic absorption spectrometry (SpectrAA-240FS; Varian, Palo Alto, CA, USA) [20]. The detection limit of Cd in urine was 0.05 mg/L, and none of the subjects had values below this limit. The relative standard deviation of the precision test was 4.5–7.9% (n55), and the recovery of standard addition was 94.8–98.3%.
U-b2M kits were purchased from the Chinese Academy of Science. U-NAG was
measured as previously described by Tucker et al. [20,21]. Substrate and standard were purchased from Sigma. The amount of urinary Cr was determined by using a modified Jaffe reaction method [22]. Concentrations of urinary substances were expressed in corrected Cr units (/g cr). The levels of U-Cd and U-b2M were
expressed in units of mg/g cr, and U-NAG was expressed in units of U/g cr. The accuracy of each analysis was evaluated using duplicate measurements. All samples were tested in duplicate.
Statistical Analysis
The levels of the three urinary Cd substances were confirmed to fit a log-normal distribution. Thus, geometric mean (GM) and geometric standard deviation (GSD) were adopted to represent the distributions. Age was presented as the arithmetic mean and standard deviation. Differences in age and U-Cd, U-b2M,
and U-NAG values between the two groups were analyzed using the Student’s t -test. The chi-square test was used to analyze the significance of the linear trend in Cd-induced kidney damage. Linear regression was used to analyze the relationship among the three urinary substances. In the multiple regression models, U-b2M
and U-NAG, which are two sensitive indicators of renal tubular dysfunction, were regarded as dependent variables, whereas age and U-Cd were considered as explanatory variables. In the logistic regression model, U-b2M and U-NAG were
excretion were considered as explanatory variables (continuous variables). The analyses were conducted using SPSS version 18 (SPSS Inc., Chicago, IL, USA).
The corresponding 84thand 90th percentiles of Cd effect indicators of subjects living in the control areas were regarded as the cut-off values, as shown inTable 1. The values of BMD and BMDL were calculated using the Benchmark Dose Software (version 2.0) provided by the U.S. Environmental Protection Agency. An extra type of BMR of 0.05 or 0.10 was adopted in the BMD application. The BMD and BMDL values were calculated using a quantal-linear model as follows: P[response] 5 background+ [1 – background] 6 [1 – EXP (– slope6 dose)].
Results
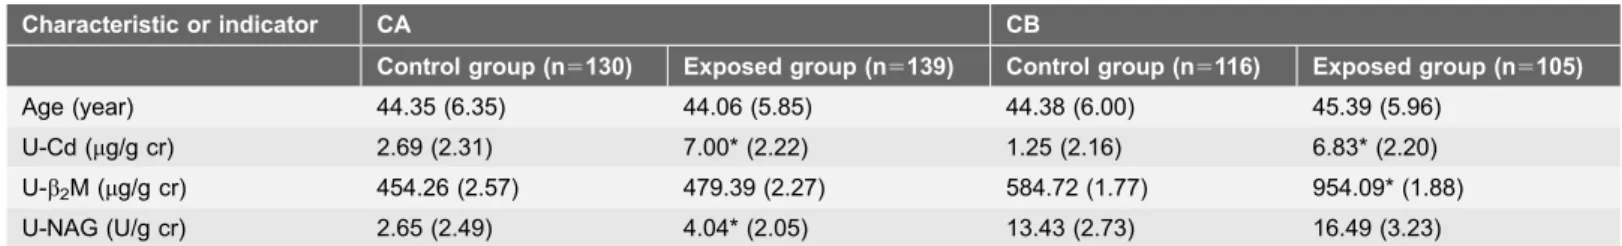
A total of 490 subjects were enrolled in the study, including 130 in the CA control group and 139 in the CA Cd-polluted group, as well as 116 in the CB control group and 105 in the CB Cd-polluted group. The mean ages and concentrations of U-Cd, U-NAG, and U-b2M of the subjects grouped by residence are shown in
Table 2. In CA, the mean age of the control group was 44.35 years, which was not significantly different from that of the Cd-exposed group (44.06 years; t50.389; P50.698). The GM (GSD) of U-Cd was 7.00 (2.22) mg/g cr in the Cd-exposed group, which was significantly higher than that in the control group (2.69 [2.31]
mg/g cr; t59.608,P,0.01). The GM (GSD) of U-NAG in the Cd-exposed group was also higher than that of the control group (4.04 vs. 2.65 U/g cr; t54.251; P,0.05), whereas the difference in the U-b2M level between the two groups did not reach significance (t50.050; P50.618). In CB, the mean ages of the control and Cd-exposed groups were 44.38 and 45.39 years, respectively (t521.245, P50.214). The GMs (GSDs) of U-Cd and U-b2M were 1.25 (2.16) mg/g cr and 584.72 (1.77)mg/g cr in the control group, respectively, which were notably lower than the counterpart values of 6.83 (2.20)mg/g cr and 954.09 (1.88)mg/g cr in the Cd-exposed group (U-Cd:t5216.215;P,0.01; U-b2M:t526.063;P,0.01). No significant difference in U-NAG activities was observed between the two groups (t51.398, P50.164). Multiple linear regression analysis and logistic regression analysis showed that U-b2M and U-NAG were positively associated with U-Cd
among CA and CB subjects, and age was not associated with either U-b2M or
U-NAG (as shown in Tables 3 and 4).
To further elucidate the relationship between the indicators of renal function (U-b2M and U-NAG) and Cd exposure, U-b2M and U-NAG concentrations were
compared among U-Cd intervals grouped based on the three corresponding quartiles. As shown inTables 5and6, an obvious increase in U-b2M and U-NAG
occurred as U-Cd increased. As shown in Table 5, the 84th percentiles of U-b2M
and UNAG of the control group were established as the thresholds of
hyper-U-b2M and hyper-U-NAG, respectively. As shown inTable 6, the 90thpercentiles of
U-b2M and UNAG of the control group were established as the thresholds of
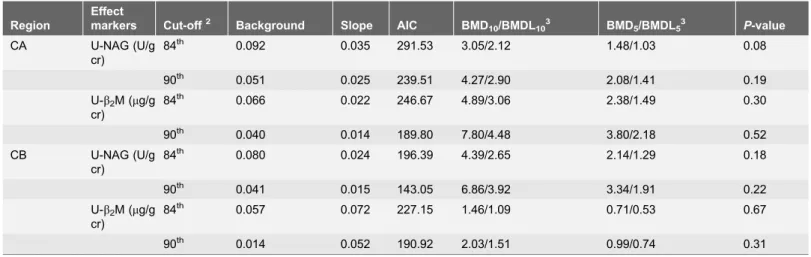
The BMD and BMDL results obtained using the quantal-linear model with the predetermined cut-off values and BMRs of 0.05 or 0.10 are shown in Table 7. Corresponding to a predetermined BMR of 0.10, with the 84thand 90thpercentiles of the control group defined as the cut-off values, the Cd BMDLs based on U-NAG for the CA subjects were 2.12 and 2.90 mg/g cr, respectively, and those for the CB subjects were 2.65 and 3.92 mg/g cr, respectively. Corresponding to a predetermined BMR of 0.05, with the 84th and 90thpercentiles of the control group defined as the cut-off values, the U-Cd BMDLs based on U-NAG for subjects in CA were 1.03 and 1.41 mg/g cr, respectively, and those for subjects in CB were 1.29 and 1.91 mg/g cr, respectively. Corresponding to a predetermined BMR of 0.10, with the 84thand 90thpercentiles of the control group defined as the cut-off values, the U-Cd BMDLs based on U-b2M for CA subjects were 3.06 and
4.48 mg/g cr, respectively, and those for CB subjects were 1.09 and 1.51 mg/g cr, respectively. Corresponding to a predetermined BMR of 0.05, with the 84th and 90thpercentiles of the control group defined as the cut-off values, the U-Cd BMDLs based on U-b2M for subjects in CA were 1.49 and 2.18 mg/g cr,
respectively, and those for subjects in CB were 0.53 and 0.74 mg/g cr, respectively.
Table 1.Cut-off values of U-b2M and U-NAG for subjects in county A (CA) and county B (CB).
Variable Region Cut-off value
N 84thpercentile 90thpercentile
U-b2M (mg/g cr) CA 130 1065.95 1541.33
CB 116 1045.96 1268.95
U-NAG (U/g cr) CA 130 5.67 6.42
CB 116 40.90 53.38
U-b2M, urinary level ofb2-microglobulin; U-NAG, urinary level of N-acetyl-b-D-glucosaminidase
doi:10.1371/journal.pone.0115794.t001
Table 2.Means (SD/GSD) of age, U-Cd, U-b2M, and U-NAG of 269 participants in county A (CA) and 225 participants in county B (CB)g.
Characteristic or indicator CA CB
Control group (n5130) Exposed group (n5139) Control group (n5116) Exposed group (n5105)
Age (year) 44.35 (6.35) 44.06 (5.85) 44.38 (6.00) 45.39 (5.96)
U-Cd (mg/g cr) 2.69 (2.31) 7.00* (2.22) 1.25 (2.16) 6.83* (2.20) U-b2M (mg/g cr) 454.26 (2.57) 479.39 (2.27) 584.72 (1.77) 954.09* (1.88) U-NAG (U/g cr) 2.65 (2.49) 4.04* (2.05) 13.43 (2.73) 16.49 (3.23)
gValues of U-Cd, U-b2M, and U-NAG are expressed as GM and GSD, and values of age were calculated by arithmetic mean and SD.
*Compared with the control group,P,0.01.
U-b2M, urinary level ofb2-microglobulin; U-NAG, urinary level of N-acetyl-b-D-glucosaminidase; U-Cd, urinary level of cadmium; GM, geometric mean; GSD, geometric standard deviation; SD, standard deviation.
Discussion
The negative effects of Cd on human health are typically manifested in the kidney. Cd exposure can cause both tubule and cellular damage in the kidney, which is characterized by the increased excretion of low-molecular-weight proteins, such as U-b2M, and intracellular tubular enzymes, such as U-NAG [23–25]. Thus, the
levels of these two substances in urine were selected as indicators of renal function in this study.
Previous studies revealed that U-Cd values were associated with factors such as gender, age, smoking habits, and occupational exposure. Women were reportedly
Table 3.Results of the multiple linear regression analysis on individual factors related to Cd-induced renal tubular damage.
Region Effect markers Explanatory variables B2 95% CI3 Beta4 P-value
CA U-b2M (mg/g cr)1 U-Cd (mg/g cr)1 0.159 (0.047, 0.270) 0.170
,0.05 Age (years) 0.006 (20.001, 0.014) 0.057 0.110 U-NAG (U/g cr)1 U-Cd (
mg/g cr)1 0.257 (0.153, 0.361) 0.290
,0.001 Age (years) 20.001 (20.008, 0.006) -0.013 0.833 CB U-b2M (mg/g cr)1 U-Cd (mg/g cr)1 0.292 (0.227, 0.356) 0.519 ,0.001
Age (years) 0.001 (20.004, 0.007) 0.027 0.646 U-NAG (U/g cr)1 U-Cd (mg/g cr)1 0.261 (0.140, 0.381) 0.276
,0.001
Age (years) 0.010 (0.000, 0.020) 0.131 0.063
1
U-b2M, U-NAG and U-Cd were natural log-transformed.
2
B: Un-standardized partial regression coefficients.
3
CI: Confidence interval.
4Beta: Standardized partial regression coefficients.
CA, county A; CB, county B; U-b2M, urinary level ofb2-microglobulin; U-NAG, urinary level of N-acetyl-b-D-glucosaminidase; U-Cd, urinary level of cadmium.
doi:10.1371/journal.pone.0115794.t003
Table 4.Results of the logistic regression analysis on individual factors related to Cd-induced renal tubular damage.
Region Effect markers Explanatory variables5 84thcutoff1 90thcutoff2
OR3(95% CI4) OR3(95% CI4)
CA U-b2M (mg/g cr) U-Cd (mg/g cr) 1. (1.011, 1.100) 1.056* (1.008, 1.107) Age (years) 1.040 (0.986, 1.096) 1.014 (0.952, 1.080) U-NAG (U/g cr) U-Cd (mg/g cr) 1.095** (1.050, 1.143) 1.097** (1.050, 1.145)
Age (years) 0.993 (0.946, 1.041) 0.992 (0.940, 1.046) CB U-b2M (mg/g cr) U-Cd (mg/g cr) 1.197** (1.124, 1.274) 1.156** (1.095, 1.220)
Age (years) 1.003 (0.949, 1.060) 0.991 (0.932, 1.054) U-NAG (U/g cr) U-Cd (mg/g cr) 1.074** (1.024, 1.126) 1.075** (1.019, 1.135)
Age (years) 1.008 (0.949, 1.070) 1.063 (0.985, 1.148)
1, 2
Cut-off values of U-b2M or U-NAG were defined as the 84thor 90thpercentile values, which were calculated in subjects from Cd-non-polluted areas.
3OR: Odds ratio. 4CI: Confidence interval.
5Explanatory variables were used as continuous variables.
**P,0.01, *P,0.05.
CA, county A; CB, county B; U-b2M, urinary level ofb2-microglobulin; U-NAG, urinary level of N-acetyl-b-D-glucosaminidase; U-Cd, urinary level of cadmium.
more susceptible to Cd exposure than men, with higher Cd contents observed in the urine and kidney cortex of women [19,26,27]. In addition, this trend may be attributed to increased dietary Cd absorption in women with low iron stores due to menstruation [28–30]. Smokers were found to have U-Cd concentrations approximately two to five times higher than that of nonsmokers [5,31–33]. Suwazono et al. suggested that individual age should be considered when estimating the threshold value of U-Cd [34]. Thus, in this study, non-smoking
Table 5.Prevalence of hyper-U-b2M and hyper-U-NAG corresponding to U-Cd intervals among subjects in county A (CA) and county B (CB) at different cadmium exposure levels1.
U-Cd intervals
(mg/g cr)2 CA CB
Hyper-U-NAG Hyper-U-b2M Hyper-U-NAG Hyper-U-b2M
Median (U-Cd)
(mg/g cr) +/2 % +/2 %
Median (U-Cd)
(mg/g cr) +/2 % +/2 %
,Q1 1.44 11/56 16.41 5/62 7.46 0.72 3/52 5.45 6/49 10.91
Q1–Q2 3.43 8/60 11.76 9/59 13.24 1.72 10/45 18.18 10/45 18.18
Q2–Q3 5.97 20/47 29.85 16/51 23.88 3.80 8/48 14.28 13/43 23.21
.Q3 13.80 30/37 44.78 18/49 26.86 12.36 17/38 30.90 35/20 65.45
Total 4.47 69/200 25.65 48/221 17.84 2.86 38/183 17.19 64/157 28.96
Linear trend test
x2517.622,P,0.001 x2510.807,P50.001 x2510.073,P50.002 x2535.370,P,0.001
1The 84thpercentiles of U-b2M and U-NAG values of the control group were assumed as the thresholds of hyper-U-b2M and hyper-U-NAG, respectively. 2U-Cd intervals were divided according to the three corresponding quartiles (i.e., Q
152.38mg/g cr,Q254.47mg/g cr, and Q358.59mg/g cr in CA; and
Q151.16mg/g cr,Q252.86mg/g cr, and Q356.88mg/g cr in CB).
U-b2M, urinary level ofb2-microglobulin; U-NAG, urinary level of N-acetyl-b-D-glucosaminidase; U-Cd, urinary level of cadmium.
doi:10.1371/journal.pone.0115794.t005
Table 6.Prevalence of hyper-U-b2M and hyper-U-NAG corresponding to U-Cd intervals among subjects from county A (CA) and county B (CB) at different cadmium exposure levels1.
U-Cd intervals
(mg/g cr)2 CA CB
Hyper-U-NAG Hyper-U-b2M Hyper-U-NAG Hyper-U-b2M
Median of
U-Cd (mg/g cr) +/2 % +/2 %
Median of
U-Cd (mg/g cr) +/2 % +/2 %
,Q1 1.44 8/59 11.94 3/64 4.08 0.72 2/53 3.64 2/53 3.64
Q1–Q2 3.43 5/63 7.35 6/62 6.67 1.72 6/49 10.91 8/47 14.55
Q2–Q3 5.97 11/56 16.42 10/57 17.39 3.80 3/53 5.36 8/48 14.28
.Q3 13.80 24/43 35.82 12/55 15.09 12.36 12/43 21.82 27/28 49.10
Total 4.47 48/221 17.84 31/238 11.52 2.86 23/198 10.41 45/176 20.36
Linear trend test
x2
514.876,P,0.001 x2
57.055,P50.008 x2
57.015,P50.008 x2
531.194,P,0.001
1The 90thpercentiles of U-b2M and U-NAG of the control group were assumed as the thresholds of hyper-U-b2M and hyper-U-NAG, respectively. 2
U-Cd intervals were divided according to the three corresponding quartiles (i.e., Q152.38mg/g cr,Q254.47mg/g cr, and Q358.59mg/g cr in CA; and
Q151.16mg/g cr,Q252.86mg/g cr, and Q356.88mg/g cr in CB).
U-b2M, urinary level ofb2-microglobulin; U-NAG, urinary level of N-acetyl-b-D-glucosaminidase; U-Cd, urinary level of cadmium.
women aged 35–54 years and without occupational Cd exposure were included. Women of this age were at a high risk of Cd exposure. According to our findings, age was not associated with U-NAG and U-b2M. We speculated that the variable
of age did not show any effect because of the narrow age range of participants included in this study. After controlling for age, the levels of U-b2M and U-NAG
were found to be significantly associated with U-Cd concentrations. Similar dose-response relationships between U-Cd and indicators of renal function were reported in many other studies conducted on Cd-polluted or non-polluted areas [7–9,11].
In BMD estimations, we regarded the subjects living in Cd-non-polluted areas as controls. Both controls in CA and CB were exposed to Cd at low levels, similar to a previous study [7], and thus, these women were not strict non-exposed controls. Cd exposure in Asia (e.g., China, Japan) is more serious than that in Europe and the United States. The rapid development of polluting industries has resulted in contamination of soils with Cd, thereby leading to contamination of field crops with Cd. Therefore, people may have a diet with some Cd intake [35]. Unlike in animal experiments, a perfect control with no Cd exposure seems impossible in population studies. Contrary to NOAEL, the BMD method does not need to calculate the abnormality rate for the control subjects, which is an important advantage of the BMD approach [13,34]. The probability of adverse response at zero exposure was estimated based on the cut-off value of the control group. The exposure level was then calculated in such a way that a certain change in response compared with the background was expected. In this sense, the BMD/ BMDL calculations were more accurate and provided more information. The use
Table 7.Benchmark dose (BMD) estimates of U-Cd levels based on U-b2M and U-NAG using a quantal-linear model1.
Region
Effect
markers Cut-off2 Background Slope AIC BMD
10/BMDL103 BMD5/BMDL53 P-value
CA U-NAG (U/g cr)
84th 0.092 0.035 291.53 3.05/2.12 1.48/1.03 0.08
90th 0.051 0.025 239.51 4.27/2.90 2.08/1.41 0.19
U-b2M (mg/g cr)
84th 0.066 0.022 246.67 4.89/3.06 2.38/1.49 0.30
90th 0.040 0.014 189.80 7.80/4.48 3.80/2.18 0.52
CB U-NAG (U/g cr)
84th 0.080 0.024 196.39 4.39/2.65 2.14/1.29 0.18
90th 0.041 0.015 143.05 6.86/3.92 3.34/1.91 0.22
U-b2M (mg/g cr)
84th 0.057 0.072 227.15 1.46/1.09 0.71/0.53 0.67
90th 0.014 0.052 190.92 2.03/1.51 0.99/0.74 0.31
1
Quantal-linear model:P[response]5background+[1 – background]6[1 – EXP (– slope6dose)].
2
The cut-off value is either the 84thor 90thpercentile of U-b2M or U-NAG levels in Cd non-exposed subjects (i.e., the control group).
3
BMD10and BMDL10values correspond to a predetermined BMR of 0.10; BMD05and BMDL05values correspond to a predetermined BMR of 0.05; BMDL is
the lower 95% confidence limit of BMD.
U-b2M, urinary level ofb2-microglobulin; U-NAG, urinary level of N-acetyl-b-D-glucosaminidase; U-Cd, urinary level of cadmium; CA, county A; CB, county B; BMD, benchmark dose; BMDL, 95% lower confidence bounds of benchmark dose.
of different models and points to study the BMD for Cd can also provide more evidence for the control and prevention of human Cd exposure. In the BMD procedure, we used the quantal-linear model, which has been used in previous risk assessments of Cd exposure [36]. In addition, the most important reason for using BMD is that the model provides a good fit to the present data (results using other models not shown). Therefore, the quantal-linear model was selected to estimate the critical concentration of U-Cd in this study.
U-b2M and U-NAG were measured as sensitive indicators of renal tubular damage in our study. Slightly increased urinary excretion of U-b2M between 300 and 1000 mg/g cr might be reversible after removal of Cd exposure [37–39]. However, this assumption remains under debate. Liang et al. investigated the change in renal function after reducing Cd exposure. In this study, 412 individuals were examined in 1998 and eight years later. The study revealed that U-b2M increased from 120–160 mg/g cr in non-Cd-polluted areas, from 160–280 mg/g cr in moderate-Cd-polluted areas and from 280–420 mg/g cr in high-Cd-polluted areas [35]. Nevertheless, a consensus exists that severely increased urinary excretion of U-b2M over 1000 mg/g cr is irreversible. Kido et al. conducted a five-year follow-up study and found that almost all individuals who had U-b2M levels over 1000 mg/g cr in the first examination exhibited renal deterioration [40]. Other researchers also confirmed that the critical value of reversible U-NAG has yet to be fully elucidated [40–44]. In this study, we adopted the 84th and 90th percentiles of renal function indicators (i.e., U-b2M and U-NAG) of the non-exposed subjects as cut-off values. The 84th percentiles of U-b2M were 1065.95 mg/g cr and 1045.96 mg/g cr for the control subjects in CA and CB, respectively. The values were nearly equal to the robust irreversible value of 1000 mg/g cr. The cut-off values estimated from the Cd-non-exposed subjects were slightly higher than those reported in Europe and the United States, the reasons for which have been discussed above.
According to the studies of Hayano et al. and Ishizaki et al., the U-Cd
thresholds were 3.8–4.1 mg/g cr and 2.3–4.6 mg/g cr based on the U-b2M values of subjects living in the Cd-polluted Kakehashi River basin [7]. Shimizu et al. estimated the U-Cd threshold to be 1.5–3.6 mg/g cr based on the U-b2M excretions of 1865 women in Cd-polluted regions of the Kakehashi River basin in Japan [36]. Kobayashi et al. reported a U-Cd threshold of 1.6mg/g cr based on the U-b2M values of 723 women in a Cd-non-polluted area in Japan [45]. Hong et al. conducted a study involving a general population in China and determined that the BMD/BMDL of U-Cd was 1.05/0.88 mg/g cr with a predetermined BMR of 10% [46]. Suwazono et al. presented a low U-Cd BMD (BMDL) of 0.6–1.1 (0.5– 0.8)mg/g cr based on the U-NAG values of 820 Swedish women aged 53–64 years [13]. In the present study, the BMDL values of U-Cd based on U-b2M were
1.84 mg/g cr in CA and 0.57 mg/g cr in CB, with the 84thpercentiles designated as cut-off values, whereas the BMDL values of U-Cd based on U-NAG were 1.19 mg/ g cr in CA and 1.37 mg/g cr in CB, with the 84th percentiles designated as cut-off values. In our previous report, a different reference group (i.e. those with U-Cd of
both sets of data from CA and CB subjects, to present either LogProbit or LogLogistic Models according to the AIC values. The U-Cd levels were divided into intervals of ,2.00mg/g cr, 2.01–4.00mg/g cr, 4.01–10.00mg/g cr, and
.10.00 mg/g cr [47]. The findings of both reports are similar to those of
Suwazono et al. and Jin et al. [13,46]. The results of our study and other studies suggest an increased health risk with U-Cd levels exceeding 1 mg/g cr.
An interesting finding of this study was that the cut-off points for U-NAG (i.e., the 84th percentile of 5.62 U/g cr in the CA population and 40.96 U/g cr in the CB population, as well as the 90th percentile of 6.42 U/g cr in the CA population and 53.38 U/g cr in the CB population) were significantly different. Although the methods used for U-NAG detection, including the testing technology and equipment, were the same, the reagents used in the analysis had different batch numbers. We found that during the CB investigation, all urine samples were immediately divided into several parts for various measurements after their collections. All samples were then transported in cold chain to our institution for laboratory tests. All samples were stored at 280
˚
C until analysis. During the CA investigation, all urine samples were collected and soon transported in cold chain to our institution. The samples were then divided to several parts and stored at280
˚
C until analysis. The CB area is nearer (with a distance of approximately 110 km) to our institution than the CA area (approximately 520 km). We believe that the most plausible reason for the difference in results for U-NAG cut-off values was that the cold chain was not completely ensured during the long journey from CA to our institution, and hence, the activities of U-NAG in CA urine samples may have been impaired to some extent. Thus, we reconsidered the comparability of the two sets of data from CA and CB, respectively. We believe that direct comparison was unsuitable. For the stability of U-Cd, we selected two representative controls for CA and CB data. Moreover, in this research,uncertainty existed in the test results for U-NAG, which may not be a stable effect marker. This condition is also a reminder to other researchers that more attention should be given to this problem. Nevertheless, our study can provide some scientific evidence to aid in the decision-making of governmental departments responsible for supervising environmental Cd pollution and public health. The data could be used for scientific exploration but are insufficient for the clinical diagnosis of Cd-induced renal damage.
Author Contributions
Conceived and designed the experiments: QW JC LY YZ. Performed the
experiments: JH ML TH. Analyzed the data: QW. Contributed reagents/materials/ analysis tools: JH ML TH. Wrote the paper: JH.
References
1. Satarug S, Baker JR, Urbenjapol S, Haswell-Elkins M, Reilly PE, et al.(2003) A global perspective on cadmium pollution and toxicity in non-occupationally exposed population. Toxicology letters 137: 65–83.
2. Cho YA, Kim J, Woo HD, Kang M(2013) Dietary cadmium intake and the risk of cancer: a meta-analysis. PLoS One 8: e75087.
3. Suwazono Y, Uetani M, A˚ kesson A, Vahter M(2010) Recent applications of benchmark dose method for estimation of reference cadmium exposure for renal effects in man. Toxicology letters 198: 40–43.
4. A˚ kesson A, Lundh T, Vahter M, Bjellerup P, Lidfeldt J, et al.(2005) Tubular and glomerular kidney effects in Swedish women with low environmental cadmium exposure. Environmental health
perspectives: 1627–1631.
5. Ja¨rup L, A˚ kesson A(2009) Current status of cadmium as an environmental health problem. Toxicology and applied pharmacology 238: 201–208.
6. Satarug S, Garrett SH, Sens MA, Sens DA (2011) Cadmium, environmental exposure, and health outcomes. Cieˆncia & Sau´de Coletiva 16: 2587–2602.
7. Ishizaki M, Kido T, Honda R, Tsuritani I, Yamada Y, et al.(1989) Dose-response relationship between urinary cadmium and beta2-microglobulin in a Japanese environmentally cadmium exposed population. Toxicology 58: 121–131.
8. Gamo M, Ono K, Nakanishi J (2006) Meta-analysis for deriving age-and gender-specific dose– response relationships between urinary cadmium concentration and beta2-microglobulinuria under environmental exposure. Environmental research 101: 104–112.
9. Bernard A, Thielemans N, Roels H, Lauwerys R(1995) Association between NAG-B and cadmium in urine with no evidence of a threshold. Occupational and environmental medicine 52: 177–180.
10. Yamanaka O, Kobayashi E, Nogawa K, Suwazono Y, Sakurada I, et al.(1998) Association between renal effects and cadmium exposure in cadmium-nonpolluted area in Japan. Environmental research 77: 1–8.
11. Suwazono Y, Kobayashi E, Okubo Y, Nogawa K, Kido T, et al. (2000) Renal effects of cadmium exposure in cadmium nonpolluted areas in Japan. Environmental research 84: 44–55.
12. Hayano M, Nogawa K, Kido T, Kobayashi E, Honda R, et al. (1996) Dose-response relationship between urinary cadmium concentration and beta2-microglobulinuria using logistic regression analysis. Arch Environ Health 51: 162–167.
13. Suwazono Y, Sand S, Vahter M, Filipsson AF, Skerfving S, et al. (2006) Benchmark dose for cadmium-induced renal effects in humans. Environmental health perspectives: 1072–1076.
14. Crump KS(1984) A new method for determining allowable daily intakes. Toxicological Sciences 4: 854– 871.
15. Crump KS, Allen B, Faustman E (1995) The use of the benchmark dose approach in health risk assessment. Risk Assessment Forum, US Environmental Protection Agency.
16. Filipsson AF, Sand S, Nilsson J, Victorin K(2003) The benchmark dose method-review of available models, and recommendations for application in health risk assessment. Critical Reviews in Toxicology 33: 505–542.
18. Trzcinka-Ochocka M, Jakubowski M, Razniewska G, Halatek T, Gazewski A(2004) The effects of environmental cadmium exposure on kidney function: the possible influence of age. Environmental research 95: 143–150.
19. Vahter M, A˚ kesson A, Lide´n C, Ceccatelli S, Berglund M(2007) Gender differences in the disposition and toxicity of metals. Environmental research 104: 85–95.
20. Jin T, Nordberg M, Frech W, Dumont X, Bernard A, et al.(2002) Cadmium biomonitoring and renal dysfunction among a population environmentally exposed to cadmium from smelting in China (ChinaCad). Biometals 15: 397–410.
21. Tucker SM, Boyd P, Thompson A, Price R(1975) Automated assay of N-acetyl-b-GLucosaminidase in normal and pathological human urine. Clinica Chimica Acta 62: 333–339.
22. Bonsnes RW, Taussky HH(1945) On the colorimetric determination of creatinine by the Jaffe reaction. Journal of Biological Chemistry 158: 581–591.
23. Bernard A(2004) Renal dysfunction induced by cadmium: biomarkers of critical effects. Biometals 17: 519–523.
24. Moriguchi J, Inoue Y, Kamiyama S, Horiguchi M, Murata K, et al. (2009) N-acetyl-b -GLucosaminidase (NAG) as the most sensitive marker of tubular dysfunction for monitoring residents in non-polluted areas. Toxicology letters 190: 1–8.
25. Mueller P, Smith S, Steinberg K, Thun M (1989) Chronic renal tubular effects in relation to urine cadmium levels. Nephron 52: 45–54.
26. Hellstro¨m L, Persson B, Brudin L, Grawe´ KP, O¨ born I, et al.(2007) Cadmium exposure pathways in a population living near a battery plant. Science of the total Environment 373: 447–455.
27. Olsson M, Bensryd I, Lundh T, Ottosson H, Skerfving S, et al.(2002) Cadmium in blood and urine— impact of sex, age, dietary intake, iron status, and former smoking—association of renal effects. Environmental health perspectives 110: 1185.
28. Gallagher CM, Chen JJ, Kovach JS(2011) The relationship between body iron stores and blood and urine cadmium concentrations in US never-smoking, non-pregnant women aged 20–49 years. Environmental research 111: 702–707.
29. Julin B, Vahter M, Amzal B, Wolk A, Berglund M, et al.(2011) Relation between dietary cadmium intake and biomarkers of cadmium exposure in premenopausal women accounting for body iron stores. Environ Health 10: 10.1186.
30. Kippler M, Ekstro¨m E-C, Lo¨nnerdal B, Goessler W, A˚ kesson A, et al.(2007) Influence of iron and zinc status on cadmium accumulation in Bangladeshi women. Toxicology and applied pharmacology 222: 221–226.
31. Galaz˙yn-Sidorczuk M, Brzo´ska MM, Moniuszko-Jakoniuk J(2008) Estimation of Polish cigarettes contamination with cadmium and lead, and exposure to these metals via smoking. Environmental monitoring and assessment 137: 481–493.
32. Ju Y-R, Chen W-Y, Liao C-M(2012) Assessing human exposure risk to cadmium through inhalation and seafood consumption. Journal of hazardous materials 227: 353–361.
33. Satarug S, Moore MR (2004) Adverse health effects of chronic exposure to low-level cadmium in foodstuffs and cigarette smoke. Environmental health perspectives 112: 1099.
34. Bernard A(2008) Cadmium & its adverse effects on human health. Indian Journal of Medical Research 128: 557.
35. Liang Y, Lei L, Nilsson J, Li H, Nordberg M, et al.(2012) Renal function after reduction in cadmium exposure: an 8-year follow-up of residents in cadmium-polluted areas. Environmental health
perspectives 120: 223.
36. Shimizu A, Kobayashi E, Suwazono Y, Uetani M, Oishi M, et al.(2006) Estimation of benchmark doses for urinary cadmium based onb2-microglobulin excretion in cadmium-polluted regions of the Kakehashi River basin, Japan. International journal of environmental health research 16: 329–337.
38. Hotz P, Buchet J-P, Bernard A, Lison D, Lauwerys R(1999) Renal effects of low-level environmental cadmium exposure: 5-year follow-up of a subcohort from the Cadmibel study. The Lancet 354: 1508– 1513.
39. Ja¨rup L, Berglund M, Elinder CG, Nordberg G, Vanter M(1998) Health effects of cadmium exposure– a review of the literature and a risk estimate. Scandinavian journal of work, environment & health: 1–51.
40. Kido T, Honda R, Tsuritani I, Yamaya H, Ishizaki M, et al.(1988) Progress of renal dysfunction in inhabitants environmentally exposed to cadmium. Archives of Environmental Health: An International Journal 43: 213–217.
41. Iwata K, Saito H, Moriyama M, Nakano A (1993) Renal tubular function after reduction of environmental cadmium exposure: a ten-year follow-up. Archives of Environmental Health: An International Journal 48: 157–163.
42. Kobayashi E, Suwazono Y, Honda R, Dochi M, Nishijo M, et al.(2008) Changes in renal tubular and glomerular functions and biological acid–base balance after soil replacement in Cd-polluted rice paddies calculated with a general linear mixed model. Biological trace element research 124: 164–172.
43. Prozialeck WC, Edwards JR (2010) Early biomarkers of cadmium exposure and nephrotoxicity. Biometals 23: 793–809.
44. Kobayashi E, Suwazono Y, Uetani M, Inaba T, Oishi M, et al.(2006) Estimation of benchmark dose as the threshold levels of urinary cadmium, based on excretion of total protein, beta2-microglobulin, and N-acetyl-b-GLucosaminidase in cadmium nonpolluted regions in Japan. Environmental research 101: 401– 406.
45. Kobayashi E, Suwazono Y, Uetani M, Inaba T, Oishi M, et al.(2006) Estimation of benchmark dose for renal dysfunction in a cadmium non-polluted area in Japan. Journal of Applied Toxicology 26: 351–355.
46. Hong F, Jin T, Zhang A(2004) Risk assessment on renal dysfunction caused by co-exposure to arsenic and cadmium using benchmark dose calculation in a Chinese population. Biometals 17: 573–580.