Genetic Mapping and Comparative
Expression Analysis of Transcription Factors
in Cotton
Xuemei Chen, Xin Jin, Ximei Li, Zhongxu Lin*
National Key Laboratory of Crop Genetic Improvement, Huazhong Agricultural University, Wuhan 430070, Hubei, China
Abstract
Transcription factors (TFs) play an important role in the regulation of plant growth and devel-opment. The study of the structure and function of TFs represents a research frontier in plant molecular biology. The findings of these studies will provide significant information re-garding genetic improvement traits in crops. Currently, a large number of TFs have been cloned, and their function has been verified. However, relatively few studies that genetically map TFs in cotton are available. To genetically map TFs in cotton in this study, specific primers were designed for TF genes that were published in the Plant Transcription Factor Database. A total of 977 TF primers were obtained, and 31 TF polymorphic loci were mapped on 15 cotton chromosomes. These polymorphic loci were clearly preferentially dis-tributed on chromosomes 5, 11, 19 and 20; and TFs from the same family mapped to homol-ogous cotton chromosomes.In-silicomapping verified that many mapped TFs were mapped on their corresponding chromosomes or their homologous chromosomes’ corre-sponding chromosomes in the diploid genomes. QTL mapping for fiber quality revealed that TF-Ghi005602-2 mapped on Chr19 was associated with fiber length. Eighty-five TF genes were selected for RT-PCR analysis, and 4 TFs were selected for qRT-PCR analysis, reveal-ing unique expression patterns across different stages of fiber development between the mapping parents. Our data offer an overview of the chromosomal distribution of TFs in cot-ton, and the comparative expression analysis betweenGossypium hirsutumandG. barba-denseprovides a rough understanding of the regulation of TFs during cotton fiber
development.
Introduction
Transcription factors (TFs) are a class of the most widely studied and important trans-acting factors, regulating gene expression at the transcriptional level. A typical TF from a higher-order plant typically contains a DNA-binding domain, a transcription regulation domain, an oligomerization site, and a nuclear localization domain [1]. TFs play an important role in the
a11111
OPEN ACCESS
Citation:Chen X, Jin X, Li X, Lin Z (2015) Genetic Mapping and Comparative Expression Analysis of Transcription Factors in Cotton. PLoS ONE 10(5): e0126150. doi:10.1371/journal.pone.0126150
Academic Editor:David D Fang, USDA-ARS-SRRC, UNITED STATES
Received:January 8, 2015
Accepted:March 30, 2015
Published:May 6, 2015
Copyright:© 2015 Chen et al. This is an open access article distributed under the terms of the Creative Commons Attribution License, which permits unrestricted use, distribution, and reproduction in any medium, provided the original author and source are credited.
Data Availability Statement:All relevant data are within the paper and its Supporting Information files.
Funding:This work was financially supported by the Special Fund for Agro-scientific Research in the Public Interest (No. 201303008) and the National Science Foundation of China (No. 31371674).
regulation of plant growth and development, organ morphogenesis, secondary metabolism, hormonal signal transduction, and plant responses to various environmental stresses [2–7]. Therefore, it is likely that investigating and exploiting the function of TFs could provide an al-ternative approach for improving cotton fiber quality and production.
To date, a large number of TFs have been reported, and their functions have been succes-sively investigated and verified in cotton. Among them, the majority of research on TFs has fo-cused on the ethylene-response factor (ERF) family, myeloblastosis (MYB) family, WKRY family, and basic helix-loop-helix (bHLH) family. A large amount of research has confirmed that the MYB family plays a functional role in cotton fiber differentiation and development [8–13]. ERF genes are induced by biotic and abiotic stresses in cotton and are involved in regu-lating plant disease resistance pathways [14,15]. The bHLH family plays an important role in regulating plant secondary metabolism [16,17] and morphogenesis [6,7,18]. Plant WKRY TFs have important functions in the transcriptional regulation of a variety of biological processes that are related to growth and development [19–21], various environmental stimuli [22–24], and disease resistance pathways [25–27].
As of April 2012, approximately 1,116 TFs from 50 families were annotated inGossypium hirsutum(http://planttfdb.cbi.edu.cn/index.php?sp=Ghi). However, previous research has fo-cused mainly on identifying and verifying the biological functions of these TFs rather than their genomic distributions. In this study, the TFs were mapped to reveal their genomic distri-bution in cotton using specific primers designed based on transcription factor sequences avail-able in the Plant Transcription Factor Database (http://planttfdb.cbi.edu.cn/). We also confirmed their chromosomal location by in-silico mapping the experimental mapped TFs in two sequenced diploid genomes, A2genome ofG.arboretumand D5genome ofG.raimondii. QTL mapping was conducted to identify TFs related to fiber quality. RT-PCR and qRT-PCR analysis were also conducted to detect differences in expression during fiber development be-tweenG.hirsutumandG.barbadensein selected TFs from each family.
Materials and Methods
Plant materials
Polymorphisms of the designed TF primers were detected usingG.hirsutumcv. Emian22 and G.barbadenseacc. 3–79, which are the parents of the BC1mapping population [(Emian22 × 3– -79) × Emian22] [28,29], using single-strand conformation polymorphism (SSCP) with minor modifications [30]. The BC1population, which consisted of 141 plants, was used as the map-ping population for all of the polymorphic TF markers.
Marker development
PCR amplification and electrophoresis
Polymerase chain reaction (PCR) of the TF markers was performed in 10μL of solution
con-taining 25 ng DNA template, 1 × buffer, 2.0 mmol L-1MgCl2, 0.25 mmol L-1dNTPs, 0.16μmol
L-1forward primer, 0.16μmol L-1reverse primer, 0.8 units Taq DNA polymerase, and ddH2O
to a final volume of 10μl. PCR was performed using the following parameters: 95°C for 5 min;
Table 1. Distribution of TFs in various families.
Family No. Family No. Family No. Family No. Family No.
AP2 8 ARF 7 ARR-B 2 B3 23 BBR/BPC 6
BES1 7 C2H2 56 C3H 44 CAMTA 2 CO-like 4
CPP 2 DBB 12 Dof 22 E2F/DP 3 EIL 10
ERF 112 FAR1 7 G2-like 31 GATA 24 GRAS 46
GRF 13 GeBP 5 HB-other 15 HD-ZIP 40 HSF 17
LBD 14 M-type 2 MIKC 21 MYB 75 MYB_related 59
NAC 50 NF-YA 5 NF-YB 10 NF-YC 11 Nin-like 7
RAV 1 S1Fa-like 2 SBP 13 SRS 4 TALE 14
TCP 23 Trihelix 38 VOZ 5 WOX 6 WRKY 55
Whirly 1 YABBY 4 ZF-HD 15 bHLH 92 bZIP 71
doi:10.1371/journal.pone.0126150.t001
Fig 1. Primer design strategies for TFs.(a) TFs with one motif (GenBank acc No. Ghi003408); (b) TFs with two motifs (GenBank acc No. Ghi003040).*: Target sequence;>>>>>: Primer region.
34 cycles of 94°C for 50 sec, 56°C for 45 sec, and 72°C for 60 sec; and a final extension of 5 min at 72°C. The PCR products were then separated in an 8% non-denaturing polyacrylamide gel at a constant voltage of 15 W for approximately 4 h at room temperature. After electrophoresis, all of the DNA fragments were visualized by silver staining.
Experimental mapping and identification of TFs related to fiber quality
The polymorphic loci were integrated into the interspecific BC1genetic linkage map [29] using JoinMap V3.0 [31]. The logarithm of odds (LOD) threshold was 5.0. Map distances were mea-sured in centi-Morgans (cM), which were calculated using the Kosambi mapping function [32]. The linkage map was generated using MapChart V2.2 software [33]. QTL mapping of TFs relat-ed to fiber quality was performrelat-ed using the genetic linkage map integratrelat-ed with the TF markers. The phenotype data of fiber quality and QTL mapping methods were as same as Li et al. [30].
In-silico
mapping TFs in two diploid genomes
To verify our genetic mapping results, we blasted the mapped TF sequences against the diploid A2genome ofG.arboretumand D5genome ofG.raimondii(http://www.phytozome.net/ cotton.php) with an E-value cut-off 1e-10. Then, the best match for each TF sequence was re-tained; one TF was only mapped to A2or D5genome rather than both.
RT-PCR and qRT-PCR analysis
To evaluate differences in TF expression betweenG.hirsutumandG.barbadense, RNAs were extracted from developing fibers at 0 days post-anthesis (DPA), 5 DPA, 10 DPA, 15 DPA, 20 DPA, and 25 DPA, RNAs (4μg) were reverse-transcribed into cDNA using M-MLV-RT
Re-verse Transcriptase (Invitrogen). For RT-PCR analysis, PCR was performed in 15μL of
solu-tion containing 25 ng cDNA template, 1.7 x buffer, 3.2 mmol L-1MgCl2, 0.42 mmol L-1 dNTPs, 0.27μmol L-1forward primer, 0.27μmol L-1reverse primer, 1.3 units Taq DNA
poly-merase, and ddH2O to a final volume of 15μl. The PCR program was as follows: denaturation
at 95°C for 5 min; 35 cycles of 94°C (50 s), 58°C (45 s), and 72°C (60 s); and a final extension step of 5 min at 72°C. The qRT-PCR analyses were performed according to the methods de-scribed by Munis et al. [34] with minor modifications. Ubiquitin (GenBank acc No.: DQ116441; forward primer, 5’GAAGGCATTCCACCTGACCAAC3’; reverse primer, 5’CTTGACCTTCTTCTTCTTGTGCTTG 3’) served as an internal standard to demonstrate equal amounts of first-strand cDNA in each sample.
Results
Primer design and polymorphisms
Primers were designed for the 1,116 TF sequences, and then repeated primers were eliminated by a BLAST analysis. In total, 977 primer pairs were obtained (S1 Table). In the present study, TF primers were screened based on SSCPs. Thirty-four polymorphic primers were obtained, and 37 polymorphic loci were produced with a primer polymorphism rate of 3.48%. These 37 polymorphic loci were from 16 TF families. Seven loci were from the ERF family, and four loci were from the bHLH families. The remaining TF families contained 1–2 polymorphic loci (S1 Table).
Distribution of TFs in the cotton genome and fiber-related QTLs
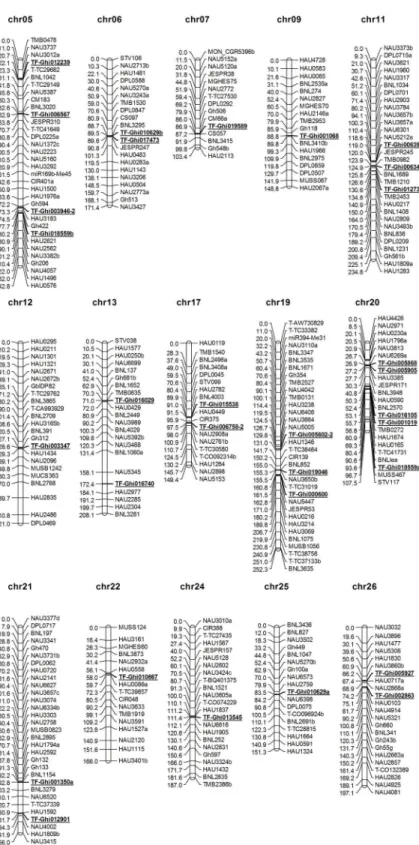
Chr22, Chr24, Chr25, and Chr26). Among these chromosomes, 14 TF loci were mapped to 7 chromosomes of the ATgenome, and 17 loci were mapped to 8 chromosomes of the DT ge-nome (Fig 2). The 31 TF markers were not equally distributed on the 15 chromosomes. Com-paratively, more loci (a total of 15 loci) were mapped to Chr05, Chr11, Chr19, and Chr20. These mapped TF markers belonged to 16 TF families, among which 7 markers were from the ERF family, 4 were from the bHLH family, and 3 were from the WRKY family (S1 Table). As shown inFig 2, TF-Ghi005868 and TF-Ghi005905 of the ERF family were located on the same chromosome (Chr20) and separated by 0.3 cM.S1 Tableindicates that TF-Ghi012239 of the C2H2 family (located on Chr05) and TF-Ghi000600 of the C2H2 family (located on Chr19) were present on homologous chromosomes. In addition, TF-Ghi010629 of the WRKY family has two loci, TF-Ghi010629a and TF-Ghi010629b, which were located on the homologous chromosomes Chr25 and Chr06, respectively. TF-Ghi006349 of the bHLH family and
TF-Ghi001350 of the bHLH family were located on the homologous chromosomes, Chr11 and Chr21, respectively.
QTL mapping TF markers associated with fiber quality revealed that only one TF markers, TF-Ghi005602-2 mapped on Chr19, was tightly linked with fiber length with LOD value of 8.70 and explained 12.23% of the phenotypic variance with an additive effect of -0.35. This re-sult may imply that TFs in cotton are involved in developments of many traits rather than fiber development.
Comparison of the genetically mapped TFs with
in-silico
mapping in two
sequenced diploid genomes
With the availability of cotton genome sequences, we can check the consistency of mapped re-sults with their chromosomal positions by in-silico mapping their sequences to the genome se-quence. By unique matching genetically mapped TF sequences to A2and D5genomes, 15 TFs were mapped to 7 chromosomes of A2genome and 14 to 10 chromosomes of D5genome (Fig 3). The in-silico mapping results was different to genetic mapping results. TF-Ghi018559b, mapped on Chr05, was not mapped on the corresponding Ga10, but on Gr11; Gr10 is the cor-responding chromosome of Chr20 which is not the homologous chromosome of Chr19. The two loci on Chr06 were not mapped on the corresponding Ga12 but on Gr10; Gr10 is the cor-responding chromosome of Chr25 which is the homologous chromosome of Chr06.
TF-Ghi019589 on Chr07 was mapped on Gr01, the corresponding chromosome of Chr16 which is the homologous chromosome of Chr07. TF-Ghi001068 on Chr09 was mapped on Gr06, the corresponding chromosome of Chr23 which is the homologous chromosome of Chr09. TF-Ghi006349 on Chr11 was not mapped on the corresponding Ga04, but on Ga06; TF-Ghi012730 was mapped on Gr07, the corresponding chromosome Chr21 which is the ho-mologous chromosome of Chr11. The two loci on Chr13 were mapped on Gr13, the corre-sponding chromosome Chr18 which is the homologous chromosome of Chr13.
TF-Ghi015538 on Chr17 was mapped on Ga13, the corresponding chromosome Chr13 which is not the homologous chromosome of Chr17. TF-Ghi005602-2 and TF-Ghi019046 on Chr19 was mapped on Ga10, the corresponding chromosome Chr05 which is the homologous chromosome of Chr19. TF-Ghi005868 and TF-Ghi016105 on Chr20 was mapped on Ga09, the corresponding chromosome Chr10 which is the homologous chromosome of Chr20;
TF-Ghi001019 was mapped on Ga07, the corresponding chromosome Chr01 which is not the homologous chromosome of Chr20. TF-Ghi013545 on Chr24 was mapped on Ga08, the corre-sponding chromosome Chr06 which is not the homologous chromosome of Chr24.
Fig 2. Locations of polymorphic TF loci on the BC1genetic linkage map.TF markers are underlined and
bolded. The loci on each chromosome with an average of 10 cM of the original map were selected shown. The top and bottom markers and markers that were closely linked to the TF markers were retained for simplicity.
Fig 3. Chromosomal location of TFs in the A2genome ofG.arboretum(a) and D5genome ofG.
raimondii(b).
RT-PCR and qRT-PCR analysis between mapping parents
One or two markers were randomly selected from each family, and a total of 85 primer pairs from 45 TF families were used for the RT-PCR analysis. Thirty-six TF primer pairs (42.4%) from 31 families were expressed during the cotton fiber stages (Fig 4,Table 2). Among them, 27 displayed clear differences in expression, 4 exhibited minor differences, and 5 showed no differences. Almost all expressed TFs clearly differed between Emian22 and 3–79 at various stages of fiber development (0, 5, 10, 15, 20, and 25 DPA). Five TFs were weakly expressed or not expressed during any stages in either Emian22 or 3–79, and these TFs were defined as hav-ing no differences in expression in this study. Furthermore, 17 TFs displayed similar expression patterns, and 14 had different expression patterns. To further confirm the RT-PCR results, four randomly chosen genes belonging to different categories were analyzed (S1 Fig). Consis-tent results were observed in both the RT-PCR and the qRT-PCR analyses.
Fig 4. RT-PCR analysis of TFs between mapping parents.The numbers on the top represent fibers at 0 DPA, 5 DPA, 10 DPA, 15 DPA, 20 DPA, and 25 DPA for Emian22 and 3–79. Similar expression trends between Emian22 and 3–79 were classified as similar expression patterns. Apparent differences in expression between Emian22 and 3–79 were classified as different expression patterns. Obvious differences in expression levels between Emian22 and 3–79 were classified as obvious differences. Minor or no differences in expression levels between Emian22 and 3–79 were classified as no difference. Gene primers and their family names are indicated on the left.
Table 2. Chromosome localization and RT-PCR analysis of TFs.
c Primer name Chromosome Genome Results of RT-PCR
AP2 TF-Ghi003040-1 - - 1
TF-Ghi011138 - - 0
ARF TF-Ghi001894-1 - - 1
TF-Ghi009171-1 - -
-ARR-B TF-Ghi001951 - -
-TF-Ghi003367-1 - - 1
B3 TF-Ghi016105 Chr 20 DT 1
TF-Ghi004897 - -
-BBR/BPC TF-Ghi013423 - -
-bHLH TF-Ghi001350 Chr 21 DT 1
TF-Ghi016740 Chr 13 AT 1
bZIP TF-Ghi011236 - - 1
TF-Ghi000928 - -
-C2H2 TF-Ghi000600 Chr 19 DT 1
TF-Ghi012239 Chr 05 AT
-C3H TF-Ghi001212-2 - - 1
TF-Ghi002804-1 - -
-CAMTA TF-Ghi006955 - - 1
TF-Ghi015073 - -
-CO-like TF-Ghi011118 - -
-TF-Ghi012473-2 - -
-CPP TF-Ghi005234-2 - -
-TF-Ghi009315-1 - - 0
DBB TF-Ghi006868 - - 1
TF-Ghi007689 - -
-Dof TF-Ghi001188 - - 0
TF-Ghi006567 Chr 05 AT
-E2F/DP TF-Ghi003296 - - 0
TF-Ghi010249 - -
-EIL TF-Ghi005277 - -
-TF-Ghi012794 - -
-ERF TF-Ghi005868 Chr 20 DT 1
TF-Ghi016029 Chr 13 AT 1
FAR1 TF-Ghi001781 - -
-TF-Ghi006548 - - 1
G2-like TF-Ghi003043 - -
-TF-Ghi010667 Chr 22 DT
-GATA TF-Ghi001019 Chr 20 DT
-TF-Ghi006397 Chr 11 AT 1
GeBP TF-Ghi001077 - - 1
TF-Ghi002443 - - 0
GRAS TF-Ghi002005 - -
-TF-Ghi010675 - - 1
GRF TF-Ghi005602-2 Chr 19 DT
-TF-Ghi016422-1 - - 0
HB-other TF-Ghi011486 - -
-TF-Ghi015378 - -
Table 2. (Continued)
c Primer name Chromosome Genome Results of RT-PCR
HD-ZIP TF-Ghi005545 - - 1
TF-Ghi012730 Chr 11 AT
-HSF TF-Ghi000222 - - 1
TF-Ghi011976 - -
-LBD TF-Ghi007885 - -
-TF-Ghi018559 Chr 05, Chr 20 AT, DT 1
MIKC TF-Ghi006758-2 Chr 17 DT 1
TF-Ghi015198-1 - -
-MYB TF-Ghi001138-1 - - 1
TF-Ghi005417 - -
-MYB_related TF-Ghi001730 - - 1
TF-Ghi007525 - -
-NAC TF-Ghi009255 - -
-TF-Ghi009258 - -
-NF-YA TF-Ghi004749 - -
-TF-Ghi004977 - -
-NF-YB TF-Ghi008239 - -
-TF-Ghi019211 - -
-NF-YC TF-Ghi012195 - -
-TF-Ghi014911 - -
-Nin-like TF-Ghi001151 - -
-TF-Ghi015538 Chr 17 DT
-RAV TF-Ghi013999 - -
-S1Fa-like TF-Ghi013563 - -
-SBP TF-Ghi010092 - - 1
SRS TF-Ghi002427 - -
-TALE TF-Ghi003946-2 Chr 05 AT 1
TF-Ghi012410 - -
-TCP TF-Ghi002863 Chr 26 DT 0
TF-Ghi019046 Chr 19 DT 0
Trihelix TF-Ghi010211 - -
-TF-Ghi011360 - -
-VOZ TF-Ghi002283 - - 1
TF-Ghi007684 - -
-Whirly TF-Ghi006375 - - 1
WOX TF-Ghi006162 - -
-TF-Ghi011650 - -
-WRKY TF-Ghi003347 Chr 12 AT
-TF-Ghi003889 - -
-YABBY TF-Ghi001411 - -
-TF-Ghi017422 - -
-ZF-HD TF-Ghi001068 Chr 09 AT
-TF-Ghi005453 - - 0
-: TF was not mapped on the chromosomes, and expression was not detected. 0: No differences in expression.
1: Obvious difference in expression.
Discussion
Low level of polymorphisms of the TF markers
TFs, as an important type of trans-acting factor, are extensively involved in the development of plants and animals. Various TFs are related to cotton fiber development [3,16,35,36]. A large number of TF functions have been verified. However, few genetic mapping studies of TFs have been performed in cotton [37]. Therefore, we downloaded TF sequences reported in the Plant Transcription Factor Database V2.0 (http://planttfdb.cbi.edu.cn/) (Table 1) and designed spe-cific primers based on the motifs of the TF genes. Thus, the primers developed in the present study were TF-specific. In contrast, the simple sequence repeats (SSRs) primers derived from the TF sequences [37] may not have been TF-specific.
To detect additional polymorphisms in the TF markers, SSCP was applied. We discovered a very low rate of primer polymorphisms in the TF markers (3.48%), which was potentially at-tributed to the highly conserved nature of TFs. The results also indicated that the genes that were compared betweenG.hirsutumandG.barbadenseare highly conserved. Although the primer polymorphism rate was low, the TF markers examined in this study exhibited more polymorphisms than other TF markers. Li et al. [37] used SSRs designed from 1,116G. hirsu-tumTFs in an analysis of polymorphisms and revealed polymorphism ratios of 1.6%, 2.1%, and 2.3% in the (Yumian 1×CCRI35) F2:6, (Yumian 1×T586) F2:7, and (Yumian 1×7235) F2:6 populations, respectively. The higher rate of polymorphisms detected in the present study may have been caused by SSCP, which can detect minor difference between sequences [38]. This result may also be caused by differences between the interspecific and intraspecific populations.
Genetic mapping TFs in cotton
To date, some genetic mapping analyses of TFs have been reported. SNP primers of the MYB family were mapped on the cotton chromosome by An et al. [39]. Myb1Gbmt_238 is located on Chr13, Myb1Gb_500 is located on Chr18, and Myb2Gb_204 is located on Chr8. Guo et al. [40] also mapped TFs of the MYB family on cotton chromosomes; for example, MYB38 is lo-cated on Chr16. However, in the present study, TF markers of the MYB family were not mapped on the interspecific linkage map. In 2012, SSR primers designed from the same 1,116 G.hirsutumTFs were mapped on cotton chromosomes by Li et al. [37]. Unfortunately, due to different marker develop strategy, no common TFs were mapped.
In this study, 31 polymorphic TF loci were mapped to 15 chromosomes. Among them, 14 TF loci were mapped to 7 chromosomes of the ATgenome and 17 loci on 8 chromosomes of the DTgenome (Fig 2). These loci were clearly evenly distributed between the ATand the DT genome. However, Chr05, Chr11, Chr19, and Chr20 contained 15 loci that accounted for 48.4% of the total mapped TF loci. Therefore, genetic mapping revealed preferential distribu-tion of TF loci on cotton chromosomes (Fig 2). Comparison of chromosomal location of TF loci revealed that TFs from the same family mapped to homologous cotton chromosomes.
Comparison of the genetically mapped TFs with in-silico mapping results in two sequenced diploid genomes showed that some TFs were not mapped on their corresponding chromo-somes in the diploid genome, but on their homologous chromochromo-somes’corresponding chromo-somes in the other diploid genome. It is reasonable that many genes are duplicated on the homologous chromosomes in the tetraploid genome. However, some TFs were not mapped on their corresponding chromosomes or their homologous chromosomes’corresponding chro-mosomes in the diploid genomes; the reason may be that these genes translocate
Differences in the expression of TFs between
G.
hirsutum
and
G.
barbadense
during fiber development
Cotton is an important cash crop. Therefore, improvements in yield, fiber quality, and disease resistance are areas of focus in cotton genetics and breeding. A number of studies have indicat-ed that various TFs are involvindicat-ed in fiber development. Therefore, in the present study, we usindicat-ed RT-PCR analysis to compare TFs betweenG.hirsutumandG.barbadenseduring
fiber development.
We discovered dynamic expression of TFs during various stages of fiber development in G.hirsutumandG.barbadense. The most expressed TFs (75%) from 25 families exhibited sig-nificantly different expression levels during different stages between parents. Further studies of TFs showing different expression patterns betweenG.hirsutumandG.barbadensemay be very helpful for understanding differences in fiber quality between the two species. Unique expres-sion patterns may be associated with a particular function. Additional studies are required to determine the functions and mechanisms of action of these TFs.
Supporting Information
S1 Fig. qRT-PCR analysis of TFs between mapping parents.The expression levels of Emian22 and 3–79 are presented.“”representsP0.05, and“”representsP0.01. The
fol-lowing primers were used: A, TF-Ghi001138-1; B, TF-Ghi003946-2; C, TF-Ghi005868; D, TF-Ghi016740.
(TIF)
S1 Table. Characteristics of the 977 TF primers used in this study.p: Polymorphic primers. ×: Non-polymorphic primers. -: The primer was not mapped on the chromosome.
(XLS)
Author Contributions
Conceived and designed the experiments: ZL. Performed the experiments: XC XL. Analyzed the data: XC XJ. Wrote the paper: XC ZL.
References
1. Yang Z, Wang X, Li X, Yang C. Advance on the study of transcription factors in higher plants. Hereditas. 2004, 26: 403–408. PMID:15640029
2. Riechmann JL, Ratcliffe OJ. A genomic perspective on plant transcription factors. Curr Opin Plant Biol. 2000, 3(5): 423–434. PMID:11019812
3. Heim MA, Jakoby M, Werber M, Martin C, Weisshaar B, Bailey PC. The basic helix-loop-helix transcrip-tion factor family in plants: A genome-wide study of protein structure and functranscrip-tional diversity. Mol Biol Evol. 2003, 20(5): 735–747. PMID:12679534
4. Buck MJ, Atchley WR. Phylogenetic analysis of plant basic helix-loop-helix proteins. J Mol Evol. 2003, 56(6): 742–750. PMID:12911037
5. Shen WH, Gigot C. Protein complexes binding to cis elements of the plant histone gene promoters: mul-tiplicity, phosphorylation and cell cycle alteration. Plant Mol Biol. 1997, 33(3): 367–379. PMID: 9049259
6. Horikawa I, Cable PL, Mazur SJ, Appella E, Afshari CA, Barrett JC. Downstream E-box-mediated regu-lation of the human telomerase reverse transcriptase (hTERT) gene transcription: Evidence for an en-dogenous mechanism of transcriptional repression. Mol Biol Cell. 2002, 13(8): 2585–2597. PMID: 12181331
8. Kirik V, Schnittger A, Radchuk V, Adler K, Huelskamp M, Bäumlein H. Ectopic expression of the
Arabi-dopsis AtMYB23gene induces differentiation of trichome cells. Dev Biol. 2001, 235(2): 366–377.
PMID:11437443
9. Wang S, Wang JW, Yu N, Li CH, Luo B, Gou JY, et al. Control of plant trichome development by a cot-ton fiber MYB gene. Plant Cell. 2004, 16(9): 2323–2334. PMID:15316114
10. Suo JF, Liang XO, Pu L, Zhang YS, Xue YB. Identification of GhMYB109 encoding a R2R3 MYB tran-scription factor that expressed specifically in fiber initials and elongating fibers of cotton (Gossypium
hir-sutumL.). Biochim Biophys Acta. 2003, 1630(1): 25–34. PMID:14580676
11. Lee JJ, Hassan OS, Gao W, Wei NE, Kohel RJ, Chen XY, et al. Developmental and gene expression analyses of a cotton naked seed mutant. Planta. 2006, 223(3): 418–432. PMID:16254724
12. Hsu CY, Jenkins JN, Saha S, Ma DP. Transcriptional regulation of the lipid transfer protein geneLTP3 in cotton fibers by a novel MYB protein. Plant Sci. 2005, 168(1): 167–181. PMID:16159331
13. Wu YR, Machado AC, White RG, Llewellyn DJ, Dennis ES. Expression profiling identifies genes ex-pressed early during lint fibre initiation in cotton. Plant Cell Physiol. 2006, 47(1): 107–127. PMID: 16278222
14. Huang B, Jin L, Liu J. Molecular cloning and functional characterization of a DREB1/CBF-like gene
(GhDREB1L) from cotton. Sci China C Life Sci. 2007, 50(1): 7–14. PMID:17393077
15. Meng X, Li F, Liu C, Zhang CJ, Wu Z. Responses of ERF Transcription Factors to Biotic Stresses and its Applications in Improving Cotton Resistance. Mol Plant Breed. 2008, 6: 111–116.
16. Endt DV, Kijne JW, Memelink J. Transcription factors controlling plant secondary metabolism: what reg-ulates the regulators? Phytochemistry. 2002, 61(2): 107–114. PMID:12169302
17. Ramsay NA, Walker AR, Mooney M, Gray JC. Two basic-helix-loop-helix genes (MYC-146andGL3)
fromArabidopsiscan activate anthocyanin biosynthesis in a white-flowered Matthiola incana mutant.
Plant Mol Biol. 2003, 52(3): 679–688. PMID:12956536
18. Soh MS, Kim YM, Han SJ, Song PS. REP1, a basic helix-loop-helix protein, is required for a branch pathway of phytochrome A signaling inArabidopsis. Plant Cell. 2000, 12(11): 2061–2073. PMID: 11090209
19. Xie Z, Zhang ZL, Zou XL, Yang GX, Komatsu S, Shen QJ. Interactions of two abscisic-acid induced WRKY genes in repressing gibberellin signaling in aleurone cells. Plant J. 2006, 46(2): 231–242. PMID:16623886
20. Miao Y, Laun T, Zimmermann P, Zentgraf U. Targets of the WRKY53 transcription factor and its role during leaf senescence inArabidopsis. Plant Mol Biol. 2004, 55(6): 853–867. PMID:15604721
21. Lagace M, Matton DP. Characterization of a WRKY transcription factor expressed in late torpedo-stage embryos ofSolanum chacoense. Planta. 2004, 219(1): 185–189. PMID:15045588
22. Wang H, Hao J, Chen X, Hao Z, Wang X, Lou Y, et al. Overexpression of rice WRKY89 enhances ultra-violet B tolerance and disease resistance in rice plants. Plant Mol Biol. 2007, 65(6): 799–815. PMID: 17960484
23. MarèC, Mazzucotelli E, Crosatti C, Francia E, Stanca AM, Cattivelli L. Hv-WRKY38: a new transcription
factor involved in cold- and drought-response in barley. Plant Mol Biol. 2004, 55(3): 399–416. PMID: 15604689
24. Oh SK, Yi SY, Yu SH, Moon JS, Park JM, Choi D. CaWRKY2, a chili pepper transcription factor, is rap-idly induced by incompatible plant pathogens. Mol Cells. 2006, 22(1): 58–64. PMID:16951551
25. Asai T, Tena G, Plotnikova J, Willmann MR, Chiu WL, Gomez-Gomez L, et al. MAP kinase signalling cascade inArabidopsisinnate immunity. Nature. 2002, 415(6875): 977–983. PMID:11875555
26. Rushton PJ, Somssich IE, Ringler P, Shen QJ. WRKY transcription factors. Trends Plant Sci. 2010, 15(5): 247–258. doi:10.1016/j.tplants.2010.02.006PMID:20304701
27. Xing DH, Lai ZB, Zheng ZY, Vinod KM, Fan BF, Chen ZX. Stress- and pathogen-inducedArabidopsis WRKY48 is a transcriptional activator that represses plant basal defense. Mol Plant. 2008, 1(3): 459–470. doi:10.1093/mp/ssn020PMID:19825553
28. Zhang YX, Lin ZX, Xia QZ, Zhang MJ, Zhang XL. Characteristics and analysis of simple sequence re-peats in the cotton genome based on a linkage map constructed from a BC1population between
Gos-sypium hirsutumandG.barbadense. Genome. 2008, 51(7): 534–546. doi:10.1139/G08-033PMID:
18545277
29. Yu Y, Yuan D, Liang S, Li X, Wang X, Lin Z, et al. (2011) Genome structure of cotton revealed by a ge-nome-wide SSR genetic map constructed from a BC1population betweengossypium hirsutumandG.
30. Li X, Yuan D, Wang H, Chen X, Wang B, Lin Z, et al. Increasing cotton genome coverage with polymor-phic SSRs as revealed by SSCP. Genome. 2012, 55(6): 459–470. doi:10.1139/g2012-032PMID: 22670804
31. Stam P. Construction of integrated genetic linkage maps by means of a new computer package: Join Map. Plant J. 1993, 3(5): 739–744.
32. Kosambi DD. The estimation of map distance from recombination values. Ann Eugen. 1944, 12(1): 172–175.
33. Voorrips RE. MapChart: Software for the graphical presentation of linkage maps and QTLs. J Hered. 2002, 93(1): 77–78. PMID:12011185
34. Munis MF, Tu L, Deng F, Tan J, Xu L, Xu S, et al. A thaumatin-like protein gene involved in cotton fiber secondary cell wall development enhances resistance against Verticillium dahliae and other stresses in transgenictobacco. Biochem Biophys Res Commun. 2010, 393(1): 38–44. doi:10.1016/j.bbrc.2010. 01.069PMID:20097164
35. Nover L, Bharti K, Döring P, Mishra SK, Ganguli A, Scharf KD. Arabidopsis and the heat stress tran-scription factor world: How many heat stress trantran-scription factors do we need? Cell Stress Chaperones. 2001, 6(3): 177–189. PMID:11599559
36. Singh KB, Foley RC, Onate-Sanchez L. Transcription factors in plant defense and stress responses. Curr Opin Plant Biol. 2002, 5(5): 430–436. PMID:12183182
37. Li L, Wang S, Liu F, Tang S, Tan Z, Zhang J, et al. Chromosomal Localization of Transcription Factors
inGossypium hirsutum. Acta agronomica Sinica. 2012, 38: 1361–1368.
38. Liu C, Lin Z, Zhang X. Unbiased genomic distribution of genes related to cell morphogenesis in cotton by chromosome mapping. Plant Cell Tiss Organ Cult. 2012, 108(3): 529–534.
39. An C, Saha S, Jenkins JN, Ma DP, Scheffler BE, Kohel RJ, et al. Cotton (Gossypium spp.) R2R3-MYB transcription factors SNP identification, phylogenomic characterization, chromosome localization, and linkage mapping. Theor Appl Genet. 2008, 116(7): 1015–1026. doi:10.1007/s00122-008-0732-4 PMID:18338155