Benford's Law and Possibilities
for Its Use in Governmental
Statistics
1
Richard Hindls2 | University of Economics, Prague, Czech Republic Stanislava Hronová3 | University of Economics, Prague, Czech Republic
1 h is article was written thanks to support from the Institutional Support to Long-Term Conceptual Development of
Re-search Organisation, the Faculty of Informatics and Statistics of the University of Economics, Prague.
2 Faculty of Informatics and Statistics, Department of Statistics and Probability, nám. W. Churchilla 4, 130 67 Prague 3,
Czech Republic. E-mail: [email protected].
3 Faculty of Informatics and Statistics, Department of Economic Statistics, nám. W. Churchilla 4, 130 67 Prague 3, Czech
Republic. E-mail: [email protected]. Abstract
Benford's Law (sometimes also called Benford's Distribution or Benford's Test) is one of the possible tools for verii cation of a data structure in a given i le regarding the relative frequencies of occurrence of the i rst (or second, etc.) digit from the let . If it is used as a goodness-of-i t test on sample data, there are usually no prob-lems with its interpretation. However, certain factual questions arise in connection with validity of Benford's Law in large data sets in governmental statistics; such questions should be resolved before the law is used. In this paper we discuss the application potential of Benford's Law when working with extensive data sets in the areas of economic and social statistics.
Keywords
Benford's Law, goodness-of-i t test, Z-test, national accounts
JEL code
E22, C43
INTRODUCTION
tools are suitable for verifying that the items of national accounts are indeed correct. In addition to the usual factual and logical checks on the data sources and procedures, such verii cation can be supported by certain formal tools. Benford’s Distribution is one of them.
1 WHAT IS BENFORD’S LAW?
h e substance of Benford’s Law can easily be expressed in words: in a given set of data, the probability of occurrence as the i rst digit from the let is dif erent for each of the digits 1, 2, ... 9. Numbers starting with one occur more ot en than those starting with two, which are in turn more frequent than those starting with three, etc., and numbers starting with nine are the least frequent ones. h is observation is hard to believe at i rst sight. However, its validity has been empirically coni rmed (i rst in 1881, and then again in 1938). h anks to a new mathematical approach developed at the end of the 20th century, this law found its way to be included into the theory of probability. Many a time, successful applications, including testing mathematical models and computer designs, as well as error detection in accounting, have indicated its validity.
1.1 Historical Note
By the irony of fate, it was not Frank Benford who assisted at the birth of the distribution that is now called Benford’s. Neither was he the i rst who tried to prove it mathematically. As a matter of fact, Simon Newcomb in the late 19th century i rst dei ned a distribution governing the occurrence of numbers with
a given digit as the i rst one from the let . R. A. Raimi and T. P. Hill tried to put forth a mathematical proof of this specii c law in the 1990s.
Curiosity and imagination, besides knowledge and experience, undoubtedly play an important role in scientii c discoveries. h is was also the case of the distribution (law) later called Benford’s. American mathematician and astronomer Simon Newcomb noticed in a library that the beginning pages in loga-rithm table books are much more worn out than the rest. On the basis of this observation he realised that students much more ot en look up logarithms of numbers beginning with one than those begin-ning with two, the latter more ot en than those beginbegin-ning with three, etc., and from that he deduced: the probability of occurrence for numbers beginning with one is largest, and larger than that for numbers beginning with two, etc. Empirically he derived4 the following formula for the probability of occurrence for numbers in which digit d stands the i rst from the let :
P(d) = , for d = 1, 2, …, 9. (1)
h is rule means that the probability of occurrence of a number beginning with one is 0.3010, beginning with two 0.1761, etc., to the probability of a number beginning with nine, which is 0.0458. He also derived probabilities corresponding to the digit second from the let (now, of course, zero has to be included); mutual dif erences are signii cantly lower for digits 0, 1, …, 9 at the second position: the probability of zero is 0.1197, and that of nine is 0.0850).5
Nowadays Newcomb’s paper has hundreds of citations, but in its time it passed practically without notice and more or less fell into oblivion. Many years later American physicist Frank Benford also noticed the irregular wear of logarithmic table books’ pages, and derived the same logarithmic formula for the i rst and second digits from the let . In 1938 he published his conclusions based on studying a large number of data sets for dif erent areas (hydrology, chemistry, but also baseball or daily press – Benford, 1938).
⎟ ⎟ ⎠ ⎞ ⎜ ⎜ ⎝ ⎛
+
d
1 1 log10
Unlike Newcomb’s paper, Frank Benford’s met certain attention, perhaps thanks to recognition of his name in physics. Newcomb had been forgotten by then and the logarithmic relationship for occurrence of the i rst (and second) digit from the let was “christened” Benford’s.
h e wider use of Benford’s Law in the second half of the 20th century brought about a number of ques-tions concerning its validity. h ere were data sets (from natural sciences, economics, but also everyday life) in which Benford’s Law was valid, but it was always possible to i nd situations for its rejection (phone numbers from a certain area, shoe or cloth sizes, etc.). Naturally, a question arose whether Benford’s Law can or cannot be proved mathematically. In particular, T. P. Hill (Hill, 1995a; Hill, 1995b; and Hill, 1998), and R. A. Raimi (Raimi, 1969a; Raimi, 1969b; and Raimi, 1976) tried to i nd such a proof, but no strict mathematical proof was found.6 If nothing else, their theoretical ef orts led to an approximate formula-tion of Benford’s Law validity: if we take random samples from arbitrary distribuformula-tions, the collecformula-tion of these random samples approximately obey the Benford’s Law.7
1.2 Theoretical basis
Formula (1), i rst derived by Newcomb and later again by Benford, has a more general validity; or rather, it can be adapted into a form which dei nes occurrence of any digit at the second, third, etc. positions. In this connection, however, we have to ask whether such occurrence does or does not depend on occurrence of preceding digit(s) from the let , or is conditional with respect to such occurrence. In other words, in the former case we deal with probabilities of independent events, while in the latter conditional prob-abilities are due to be used.
Occurrence of a digit from 1, 2, …, 9 at the i rst position from the let is governed by Formula (1), but occurrence of a digit from 0, 1, …, 9 at the second position from the let (on assumption that it is independent of occurrence of a particular digit at the i rst position from the let ) is given as
, for d = 0, 1, …, 9. (2)
Regarding independent occurrences of digits from 0, 1, …, 9 at the third and following positions, the last formula can be generalised:
, for dk = 0, 1, …, 9. (3)
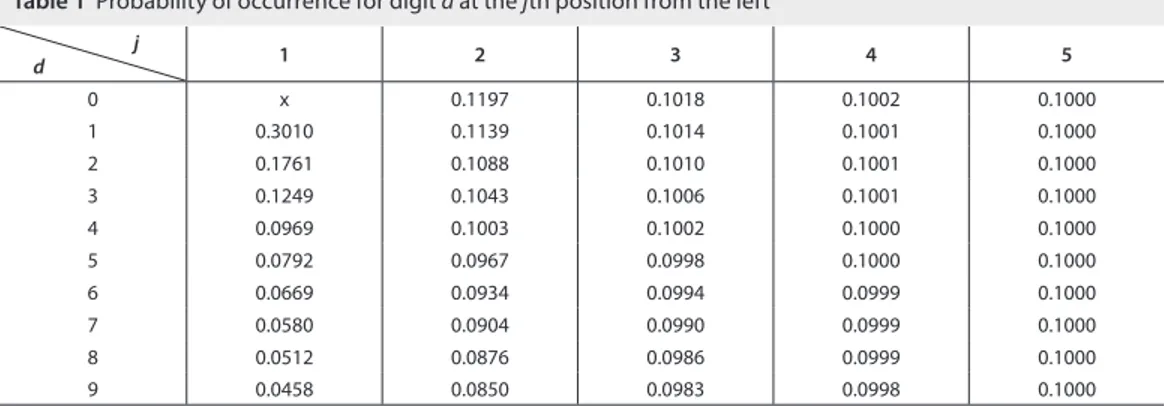
and the mutual dif erences between probabilities of occurrence of a particular digit get smaller already at the second position from the let ; and starting at the i t h position (independent of the preceding ones) Benford’s Law approaches the uniform multinomial distribution. Table 1 shows the changes in the prob-ability values for independent occurrence of digits 0, 1, …, 9 at the i rst to i t h positions from the let .
h e results presented above imply that, starting from the third position from the let , dif erences in probability values are very small and only occurrence of digits at the i rst and second positions from the let are interesting from the viewpoint of practical applications.
6 Perhaps the best characterisation is that by R. A. Raimi in the conclusion of his paper (Raimi, 1969b, p. 347). Referring
to the validity of Benford's Law for addresses of 5 000 people from a "Who is Who" publication, he says: "Why should the street addresses of a thousand famous men obey the logarithm law? I know no answer to this question".
7 Cf. Hill (1998) and Raimi (1969b). ⎟ ⎠ ⎞ ⎜ ⎝ ⎛ + + =
∑
= k d
d P k 10 1 1 log ) ( 9 1 10
∑
∑
∑
∑
= − = = = − ⎟ ⎟ ⎟ ⎟ ⎠ ⎞ ⎜ ⎜ ⎜ ⎜ ⎝ ⎛ + = 9 0 1 10 9 0 9 1 1 21 .10
1 1 log . . . ) ( k
d ki
Another situation arises when probability of occurrence of a digit from 0, 1, …, 9 at the second posi-tion from the let is condiposi-tional on occurrence of a particular digit from 1, 2, …, 9 at the i rst posiposi-tion from the let . Conditional probability of occurrence for d2 at the second position from the let on the condition that the i rst digit from the let is d1 equals
, for d1= 1, 2, …, 9, and for d2 = 0, 1, …, 9. (4)
For example, probability of “2” occurring at the second position on condition of “3” being the i rst digit from the let is
.
Values of conditional probability for pairs of digits calculated with the aid of Formula (4) are shown in Table 2.
Source: Authors' own calculations
j
d 1 2 3 4 5
0 x 0.1197 0.1018 0.1002 0.1000
1 0.3010 0.1139 0.1014 0.1001 0.1000
2 0.1761 0.1088 0.1010 0.1001 0.1000
3 0.1249 0.1043 0.1006 0.1001 0.1000
4 0.0969 0.1003 0.1002 0.1000 0.1000
5 0.0792 0.0967 0.0998 0.1000 0.1000
6 0.0669 0.0934 0.0994 0.0999 0.1000
7 0.0580 0.0904 0.0990 0.0999 0.1000
8 0.0512 0.0876 0.0986 0.0999 0.1000
9 0.0458 0.0850 0.0983 0.0998 0.1000
Table 1 Probability of occurrence for digit d at the jth position from the left
d1 (i rst
digit from the left)
d2 (second digit from the left)
0 1 2 3 4 5 6 7 8 9
1 0.1375 0.1255 0.1155 0.1069 0.0995 0.0931 0.0875 0.0825 0.0780 0.0740 2 0.1203 0.1147 0.1096 0.1050 0.1007 0.0967 0.0931 0.0897 0.0865 0.0836 3 0.1140 0.1104 0.1070 0.1038 0.1008 0.0979 0.0952 0.0927 0.0903 0.0880 4 0.1107 0.1080 0.1055 0.1030 0.1007 0.0985 0.0964 0.0943 0.0924 0.0905 5 0.1086 0.1065 0.1045 0.1025 0.1006 0.0988 0.0971 0.0954 0.0938 0.0922 6 0.1072 0.1055 0.1038 0.1022 0.1006 0.0990 0.0976 0.0961 0.0947 0.0933 7 0.1062 0.1047 0.1033 0.1019 0.1005 0.0992 0.0979 0.0966 0.0954 0.0942 8 0.1055 0.1042 0.1029 0.1017 0.1005 0.0993 0.0982 0.0970 0.0959 0.0949 9 0.1049 0.1037 0.1026 0.1015 0.1004 0.0994 0.0984 0.0973 0.0964 0.0954
Table 2 Conditional probability values of occurrence for d2 on condition d1
⎟⎟ ⎠ ⎞ ⎜⎜ ⎝ ⎛ + ⎟⎟ ⎠ ⎞ ⎜⎜ ⎝ ⎛ + + = 1 10 2 1 10 1 2 1 1 log 10 1 1 log ) / ( d d d d d P 1070 . 0 1249 . 0 0134 . 0 3 1 1 log 32 1 1 log ) 3 / 2 ( 10 10 1
2 = =
⎟ ⎠ ⎞ ⎜ ⎝ ⎛ + ⎟ ⎠ ⎞ ⎜ ⎝ ⎛ + = = = D D P
h e relationships considered above for Benford’s Law are valid for arbitrary data sets and are invar-iant with respect to the change of radix base or units of measurement. Equivalently expressed, data sets governed by Benford’s Law will remain governed even if expressed in a base other than decimal, or in other units of measurement (physical, currency, etc.) or if the original data items are all multiplied by an arbitrary constant. h is fact implies that any arithmetical operations carried out on data governed by Benford’s Law will again be governed by the same law.8
h e fact that we have at our disposal Benford’s Distribution of the i rst (and second) digit from the let 9 provides us with an option to check any data set for a i t to the data structure governed by Benford’s
Law. h e best choice for such a procedure is the 2 goodness-of-i t test, which can be used as a standard
hypothesis test if the respective data set comes from a random sample. h e tested hypothesis, denoted by H0, asserts the i t of the empirical distribution with Benford’s Law, and the alternative hypothesis H1 claims the contrary. h e test criterion is the statistics
, (5)
which has, under validity of H0, approximate distribution 2 [8], and where πd– theoretical relative frequencies under Benford’s “Law;
pd – empirical relative frequencies; and
n – sample size.
h e critical values are the respective quantiles of 2 [8]; on a 5% signii cance level, the 95% quantile will be used, that is, 20.95 [8] = 15.5. For a test of the i t at the second position the procedure would be similar, but there are ten groups and nine degrees of freedom. If the underlying sample is small, we also have to respect the condition of a sui cient frequency count in each “cell” (nπd
5).Another option for testing the i t of sample data to Benford’s Law is the use of Z-statistics; this proce-dure again verii es the i t between empirical and theoretical frequencies, but separately for each digit, not as a whole. Under hypothesis H0, the following Z-statistics has approximate normal distribution
, (6)
where πd– theoretical relative frequencies under Benford’s “Law;
pd – empirical relative frequencies; and
n – sample size.
h e critical value (in this case, separate for each digit) is the respective quantile u1– α/2 of the normed normal distribution. On a 5% signii cance level, we get u0.975 = 1.96. Kossovsky (2015) recommends that the two-tailed test should always be used, i.e., the critical value given by quantile u1– α/2, because absolute value stands in the numerator in Formula (6), and therefore it is not necessary to distinguish between directions of the deviation from Benford’s Law (it means that both lower and higher relative frequencies than the theoretical value under Benford’s Law admit the same interpretation).
Although both tests lead to conclusions that are intuitively similar, there is a dif erence between them. Namely, the former (G-statistics) comprehensively assesses the validity of Benford’s Law for a given set
8 Cf., e.g., Watrin et al. (2008).
9 For the above-mentioned reasons we are not going to consider more positions from the let . 10 Cf. Kossovsky (2015).
∑
= − =
9
1
2
) (
d d
d d
p n G
π π
(
d)
d d d
d
n p
n Z
π π
π
− ⎟ ⎠ ⎞ ⎜
⎝
⎛ − −
=
1 2
of i rst digits (possibly second ones as well). h e particular digit for which the deviation from Benford’s Law is the highest must be looked up among values
, for d = 1, 2, …, 9, or d = 0, 1, …, 9.
h e second approach (Zd-statistics) evaluates the deviation for each individual i rst digit indepen-dently, and it is immediately obvious which i rst digits do or do not comply with Benford’s Law. h e same considerations of course apply to testing the i t of empirical data to Benford’s Law for the second digit from the let .
Mean Absolute Dif erence (MAD) is also ot en used to test the i t to Benford’s Law. h is approach, however, goes beyond standard hypothesis testing because the distribution of the MAD statistics is unknown. h e mean absolute dif erence value (for the case of the i rst digit from the let )11 is
9
9
1
i
d d p MAD
, (7)
where πd– theoretical relative frequencies under Benford’s “Law;
pd – empirical relative frequencies.
Since we do not know the distribution of the MAD statistics, empirical threshold values12 are used for
evaluation the outcome for MAD – cf. Table 3.
11 For testing the second digit from the let , the calculation is similar but there are ten groups. 12 Cf. Nigrini (2011).
13 h e fact that validity of Benford's Law has not been proved mathematically is also a frequent topic.
14 From among the most recent ones, we refer to Miller (2015) – it is a very good presentation of applications and
experi-ence with them, especially in the areas of economy, accounting, and also natural sciexperi-ences.
Table 3 Degrees of i t for MAD statistics
Source: Nigrini (2011)
d d d p
2
MAD value Degree of i t between empirical and theoretical (Benford’s) distributions
0.000 – 0.006 Close i t
0.006 – 0.012 Acceptable i t
0.012 – 0.015 Loose i t
0.015 plus No i t
Unlike the previous approaches, which are classical statistical inference instances, the MAD statistics is more suitable for verifying the i t in a data set not considered a random sample because all data items in the given area are included. h is is ot en the case when checking extensive sets in corporate accounting and macroeconomic data.
2 PRACTICAL APPLICATIONS
h e simplicity and, undoubtedly, a certain degree of mystery of Benford’s Law13 have led to a large volume
Using Benford’s Law for verii cation of accounting data correctness is one of the approaches that have recently been ot en used in i nancial auditing and (tax) inspections. However, we have to realise that this approach never will and never can substitute for professional, comprehensive and extensive ef ort carried out by auditors and inspectors – it can only help them i nd the “weak points”. If an accounting data set deviates from Benford’s Law, this mere fact is not evidence of data falsii cation or improper manipula-tions. It is just an indicator of where attention of auditors/inspectors should be focused. If there is such a deviation, the total i t according to (5) is usually not assessed, but deviations of individual digits are evaluated to show where the attention should be focused. In other words, tests of i t to Benford’s Law should only be employed in auditing and inspections as an auxiliary tool in addition to standard procedures, or as the first step in searching for possible instances of data falsification. All authors who deal with the use of Benford’s Law in auditing, taxes and inspections agree on the statement cited in the preceding sentence.15
Benford’s Law has a similar application potential in the area of macroeconomic data. Literature in this area is substantially less extensive than in the previous case, but interesting approaches and results can even be found here. Undoubtedly the best-known contribution to the discussion on Benford’s Law is that of Rauch et al. (2011). h e authors of that paper focus on verii cation of Benford’s Law validity for selected data of national accounts in 27member states of the European Union in the period from 1999 to 2009 (data in the ESA 1995 methodology). Aware of the problem implied by the large power of a goodness-of-i t test applied to extensive data sets, they decided for a “descriptive” approach based on ordering the member states according to their values of the total deviation from Benford’s Law (5). h e position of each state on this scale may, in their opinion, be of assistance to Eurostat – to what extent and in what direction Eurostat’s verii cation procedures should be used. h eir analysis (based on relative frequencies of occurrence for the i rst digit from the let ) showed that the least trustworthy, from the Benford’s Law viewpoint (more exactly, the average value of the G-statistics) were the national accounts data of not only Greece, but also of Belgium, Romania, and Latvia. On the other hand, the best i t to Benford’s Law was identii ed for national accounts data of Luxembourg, Portugal, the Netherlands, Hungary, Poland, and the Czech Republic.
h ose excellent results of the Czech Republic inspired us to verify the validity of Benford’s Law on new data of national accounts processed and published by the Czech Statistical Oi ce according to the ESA 2010. Our ambition is not to prove the validity of Benford’s Law in a wider context of national accounts time series, in which even more favourable results would certainly be achieved, but to illustrate the possibilities of this tool in checking data quality. h e data set we tested for i t to Benford’s Law for the i rst and second digits from the let was that of national accounts data of the Czech Republic in 2013 (the preliminary report for 2013). Altogether there were 2 817 digits at the i rst position from the let , and 2 729 digits at the second position. Statistics (5), (6), and (7) are used for testing the i t. h e results for the i rst digit from the let are shown in Table 4.
15 Cf., e.g., Carslaw (1988), Nigrini (2005), Nigrini (1996), Guan et al. (2006), Niskanen and Keloharju (2000) or Watrin
et al. (2008).
16 Cf., e.g., Nye and Moul (2007) or Gonzales-Garcia and Pastor (2009).
17 Generally, data sets connected with the Stability and Growth Pact were considered. Altogether there were 36 691
nume-rals in 297 sets.
18 Nonetheless, the problem with Greece's national accounts had been known before. As early as in 2002, Eurostat twice
re-jected data of the general government in Greece due to untrustworthiness, and again in 2004 (cf. Report by Eurostat on the Revision of the Greek Government Dei cit and Debt Figures – <http://ec.europa.eu/eurostat/documents/4187653/5765001/ GREECE-EN.PDF>).
19 Data of the Czech Republic only showed a signii cant deviation from Benford's Law in 2002, when the value of the test
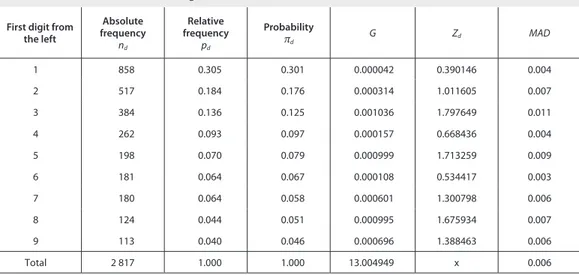
The entries in Table 4 clearly show that, regarding the first digit from the left, the data of the national accounts of the Czech Republic in 2013 comply with Benford’s Law for all three characteris-tics. In the goodness-of-i t test we obtain statistics G = 13.00, which is smaller than the critical value of
2
0.95 [8] = 15.5; hence the hypothesis is accepted that the empirical and theoretical (Benford’s) distribu-tions are identical. h e values of the Zd-statistics for each of the digits are all smaller than the critical values of the normed normal distribution (u0.975 = 1.96). We can therefore observe that, for none of the digits, the dif erences between the empirical and theoretical frequencies are deemed statistically signii -cant. h e MAD characteristic also indicates a good i t (cf. Table 3) of the data structure of the national accounts of the Czech Republic in 2013 to Benford’s Law. Figure 1 illustrates the i r between the empirical frequencies and theoretical probabilities for the i rst digit from the let .
First digit from the left
Absolute frequency
nd
Relative frequency
pd
Probability
πd G Zd MAD
1 858 0.305 0.301 0.000042 0.390146 0.004
2 517 0.184 0.176 0.000314 1.011605 0.007
3 384 0.136 0.125 0.001036 1.797649 0.011
4 262 0.093 0.097 0.000157 0.668436 0.004
5 198 0.070 0.079 0.000999 1.713259 0.009
6 181 0.064 0.067 0.000108 0.534417 0.003
7 180 0.064 0.058 0.000601 1.300798 0.006
8 124 0.044 0.051 0.000995 1.675934 0.007
9 113 0.040 0.046 0.000696 1.388463 0.006
Total 2 817 1.000 1.000 13.004949 x 0.006
Table 4 Fit to Benford's Law – i rst digit from the left
Source: <www.czso.cz>, authors' own calculations
0.000 0.050 0.100 0.150 0.200 0.250 0.300 0.350
1 2 3 4 5 6 7 8 9
First digit from the left
empirical theoretical
Figure 1 Fit to Benford's Law – i rst digit from the left
h e results of the comparison between the data structure of the national accounts of the Czech Republic in 2013 and Benford’s Law are shown in Table 5.
Second digit from the left
Absolute frequency
nd
Relative frequency
pd
Probability
πd
G Zd MAD
0 374 0.137 0.120 0.002422 2.710896 0.017
1 318 0.117 0.114 0.000056 0.385125 0.003
2 307 0.112 0.109 0.000112 0.555222 0.003
3 267 0.098 0.104 0.000365 1.023155 0.006
4 314 0.115 0.100 0.002268 2.590616 0.015
5 236 0.086 0.097 0.001141 1.824810 0.011
6 211 0.077 0.093 0.002644 2.787807 0.016
7 227 0.083 0.090 0.000517 1.211364 0.007
8 235 0.086 0.088 0.000041 0.314340 0.002
9 240 0.088 0.085 0.000102 0.517204 0.003
Total 2 729 0.863 1.000 19.774976 x 0.009
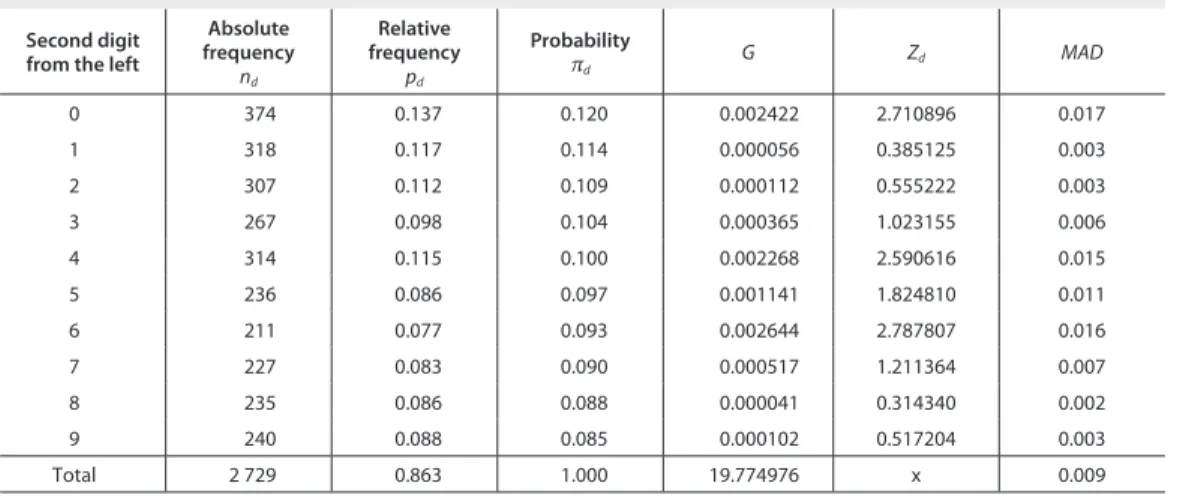
Table 5 Fit to Benford's Law – second digit from the left
Source: <www.czso.cz>, authors' own calculations
Items in Table 5 prove that national accounts data of the Czech Republic in 2013 do not fully comply with Benford’s Distribution regarding the second digit from the let . In the goodness-of-i t test we obtain statistics G = 19.77, which is higher than the critical value of 20.95 [9] = 16.9; hence the hypothesis is rejected that the empirical and theoretical (Benford’s) distributions are identical. h e values of the Zd-statistics show that the deviations (bold print in Table 5) from the probabilities given by Benford’s Law are present for digits 0, 4, and 6; for them, the corresponding values of the Zd-statistics are larger than the critical value, which is the quantile of the normed normal distribution (u0.975 = 1.96); hence these deviations are deemed statistically signii cant. h e MAD characteristic indicates “only” acceptable i t (cf. Table 3) of the data structure of the national accounts of the Czech Republic in 2013 to Benford’s Law.
empirical theoretical
0.000 0.020 0.040 0.060 0.080 0.100 0.120 0.140 0.160
0 1 2 3 4 5 6 7 8 9
Second digit from the left Figure 2 Fit to Benford's Law – second digit from the left
Let us recapitulate: the evaluation of the i t of the national accounts data of the Czech Republic in 2013 to Benford’s Law with respect to the second digit from the let , the i t has not been proved and the dif er-ences are signii cant for digits 0, 4, and 6. However, their more frequent occurrence does not enable us to draw any principal conclusions because this phenomenon is related to a preliminary report. It will be interesting to re-evaluate the situation when the i nal report of 2013 has been published. We can also see in Figure 2 that the dif erences for the second digit from the let are not of a principal nature.
CONCLUSIONS
As already stated above, the role of Benford’s Law is that of a detection and indicator tool. Deviations of empirical data, i.e., relative frequencies of occurrence for digits 1, 2, …, 9 as the i rst (or second) digit from the let , from Benford’s Law at the beginning of the verii cation process are not, as such, manifes-tations of infringement on (say, accounting) rules. At the beginning of the analysis, such deviations are just partial signals that there is certain discrepancy from Benford’s Law. Nothing more, and nothing less. Such a signal may be used as recommendation in what direction subsequent analysis should be carried out. Namely, it should focus on the items (accounts, subsets, etc.) for which the highest degree of devia-tion is shown, e.g., within the Z-test, – Formula (6).
Dif erent situations may arise. Either the revealed deviations are explained in a factual and prescribed way (if the deviation is not random) or no such explanation is identii ed. In the latter case, it should be seriously investigated why and how the deviation occurred. From experience, a number of instances are known in which unexplained deviations led to identii cation of principal departures from prescribed procedures and even forensic proceedings were initiated against the parties concerned.
h e described approach is open to discussion. Economists, auditors, accountants etc. have varied opinions about the detection potential of Benford’s Law. On the one hand there are zealous advocates of a notion that a signal triggered by a deviation from Benford’s Law in, say, macroeconomic data (i.e., data on the macroeconomic level) or accounting data (i.e., on the corporate level) is a really serious event to which proper attention should be given because it will lead to the root from which errors – sometimes fully intentional – stem. On the contrary, there are those who feel that the detection role of Benford’s Law is a mere formality because the root of the errors will be discovered anyway.
Trust in detection and signalling roles of Benford’s Law thus mainly depends on the level of personal experience of those who may use this checking approach. A theoretical dispute aimed at creating a feeling that Benford’s Law is useful usually misses this target. h is observation is based on practical experience of the authors of the present paper.
References
BENFORD, F. h e Law of Anomalous Numbers. Proceedings of the American Philosophical Society, Vol. 78, No. 4, 1938, pp. 551–572.
CARSLAW, C. A. P. N. Anomalies in Income Numbers: Evidence of Goal Oriented Behavior. h eAccounting Review, Vol. 63, No. 2, 1988, pp. 321–366.
GONZALES-GARCIA, J., PASTOR, G. Benford’s Law and Macroeconomic Data Quality [online]. IFM Working Paper 09/10, 2009, International Monetary Fund. <https://www.imf.org/external/pubs/t /wp/2009/wp0910.pdf>.
GUANG, L. et al. Auditing, Integral Approach to Quarterly Reporting, and Cosmetic Earnings Management. Managerial Auditing Journal. Vol. 21, No. 6, 2006, pp. 569–581.
HILL, T. P. A Statistical Derivation of the Signii cant-Digit Law. Statistical Science, Vol. 10, No. 4, 1995a, pp. 354–363. HILL, T. P. Base-Invariance Implies Benford’s Law. Proceedings of the American Mathematical Society, Vol. 123, No. 3, 1995b,
pp. 887–895.
HILL, T. P. h e First Digit Phenomenon. American Scientist, Vol. 86, 1998, pp. 358–363.
KNUTH, D. E. h e Art of Computer Programming. 3rd ed. Addison-Wesley, Reading, MA, Vol. 2, 1997, pp. 253–264. KOSSOVSKY, A. E. Benford’s Law. Singapore: World Scientii c Publishing, 2015. ISBN 978-98-145-8368-8.
NEWCOMB, S. Note on the Frequency of Use of the Dif erent Digits in Natural Numbers. American Journal of Mathemat-ics, Vol. 4, No. 1, 1881, pp. 39–40.
NIGRINI, M. J. A Taxpayer Compliance Application of Benford’s Law: Tests and Statistics for Auditors. Journal of the Ameri-can Taxation Association, Vol. 18, No. 1, 1996, pp. 72–79.
NIGRINI, M. J. An Assessment of the Change in the Incidence of Earnings Management around the Enron-Andersen Episode. Review of Accounting and Finance, Vol. 4, No. 1, 2005, pp. 92–110.
NIGRINI, M. J. Forensic Analytics: Methods and Techniques for Forensic Accounting Investigations. John Wiley, 2011. ISBN 978-0-470-89046-2.
NISKANEN, J., KELOHARJU, M. Earnings cosmetics in a tax-driven accounting environment: evidence from Finnish public i rms. European Accounting Review, Vol. 9, No. 3, 2000, pp. 443–452.
NYE, J., MOUL, C. h e Political Economy of Numbers: On the Application of Benford’s Law to International Macroeco-nomic Statistics. h e B. E. Journal of Macroeconomics, Vol. 7, No. 1, 2007, pp. 1–14.
RAIMI, R. A. h e Peculiar Distribution of First Digits. Scientii c American, Vol. 221, No. 6, 1969a, pp. 109–119. RAIMI, R. A. On Distribution of First Significant Figures. American Mathematical Monthly, Vol. 76, No. 4, 1969b,
pp. 342–348.
RAIMI, R. A. h e First Digit Problem. American Mathematical Monthly, Vol. 83, No. 7, 1976, pp. 521–538.
RAUCH, B. et al. Fact and Fiction in EU-Governmental Economic Data. German Economic Review, Vol. 12, No. 3, 2011, pp. 243–255.