Association mapping for yield and grain quality traits in rice (Oryza sativa
L.)
Tereza Cristina de Oliveira Borba
1, Rosana Pereira Vianello Brondani
1, Flávio Breseghello
1,
Alexandre Siqueira Guedes Coelho
2, João Antônio Mendonça
1, Paulo Hideo Nakano Rangel
1and Claudio Brondani
11
Embrapa Arroz e Feijão, Santo Antônio de Goiás, GO, Brazil.
2Setor de Melhoramento de Plantas, Escola de Agronomia, Campus-II Samambaia,
Universidade Federal de Goiás, Goiânia, GO, Brazil.
Abstract
Association analysis was applied to a panel of accessions of Embrapa Rice Core Collection (ERiCC) with 86 SSR and field data from two experiments. A clear subdivision between lowland and upland accessions was apparent, thereby indicating the presence of population structure. Thirty-two accessions with admixed ancestry were identified through structure analysis, these being discarded from association analysis, thus leaving 210 accessions subdivided into two panels. The association of yield and grain-quality traits with SSR was undertaken with a mixed linear model, with markers and subpopulation as fixed factors, and kinship matrix as a random factor. Eight markers from the two appraised panels showed significant association with four different traits, although only one (RM190) maintained the marker-trait association across years and cultivation. The significant association detected between amylose content and RM190 was in agreement with previous QTL analyses in the literature. Herein, the feasibility of undertaking as-sociation analysis in conjunction with germplasm characterization was demonstrated, even when considering low marker density. The high linkage disequilibrium expected in rice lines and cultivars facilitates the detection of marker-trait associations for implementing marker assisted selection, and the mining of alleles related to important traits in germplasm.
Key words:association analysis, core collection, genetic structure.
Received: March 16, 2009; Accepted: February 23, 2010.
Introduction
Association analysis, or linkage disequilibrium map-ping, is a notable strategy used for identifying genes con-trolling important traits. It is already being successfully applied for identifying genes related to human diseases. Re-search in humans has turned to association analysis, since linkage analysis has not been successful in the fine-scale mapping of disease loci, due to the impossibility of under-taking controlled-breeding crosses (Flint-Garcia et al., 2003). Unlike humans, in most plant species, the identifica-tion of those genomic regions which contribute to impor-tant characteristics has been mostly achieved through linkage analysis within segregating populations, the result of crosses between genitors with contrasting phenotypes and genotypes (Buntjeret al., 2005; Skotet al., 2005).
In breeding and pre-breeding programs, QTL detec-tion is an important tool for the identificadetec-tion of favorable alleles and for identifying and validating molecular assisted
selection (MAS). The identification of genomic regions re-lated to quantitative traits in plants was largely achieved through QTL mapping (Skotet al., 2005). However, there are some inherent limitations to QTL analysis. First, in linkage studies, the segregating population usually presents only two segregating alleles per locus, which means that in any given cross, the sampled genetic diversity may be lim-ited. In addition, the potential use of the genetic diversity available in species is restricted (Peleman and van der Voort, 2003). Another disadvantage as regards the substan-tiation of a low number of traits per cross, is through the dif-ficulty in identifying parents with contrasting genotypes and phenotypes for all those traits of interest (Buntjeret al., 2005). Furthermore, the high resolution desired for MAS or cloning candidate genes requires developing large segre-gating populations, possibly difficult in some species (Skot
et al., 2005).
According to Zondervan and Cardon (2004), the main purpose in linkage analysis, as in association mapping, is the detection of correlations between phenotypic variation and genotypes through linkage disequilibrium. However, association analysis has the advantage of contemplating all the meiotic and recombination events that may occur in the www.sbg.org.br
Send correspondence to Tereza Cristina de Oliveira Borba. Em-brapa Arroz e Feijão, Rodovia GO-462, km 12, Zona Rural, Caixa Postal 179, 75375-000 Santo Antônio de Goiás, GO, Brazil. E-mail: [email protected].
evaluated population (Ferreira and Grattapaglia, 2006). Furthermore, this form is highly dependent on the extent of linkage disequilibrium (LD), a higher degree implying the use of less markers per chromosome, without the loss of ge-netic resolution for marker assisted selection (MAS) (Ros-tokset al., 2006). As rice is a self-pollinating species, it is expected to present high linkage disequilibrium (Flint-Garciaet al., 2003), thereby requiring fewer markers. In ad-dition, the recent bottlenecks encountered since the begin-ning of rice breeding have given rise to high linkage disequilibrium blocks, thereby facilitating association stud-ies (Patronet al., 2002).
One of the great advantages of association mapping lies in the fact that no mapping population needs to be de-veloped, as the sampling of non-related individuals repre-sents a series of advantages towards developing and vali-dating MAS in breeding programs (Janninket al., 2001), as well as an opportunity for increasing the exploitation of germplasm accessions in the search for advantageous allele combinations. Such a strategy, unlike traditional linkage analysis, facilitates the search for functional variation in a much broader germplasm context (Zhuet al., 2008). Thus, experimental populations may constitute a representative sample of a larger population for which inferences are sought (Breseghello and Sorrels, 2006b). In panels with highly divergent individuals and assumed random mating, only polymorphisms with extremely tight linkage to a locus with desirable phenotypic effects are likely to be signifi-cantly associated with a given trait (Remington et al., 2001). Furthermore, association analysis can benefit by in-cluding data collected over years of experimental analysis with genotypes of breeding programs, with the additional possibility of analyzing several traits simultaneously.
Improving grain yield and quality are important chal-lenges in rice breeding, thus priorities for the international market (Fanet al., 2005). Although quality assumes many aspects and is highly related to preference in diverse cul-tures, its characteristics are mainly defined by milling prop-erties, grain size and shape, cooking and eating characteris-tics, and nutritional qualities (Heet al., 1999). According to Heet al. (1999), of these the most relevant are appearance and cooking quality, reported to be directly related to amylose content, gel consistency and gelatinization tem-perature (Fanet al., 2005).
The aims of this work were to analyze and identify the association of simple sequence repeat (SSR) markers with yield and grain quality traits in a panel of accessions from the Embrapa Rice Core Collection (ERiCC), represented by breeding material from Brazil and other countries.
Material and Methods
Plant material and genomic DNA extraction
The evaluated panel of 242 accessions from ERiCC (Abadieet al., 2005) was composed of: a) 94 accessions of
inbred lines and cultivars developed by rice breeding pro-grams in Brazil (57 upland and 37 lowland accessions); and b) 148 accessions of inbred lines and cultivars developed by breeding programs worldwide (76 upland and 72 low-land accessions) (Table S1). Each accession was evaluated in a four-plant bulk, the total genomic DNA being extracted as described by Brondaniet al.(2002).
Phenotypic data
The phenotypic evaluation of 242 ERiCC accessions was carried out in Santo Antônio de Goiás, the state of Goiás, Brazil (altitude 749 m; 16°40’43” S; 49°15’14” W), in 2004 and 2005, under irrigated condi-tions, following an augmented block design with plots of 4 rows x 5 m, at a density of 20 plants m-1. Data were taken from the two middle rows and the 4 central meters of each. In 2004, the following traits were evaluated: 1) YLD -grain yield, in kg ha-1; 2) TILN - tiller number per plant; and 3) PANN - panicle number per plant. In 2005, two traits were evaluated: YLD and the yield from ratooning (RYLD), this being the yield from the second harvest, ap-proximately 40 days post-main. In both years, grain qual-ity data were evaluated for cooking and milling traits, measured as to amylose content (AC) and head-milled rice (MR), respectively. Amylose content was determined ac-cording to Juliano (1979), whereas head-milled rice was measured as the proportion of the weight of whole kernels over the weight of paddy rice. The descriptive statistics of phenotypic data were computed using the Genes 4.1 pro-gram (Cruz, 1997).
SSR characterization of ERiCC
Statistical analysis
Allele diversity and genetic structure:The 242 inbred lines and cultivars of ERiCC were analyzed in a pooled DNA sample, composed of four individual plants. From SSR analysis, heterogeneity (the presence of individual heterozygous or homozygous plants with different alleles in the bulk) was evident in certain accessions. In order to proceed with association analysis, the accessions were treated as pure lines, under the definition of working leles, and represented by the most common allele. Rare al-leles (frequency below 5%) were treated as missing data in population structure analysis, and as null alleles in associa-tion analysis, according to the strategy described by Bre-seghello and Sorrels (2006a). The hypothesis of division from one to four subpopulations was tested with structure software (Pritchard et al., 2000), allowing for admixture and correlated allele frequencies, with a burn-in of 10,000 and a run-length of 100,000. TheFstparameter (software FSTAT 2.9.3.2; Goudet, 2002) and factorial correspon-dence analysis (FCA) (software Genetix 4.03; Belkhiret al., 2004) were also applied for investigating accession ge-netic structure.
Association analysis:The association between mark-ers and phenotypic traits was done using the Mixed Linear Model (MLM), an available option in Tassel version 1.9.6 software, where markers tested and subpopulation data (Q matrix) were considered as fixed-effect factors, whereas the kinship matrix was considered as a random-effect fac-tor. The kinship matrix was obtained from SPAGeDi ver-sion 1.2 software (Hardy and Vekemans, 2002). To confirm the significance of associations between loci and traits, a correction for multiple testing was applied using the false discovery rate (FDR) method with Qvalue version 1.0 soft-ware (Storey, 2002). The FDR level was set at 0.05, and the
p0 method for bootstrap analysis. The FDR method,
ex-pressed as aq-value, is defined as the expected proportion
of true null hypotheses within the class of rejected null hy-potheses (Kraakmanet al., 2004).
The significance of differences between allele effects was obtained from Kruskal-Wallis nonparametric rank test-ing withR program (R Development Core Team). Non-parametrical multiple test procedures, regarding amylose content and each pair of alleles, were carried out as de-scribed by Campos (1983).
Results
Phenotypic data
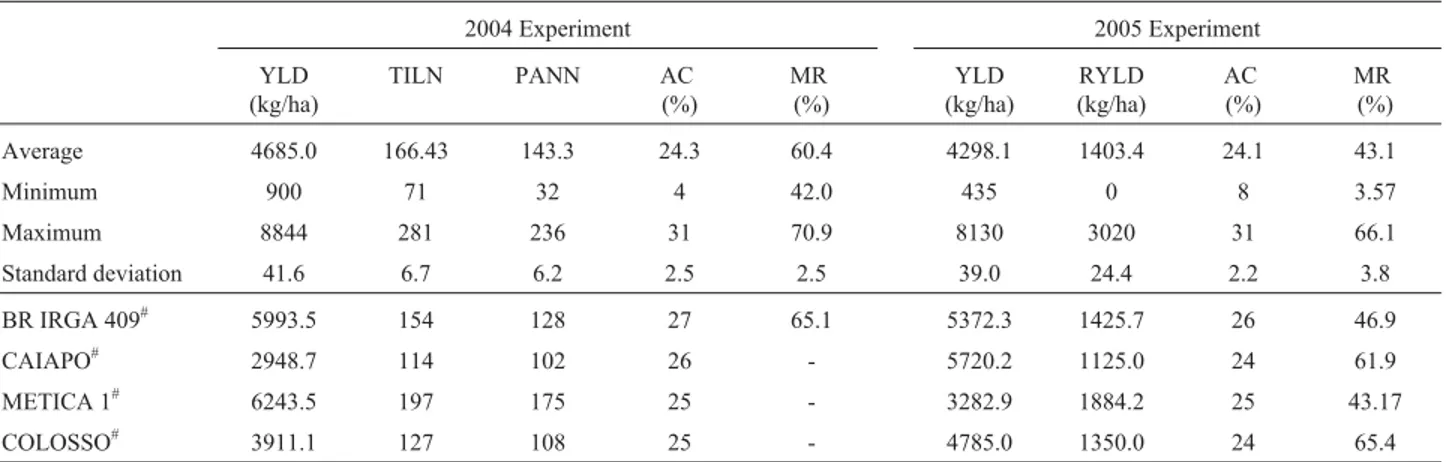
Experimental field data were distributed normally, except for traits related to grain quality (AC and MR). ERiCC accessions revealed wide variation in performance of all the evaluated traits (Table 1). In the 2004 experiment, the firmest correlation detected was between TILN and PANN (0.88; p < 0.01), and in the 2005, between YLD and MR (0.38; p < 0.01) (Table 2). No correlation was detected in yield data from 2004 and 2005 experiments.
Allele diversity and population structure
A total of 1,066 alleles were detected with the set of 86 SSR markers on a panel of 242 accessions. The average number of alleles per locus was 12.4, ranging from three (RM484) to 32 (RM204). Most loci presented one or more alleles with a frequency below 5%. These rare alleles repre-sented, approximately, 48% of the total allele number, and to avoid an increase in variance errors in association analy-sis, they were not considered. The remaining alleles (554), referred to as common alleles, ranged from two to eight per locus. In lowland accessions, the mean was 4.80 alleles per locus, with gene diversity of 0.64, whereas in upland acces-sions this was 4.76 alleles per locus and gene diversity 0.56. Common SSR alleles were used to check the structure of ERiCC genetic variation. The model-based clustering method resulted in the highest likelihood from data,i.e.the
Table 1- Descriptive statistics for yield (YLD), tiller number (TILN), panicle number (PANN), yield from ratooning (RYLD), amylose content (AC) and head-milled rice (MR).
2004 Experiment 2005 Experiment YLD
(kg/ha)
TILN PANN AC (%) MR (%) YLD (kg/ha) RYLD (kg/ha) AC (%) MR (%) Average 4685.0 166.43 143.3 24.3 60.4 4298.1 1403.4 24.1 43.1
Minimum 900 71 32 4 42.0 435 0 8 3.57
Maximum 8844 281 236 31 70.9 8130 3020 31 66.1
Standard deviation 41.6 6.7 6.2 2.5 2.5 39.0 24.4 2.2 3.8 BR IRGA 409# 5993.5 154 128 27 65.1 5372.3 1425.7 26 46.9
CAIAPO# 2948.7 114 102 26 - 5720.2 1125.0 24 61.9
METICA 1# 6243.5 197 175 25 - 3282.9 1884.2 25 43.17
COLOSSO# 3911.1 127 108 25 - 4785.0 1350.0 24 65.4
#
probability that a given individual originated from a certain population, when the number of subpopulations (k) was set at 2, thereby indicating a subdivision among accessions caused by the cultivation system (lowland or upland rice accessions). No population structure was detected due to the origin of accessions (Brazilian or worldwide breeding programs).
Thirty-two accessions (13%) were predicted to have admixed ancestry, this meaning that their origin could not be attributed exclusively to one of the two inferred subpo-pulations. Consequently, they were discarded from the analysis. Association analysis was then undertaken with 210 ERiCC accessions (92 lowland and 118 upland). The overallFststatistics across subpopulations was 0.775, and
Fstvalues for lowland and upland groups were 0.135 and 0.205, respectively, thereby indicating high differentiation among subpopulations, and low to intermediate levels of
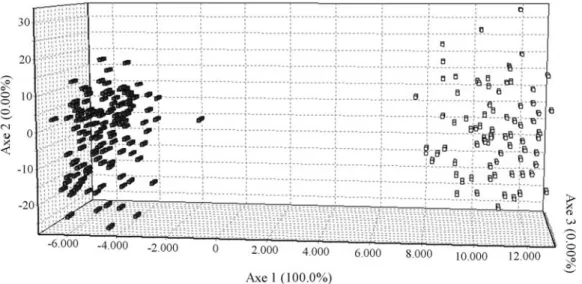
differentiation within accessions from the same subpopulation. FCA was applied in order to visualize the subdivision among accessions, whereby it was possible to confirm the division into two subpopulations, based on the cultivation system (Figure 1).
Association analysis
Three different accession panels, viz., a complete panel of 210 accessions, and from this, 92 lowland acces-sions and 118 upland, were analyzed (association analysis). 23 SSR markers (27%) in the complete panel were identi-fied as being significantly associated to at least one of the evaluated traits (data not shown). On considering the low genomic coverage of the SSR set, and the complexity of the traits evaluated, the number of associated markers was high, thereby implying the presence of spurious marker-trait associations. On considering the system of cultivation Table 2- Pearson correlation coefficients among the phenotypic traits: yield (YLD), tiller number (TILN), panicle number (PANN), yield from ratooning (RYLD), amylose content (AC) and head-milled rice (MR).
2004 Experiment 2005 Experiment YLD
(kg/ha)
TILN PANN AC (%)
MR (%)
YLD (kg/ha)
RYLD (kg/ha)
AC (%)
MR (%) 2004
Experiment
YLD
-TILN 0.20**
PANN 0.31** 0.88**
AC 0.19** 0.26** 0.25**
MR 0.31** - -
-2005 Experiment
YLD - - - -
-RYLD - - -
-AC - - - 0.82** - 0.20** 0.26**
MR - - - - 0.14* 0.38** - -
-Only significant values are shown (*p < 0.05; **p < 0.01).
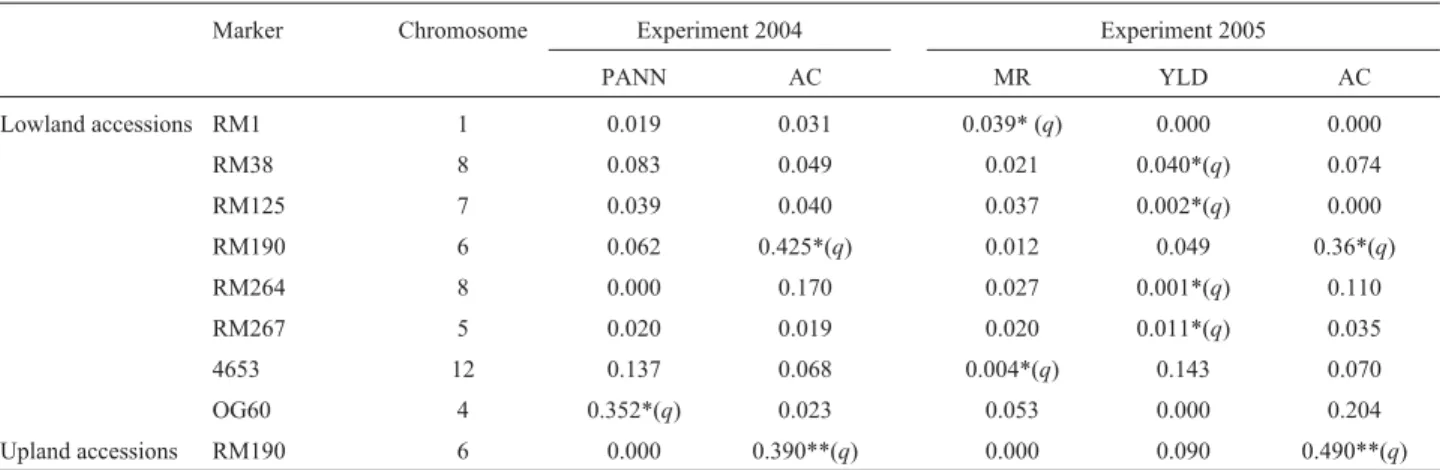
as the main generator of genetic structuring among all the 210 accessions, and using subpopulations as a basis for re-analysis, two accession panels were defined, with a lower number of marker-trait associations. From the 86 SSRs, eight markers were associated with four traits in low-land, and only one with amylose content in upland acces-sions (Table 3). In lowland accesacces-sions, the marker OG60 was associated with PANN in the 2004 experiment and RM190 with AC in both the 2004 and 2005. In 2005, two markers (RM1 and 4653) were associated with MR, and four (RM264, RM267, RM125 and RM38) with YLD. In upland accessions and in both years, there was a significant association of only RM190 with AC. There was no associa-tion with any marker in the case of RYLD and TILN. De-spite the significant associations between marker-trait, the only consistent association over years and cropping sys-tems was between the RM190 marker and AC. This associ-ation was also significant in the analysis of all the 210 accessions (data not shown).
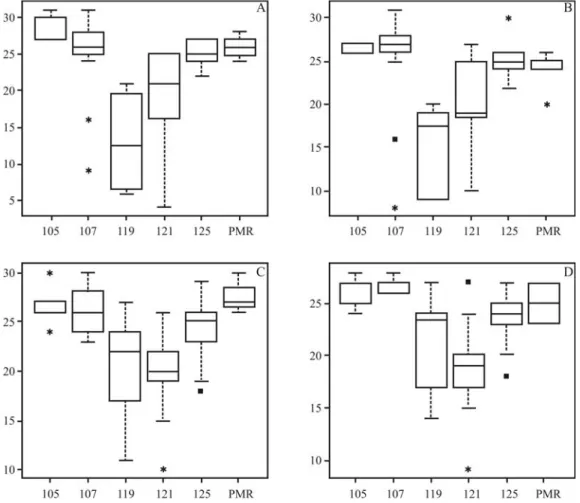
On considering the 210 accessions, six alleles (fre-quencies over 5%) were distinguished for RM190, with four common in both accession panels (alleles 105, 107, 121 and 125 bp). However, two alleles (117 and 119 bp) were identi-fied (frequencies over 5%) one each only in upland and low-land accession panels, respectively (Figure 2). From Kruskal-Wallis testing, it was possible to identify a signifi-cant difference in allele effects across lowland and upland panel accessions From a multiple test based on a non-parametrical approach it was possible to identify the rela-tionships of the six RM190 alleles with diverse classes of amylose content, as well as positive and significant correla-tion, for both years, in upland and lowland panel accessions (0.58 with p < 0.01, and 0.54 with p < 0.01, respectively).
In the lowland accession panel, the 105 and 107 bp (base pair) alleles presented significantly different effects from the remainder. According to 2004 and 2005
experi-mental data, both were correlated to higher amylose content than the others, although in 2004, there was a significant difference between the two themselves, with the 105 bp re-vealing higher AC than the 107 bp (Table 4). Despite statis-tical differences between AC and the respective alleles, no clear pattern in allele effects could be identified in lowland accessions. In the upland accession panel, both in 2004 and 2005, 121 bp allele AC was lower than in 105, 107 and 125 bp, whereas in 2005, 117 bp allele AC was lower than in 105 and 107 bp. As with lowland accessions, no clear pattern in allele effects was identified.
Discussion
SSR allele diversity and population structure
A set of 86 highly informative SSR markers was used in genotyping ERiCC inbred lines and cultivars. The num-ber of common alleles detected (frequency³5%) was simi-lar to that previously identified for inbred rice lines and cultivars (Luet al., 2005). In the present work, rare alleles were not integrated into analysis, as low frequency alleles inflate variance estimates of linkage disequilibrium (Re-mingtonet al., 2001). Additionally, rare alleles are more susceptible to bias caused by covariance between markers and population structure, thus increasing the chance of type I error (Breseghello and Sorrels, 2006a). The presence of admixture also contributes to overestimating linkage dis-equilibrium, due to causes not related to physical connec-tions on a chromosome (Flint-Garciaet al., 2003).
According to Breseghello and Sorrels (2006a), the se-lection process of a minimum sample with maximum varia-tion results in a normalizing effect that is expected to mini-mize population structure, thereby creating a favorable situation for association analysis. Structure-presence speci-fication is a prior requirement in core collections, since cer-tain procedures adopted to build these collections may lead
Table 3- Association of SSR markers with phenotypic traits. The statistics shown refer to the coefficient of determination (R2).
Marker Chromosome Experiment 2004 Experiment 2005
PANN AC MR YLD AC
Lowland accessions RM1 1 0.019 0.031 0.039* (q) 0.000 0.000
RM38 8 0.083 0.049 0.021 0.040*(q) 0.074
RM125 7 0.039 0.040 0.037 0.002*(q) 0.000 RM190 6 0.062 0.425*(q) 0.012 0.049 0.36*(q) RM264 8 0.000 0.170 0.027 0.001*(q) 0.110 RM267 5 0.020 0.019 0.020 0.011*(q) 0.035 4653 12 0.137 0.068 0.004*(q) 0.143 0.070
OG60 4 0.352*(q) 0.023 0.053 0.000 0.204
Upland accessions RM190 6 0.000 0.390**(q) 0.000 0.090 0.490**(q)
Panicle number (PANN); amylose content (AC); head-milled rice (MR); yield (YLD).
to a structured accession panel. The stratification of acces-sions into meaningful groups, with the maximum variation between groups and the minimum within, as suggested by van Hintumet al. (2000), may result in accession panels with low potential for detecting gene effects through asso-ciation analysis, since most variance is attributed to popula-tion structure. ERiCC inbred lines and cultivars were
origi-nally selected according to the origin of accessions (Brazil or worldwide breeding programs), and their system of culti-vation (lowland or upland) (Abadie et al., 2005). The ERiCC structure based on a cultivation system is probably due to most lowland accessions being fromindica subspe-cies, whereas upland accessions are mostly fromjaponica
(Khush, 1997).
Figure 2- Empirical distribution of amylose content (y-axis) among alleles identified for RM190 SSR (x-axis). The subdivisions in amylose content data refer to quartile division, and the lines in boxes are the median of amylose content in each allele. The A and B boxes refer to amylose content data on low-land accessions from the 2004 and 2005 experiments, respectively. The C and D boxes refer to amylose content data on uplow-land accessions from the 2004 and 2005 experiments, respectively. The pool of rare and missing alleles is represented by the PMR denominated allele.
Table 4- Pairwise statistical differences in average amylose content values of each identified allele of the RM190 marker in both accession panels and over experimental years.
105 107 117 119 121 125 PMR
105
-107 L/04
-117 U/05 U/05
-119 L/04, L/05 L/04, L/05 -
-121 L/04, U/04, U/05 L/04, L/05, U/04, U/05 - -
-125 L/04 L/05 - - U/04, U/05
-PMR - - - - U/04 -
A very substantial differentiation between lowland and upland accessions was identified, after the removal of rare alleles and admixed accessions, with Fst increasing from 0.11 to 0.77. In Garriset al.(2005),Fstvalues for in-dicaandtemperate japonicaandindicaandtropical japon-icaaccessions were, respectively, 0.43 and 0.36, with the proportion of admixed ancestry estimated at 10%. The higherFstvalue identified between lowland and upland ac-cession panels, even when compared to the divergent in-dicaandjaponicaaccessions found by Garriset al.(2005), may be due to the elimination of rare alleles and accessions with mixed ancestry, thereby increasing divergence be-tween the two.
Association analysis
Despite the broad genome coverage provided by the set of 86 SSR markers used in the analysis, the whole ge-nome scan designed for association analysis was limited by the low density of markers. However, due to numerous bot-tlenecks in the history of rice domestication, the level of linkage disequilibrium in some regions is estimated to be greater than the 250 kb found inArabidopsis(Garriset al., 2003). Considering this situation, a target marker can be as-sociated to a candidate gene responsible for certain traits, even though thousands of base pairs apart, thereby favoring marker-assisted selection procedures.
Association analysis with MLM combines informa-tion from kinship and populainforma-tion structure, thereby reduc-ing type I errors (Yu et al., 2006), that is the error of rejecting a null hypothesis when it is actually true. Here, 23 SSR markers, associated to yield and grain quality traits, were identified, when such an approach was applied to the panel of 210 accessions. Agramaet al.(2007), on using the same model in association analysis of yields and their com-ponents in 103 rice germplasm accessions with 123 SSR markers, identified 25 marker-trait associations with 21 SSRs. The main subpopulations identified from their data set corresponded to the geographic origin of accessions. However, from our results there was every indication that the subdivision of the evaluated accessions could be attrib-uted to differences in the cultivation system. In the case of Agramaet al.(2007), the difference could be due to bias in favor ofjaponicaas againstindicaaccessions, for, from the 103 rice accessions, 49 corresponded to japonica acces-sions, whereas 25 were classified as of an admixed ances-try, mainly between those with anindica and temperate
japonicabackground.
In a comparative analysis of yield components, with data from 2004 and 2005, a difference was noted, from one year to the next, in the marker-trait association of yield-related genes, as detected by SSR markers. Quantitative ag-ronomic traits, such as yield, are especially affected by the interaction of both genotype and environment, an under-standing of how this interaction is controlled being a basis
for defining breeding strategies that would improve genetic gains within these traits.
Two markers (RM38 and RM267) were previously detected by QTL mapping. RM38 was related to yield when assaying 190 lines in anindicax japonicadouble-haploid population, genotyped with 179 SSR markers for agro-nomic traits in a two-year replicated-field experiment (Jianget al., 2004). This finding was corroborated by Marri
et al.(2005) who also found the RM38 marker related to a yield QTL (R2of 7.99), by using an interspecific population of 251 advanced backcross families (O. rufipogon x O. sativa), genotyped with 80 SSR markers. Choet al.(2003) identified the association of RM267 with a yield QTL de-tected in an interspecific backcross F2 population (O. rufipogonxO. sativa). A recent study in rice, dealt with the association between markers previously identified as linked at QTLs (Agramaet al., 2007). With this base, QTL analysis can be considered a pre-requisite for distinguish-ing markers related to important traits, by constitutdistinguish-ing, to-gether with complementary association studies using highly divergent accession panels from core collections, a means of identifying the different alleles of these markers and attributing phenotypic weights to each.
No difference in allelic effects on yield was identified through association analysis, when considering markers previously associated to this trait in rice. This may be due to the complex inheritance of the YLD trait, as not only a sin-gle allele, but also epistatic alleles are involved. Haplotypes related to highest performance may be identified through association analysis, and, an additional advantage over QTL mapping analysis, values can be attributed to alleles present in a given panel of individuals, whereby the most favorable combinations can be traced by breeders in all elite lines and cultivars. Consequentially, there is an in-crease in the capacity of novel sets in detecting marker-trait associations, even of alleles with minor or modest phenotypic effects (Risch and Zhang, 1996). In QTL link-age analysis, on the contrary, only a maximum of two alleles per locus are involved (diploid individual), with de-tection being restricted to the size of the effect and the pres-ence of contrasts between genitor alleles in the desired trait. As to grain quality traits, RM1 was associated to MR in the 2005 field experiment, and to yield QTL in previous works (Yuet al., 1997; Brondaniet al., 2002; Septiningsih
et al., 2003), thereby indicating its location in a genomic re-gion, and thus requiring detailed analysis, in order to iden-tify genes and alleles of agronomic interest. In Brazil, rice breeders consider MR to be a very important trait, since cultivars, wherein the percentage of intact grains falls be-low 60%, are considered to be economically of less value. As to RM190 (Waxygene), which is related to expression of the granule-bound starch-synthase enzyme, and is lar-gely responsible for amylose content in rice grains (Ayres
analysis (Heet al., 1999; Tanet al., 1999; Lanceraset al., 2000; Septiningsihet al., 2003; Zhouet al., 2003; Alukoet al., 2004; Fanet al., 2005). AC was significantly related to RM190 through association analysis in both panels of up-land and lowup-land accessions, throughout the two years.
The confirmation of an association between the RM190 marker and AC, when using core collection acces-sions, is additional evidence of efficiency in applying asso-ciation analysis to gene identification. The significant results from Kruskal-Wallis testing, comprising experi-mental years and accession panels, implies that at least one of the alleles, exerted a discriminating effect on amylose content. Nevertheless, in spite of the lack of complete cor-respondence between RM190 alleles and amylose content, as to experimental-year and accession panel, some indica-tion of a correlaindica-tion for alleles 105 and 107 bp to intermedi-ate amylose content, in the panel of lowland accessions and by experimental year, was found. On evaluating a panel of 89 non-waxy accessions, Ayres et al. (1997) identified seven alleles from a SSR marker in theWxgene, whence four were correlated with different patterns of amylose con-tent (high, intermediate and low), thus defining approxi-mately 83% of AC variation. Bao et al. (2006) when examining a panel of 499 non-waxy accessions with RM190, identified ten alleles that together accounted for nearly 90% of AC variation. The difference of allelic corre-lation to amylose content classes recorded in the present work, Ayreset al.(1997) and Baoet al.(2006), could be due to the different composition of accession panels, since Ayreset al.(1997) analyzed a set of rice accessions from the U.S.A. with a narrower genetic base when compared to the ERiCC accession panel. Baoet al.(2006), when com-paring the ERiCC accession panel, analyzed a panel of germplasm accessions with low diversity for theWaxySSR marker, since from the ten alleles identified, only two ac-counted for a frequency of approximately 83%. The evalua-tion of germplasm accessions with a narrower genetic basis may be reflected in a low variation in modifier genes that could influence AC, particularly at theWaxy locus. This low variation in rice genomes, even in traits controlled by epistatic alleles, may restrict phenotypic trait variability. On the other hand, a wider genetic basis, as found in ERiCC accessions, could increase AC phenotypic variation, due to the allelic variability in genes located upstream of theWaxy
gene in the starch synthesis route. This would reduce the power of a marker assisted selection in pre-breeding and breeding programs, if based solely onWaxygene alleles, thereby requiring, as mandatory, the study of allelic varia-tion in transcripts from the starch synthesis route in rice grains. As with Ayreset al.(1997), RM190 alleles with no relation to any specific class of amylose content were ob-served in the present work.
Starch makes up for 90% of polished grain in rice, and AC is recognized as one of the most important components in rice grain products (Baoet al., 2006). The use of marker
assisted selection for this trait would be of help in breeding programs, since accessions could be genotyped at an early stage for a trait that is normally evaluated after harvesting. However, the lack of correspondence in RM190 alleles to specific AC classes, as well as rice accessions with similar AC values, maybe showing differences in rice eating and textural qualities (Baoet al., 2006), indicate the need for further studies before MAS implementation. Currently in the Embrapa breeding program, AC analysis is an annual, routine procedure in hundreds of inbred lines. In advanced elite inbred lines, the result of this analysis is being corre-lated with the direct determination of gel consistency and pasting viscosity by a panel of trained panelists, by using a small quantity of grains cooked in Petri dishes, thereby pro-viding precise standards for defining grain quality.
This study demonstrated the feasibility of conducting association analysis together with germplasm characteriza-tion of a rice core colleccharacteriza-tion using SSR markers. It also fa-cilitated the identification of markers related to yield, panicle number, milled-head rice and amylose content, in a panel of genetically unrelated ERiCC accessions. Quantita-tive traits, such as yield, have complex gene and allele in-teractions, and studies to dissect this trait may start from QTL analysis, due to consolidated statistics and higher res-olution potential. The expected high linkage disequilibrium of rice inbred lines and cultivars, although facilitating the detection of marker-trait associations, makes gene identifi-cation more difficult, since LD spans many thousands of base pairs. However, for breeding purposes the correlations detected by association analysis may be sufficient for marker assisted selection and mining alleles related to im-portant traits in germplasm collections.
Acknowledgments
We gratefully acknowledge the Ph.D. scholarship for Tereza Borba and financial support from CNPq.
References
Abadie T, Cordeiro CMT, Fonseca JR, Alves RBN, Burle ML, Brondani C, Rangel PHN, Castro EM, Silva HT, Freire MS,
et al.(2005) Constructing a rice core collection for Brazil. Pesq Agropec Bras 40:129-136.
Agrama HA, Eizenga GC and Yan W (2007) Association map-ping of yield and its components in rice cultivars. Mol Breed 19:341-356.
Aluko G, Martinez C, Tohme J, Castano C, Bergman C and Oard JH (2004) QTL mapping of grain quality traits from the interspecific cross Oryza sativa x O. glaberrima. Theor Appl Genet 109:630-639.
Ayres NM, McClung A, Larkin PD, Bligh HFJ, Jones CA and Park WD (1997) Microsatellites and a single nucleotide polymorphism differentiate apparent amylose classes in an extended pedigree of US rice germplasm. Theor Appl Genet 94:773-781.
starch-synthesizing genes in relation to starch physicochemical properties in nonwaxy rice (Oryza sativaL.). Theor Appl Genet 113:1185-1196.
Breseghello F and Sorrels ME (2006a) Association mapping of kernel size and milling quality in wheat (Triticum aestivum
L.) cultivars. Genetics 172:1165-1177.
Breseghello F and Sorrels ME (2006b) Association analysis as a strategy for improvement of qualitative traits in plants. Crop Sci 46:1323-1330.
Brondani C, Rangel PHN, Brondani RPV and Ferreira ME (2002) QTL mapping and introgression of yield related traits from
Oryza glumaepatulato cultivated rice (Oryza sativa) using microsatellite markers. Theor Appl Genet 104:1192-1203. Brondani RPV and Grattapaglia D (2001) Cost-effective method
to synthesize a fluorescent internal DNA standard for auto-mated fragment sizing. Biotechniques 31:793-800. Buntjer JB, Sorensen AP and Peleman JD (2005) Haplotype
di-versity: The link between statistical and biological associa-tion. Trends Plant Sci 10:466-471.
Campos H (1983) Estatística Experimental Não-Paramétrica. 4ª edição. ESALQ, Piracicaba, 349 pp.
Cho YC, Suh JP, Choi IS, Hong HC, Baek MK, Kang KH, Kim
YG, Ahn SN, Choi HC, Hwang HG,et al. (2003) QTLs
analysis of yield and its related traits in wild rice relative
Oryza rufipogon. Treat Crop Res 4:19-29.
Cruz CD (1997) Programa Genes: Aplicativo Computacional em Genética e Estatística. 1ª edição. Editora UFV, Viçosa, 442 pp.
Fan CC, Yu XQ, Xing YZ, Xu CG, Luo LJ and Zhang Q (2005) The main effects, epistatic effects and environmental inter-actions of QTLs on the cooking and eating quality of rice in a doubled-haploid line population. Theor Appl Genet 110:1445-1452.
Ferreira ME and Grattaplaglia D (2006) Genética de associação em plantas. In: Borém A and Caixeta, ET (eds) Marcadores Moleculares. Editora UFV, Viçosa, pp 273-306.
Flint-Garcia AS, Thornsberry JM and Buckler ES (2003) Struc-ture of linkage disequilibrium in plants. Annu Rev Plant Biol 54:357-374.
Garris AJ, McCouch SR and Kresovich S (2003) Population structure and its effect on haplotype diversity and linkage disequilibrium surrounding the xa5 locus of rice (Oryza sativaL.). Genetics 165:759-769.
Garris AJ, Tai TH, Coburn J, Kresovich S and McCouch S (2005) Genetic structure and diversity inOryza sativaL. Genetics 169:1631-1638.
Hardy OJ and Vekemans X (2002) SPAGeDi: A versatile com-puter program to analyse spatial genetic structure at the indi-vidual or population levels. Mol Ecol Notes 2:618-620. He P, Li SG, Qian Q, Ma YQ, Li JZ, Wang WM, Chen Y and Zhu
LH (1999) Genetic analysis of rice grain quality. Theor Appl Genet 98:502-508.
Jannink JL, Bink CAMM and Jansen RC (2001) Using complex plant pedigrees to map valuable genes. Trends Plant Sci 6:337-342.
Jiang GH, Xu CG, Li XH and He YQ (2004) Characterization of the genetic basis for yield and its component traits of rice re-vealed by doubled haploid population. Yi Chuan Xue Bao 31:63-72.
Juliano B (1979) Amylose analysis - A review. In: Chemical As-pects of Rice Grain Quality. IRRI, Los Banõs, pp 251-260.
Khush GS (1997) Origin, dispersal, cultivation and variation of rice. Plant Mol Biol 35:25-34.
Kraakman ATW, Niks RF, van den Berg PMMM, Stam P and van Eeuwijk FA (2004) Linkage disequilibrium of yield and yield stability in modern spring barley cultivars. Genetics 168:435-446.
Lanceras JC, Huang ZL, Naivikul O, Vanavichit A, Ruanjaichon V and Tragoonrung S (2000) Mapping of genes for cooking and eating qualities in Thai jasmine rice (KDML105). DNA Res 7:93-101.
Lu H, Redus MA, Coburn JR, Rutger JN, McCouch SR and Tai TH (2005) Population structure and breeding patterns of 145 U.S. rice cultivars based on SSR marker analysis. Crop Sci 45:66-76.
Marri PR, Sarla N, Reddy LV and Siddiq EA (2005) Identification and mapping of yield and yield related QTLs from an Indian accession ofOryza rufipogon. BMC Genet 6:1-14. Patron NJ, Smith AM, Fahy BF, Hylton CM, Naldrett MJ,
Ros-snagel BG and Denyer K (2002) The altered pattern of amylose accumulation in the endosperm of low-amylose barley cultivars is attributable to a single mutant allele of granule-bound starch synthase I with a deletion in the 5’-non-coding region. Plant Physiol 130:190-198.
Peleman JD and van der Voort JR (2003) Breeding by design. Trends Plant Sci 8:330-334.
Pritchard JK, Stephens M and Donnelly P (2000) Inference of population structure using multilocus genotype data. Genet-ics 155:945-959.
Remington DL, Thornsberry JM, Matsuoka Y, Wilson LM, Whitt SR, Doebley J, Kresovich S, Goodman MM and Buckler ES (2001) Structure of linkage disequilibrium and phenotypic associations in the maize genome. Proc Natl Acad Sci USA 98:11479-11484.
Risch N and Zhang H (1996) Mapping quantitative trait loci with extreme discordant pairs, sampling considerations. Am J Hum Genet 58:836-843.
Rostoks NT, Ramsay L, Mackenzie K, Cardle L, Bhat PR, Roose ML, Svensson JT, Stein N, Varshney RK, Marshall DF,et al.(2006). Recent history of artificial outcrossing facilitates whole-genome association mapping in elite inbred crop va-rieties. Proc Natl Acad Sci USA 103:18656-18661. Septiningsih EM, Prasetiyono J, Lubis E, Tai TH, Tjubaryat T,
Moeljopawiro S and McCouch S (2003) Identification of quantitative trait loci for yield and yield components in an advanced backcross population derived from the Oryza sativavariety IR64 and the wild relativeO. rufipogon. Theor Appl Genet 107:1419-1432.
Skot L, Humphreys MO and Armstead I (2005) An association mapping approach to identify flowering time genes in natu-ral populations ofLolium perenne(L.). Mol Breed 15:233-245.
Storey JD (2002) A direct approach to false discovery rates. J R Stat Soc Ser B 64:479-498.
Tan YF, Li JX, Yu SB, Xing YZ, Xu CG and Zhang Q (1999) The three important traits for cooking and eating quality of rice grains are controlled by a single locus in na elite rice hybrid, Shanyou 63. Theor Appl Genet 99:642-648.
Yu JG, Pressoir WH, Briggs I, Bi IV, Yamasaki M, Doebley JF, McMullen MD, Gaut BS, Nielsen DM, Holland JB,et al.
map-ping that accounts for multiple levels of relatedness. Nat Genet 38:203-208.
Yu SB, Li JX, Xu CG, Tan YF, Gao YJ, Li XH, Zhang Q and Maroof MAS (1997) Importance of epistasis as the genetic basis of heterosis in an elite rice hybrid. Proc Natl Acad Sci USA 94:9226-9231.
Zhou PH, Tan YF, He YQ, Xu C and Zhang Q (2003) Simulta-neous improvement for four quality traits of Zhenshan 97, an elite parent of hybrid rice, by molecular marker-assisted se-lection. Theor Appl Genet 106:326-331.
Zhu C, Gore M, Buckler ES and Yu J (2008) Status and prospects of association mapping in plants. Plant Genome 1:5-20.
Zondervan KT and Cardon LR (2004) The complex interplay among factors that influence allelic association. Nat Rev Genet 5:89-100.
Internet Resources
Belkhir K, Borsa P and Chikhi L (2001) Genetix v. 4.05.2. Université de Montpellier.
http://www.univ-montp2.fr/~genetix/genetix/genetix.htm (May 5, 2004).
Goudet J (2002) FSTAT, v. 2.9.3.2.
http://www.unil.ch/izea/softwares/fstat.html (February 5, 2002).
RDevelopment Core Team. http://www.r-project.org (January 4, 2006).
Tassel software, v. 1.9.6. http://www.maizegenetics.net (Decem-ber 2, 2006).
van Hintum TJL, Brown AHD, Spillane C and Hodgkin T (2000) Core collections of plant genetic resources. http://www.bioversityinternational.org/publica-tions/pubfile.asp?ID_PUB = 614 (December 2, 2006).
Supplementary Material
The following online material is available for this article: Table S1. Identification of ERiCC accessions, their origin and
common name.
Table S2. Identification and information on SSR Markers used for ERiCC evaluation
This material is made available as part of the online article from http://www.scielo.br.gmb.
Associate Editor: Everaldo Gonçalves de Barros
CNPAF Germplasm Bank Identification Number
Cultivation
System* Origin** Common Name
1 CNA0000082 L Suriname AWINI
2 CNA0000122 L India ARC-10666
3 CNA0000586 L Sri Lanka BG 090-2
4 CNA0000692 L India BKN 6820-6-3-2
5 CNA0000754 L Peru CHANCAY
6 CNA0000798 L Colombia CICA 4
7 CNA0000923 L Mexico C 79-272-4-1-2-3-10
8 CNA0000950 L India IET 0355
9 CNA0000952 L Pakistan CR 36-148
10 CNA0001419 L Colombia COLOMBIA 1
11 CNA0001420 L Colombia CARREON
12 CNA0001423 L Colombia TAPURIPA-161
13 CNA0001467 L India IET 2881
14 CNA0002222 L Lao KH.YOUANE (V.T.A 13)
15 CNA0002246 L Lao KH.NGANH TAMAY (SVA 33)
16 CNA0002253 L Lao KH.KHAO BAY (VT-A 25)
17 CNA0002258 L Thailand KU 56-3
18 CNA0002293 L Thailand KU 94-2
19 CNA0002416 L Liberia LAC 12
20 CNA0002437 L Liberia LAC 28
21 CNA0002480 L Cameroon M 40
22 CNA0002482 L Cameroon M 44
23 CNA0002529 L Philippines MEHR
24 CNA0002672 L Thailand NAHNG PAYA 132
25 CNA0002871 L Portugal RIZZOTO 159
26 CNA0003195 L Egypt GZ 944-5-2-2
27 CNA0003196 L Egypt GZ 809-4-1-2
28 CNA0003005 U India 110281
29 CNA0003241 L India PAU 41-306-2-1-PR 405
30 CNA0003411 L Colombia CICA 8
31 CNA0003417 L Japan PI 294351
32 CNA0003446 L Philippines IR 34
34 CNA0003569 L India KAU 2110
35 CNA0003591 L India TNAU 2686-1
36 CNA0003602 L India UPR 79-23
37 CNA0003665 L Taiwan KAOHSIUNG SEN YU 104
38 CNA0003668 L Philippines MTU 7029
39 CNA0004308 L USA CAROLINA SP 407
40 CNA0004552 L Colombia CR 1113
41 CNA0004566 L Colombia METICA 1
42 CNA0004576 L Colombia ZENIT
43 CNA0004579 L Colombia CAMPONI
44 CNA0004625 L Colombia TETEP
45 CNA0004629 L Philippines IR 50
46 CNA0005014 L China WU 10 B
47 CNA0005015 L China YAR AI ZHAO B
48 CNA0005016 L China ZHENSHAN 97 A
49 CNA0005477 L China K ASKHAM 36/14
50 CNA0005478 L China SZU MAIO
51 CNA0005853 L Russia WIR 5621
52 CNA0006910 L Indonesia MANINJAU
53 CNA0006943 L Philippines IR 54 R
54 CNA0006955 L Italy KORAL
55 CNA0006961 L Italy VITRO
56 CNA0007408 L Colombia WC 0144
57 - L Suriname ELONI
58 - L Suriname CIWINI
59 - L Suriname CESWONI
60 - L Philippines IR8
61 - L Philippines IR36
62 - L USA LEBONNET
63 - L India BASMATI 370
64 - L Japan NOURIN MOCHI
65 - L Japan MINAMI HATA MOCHI
66 - L Japan TOMOE MOCHI
67 - L Japan MOGAMI CHIKANARI
68 - L Colombia ORYZICA LHANOS4
69 - L Colombia ORYZICA 1
70 - L Colombia CICA 7
71 - L Colombia CICA 9
72 - L Philippines HUAN-SEN-GO
73 - L - 5287
74 - L - RAMTULASI
75 CNA0000482 U USA BLUEBONNET
76 CNA0001006 U USA DAWN
77 CNA0002524 U France MOROBEREKAN
78 CNA0003287 U France IREM 123-2-1
80 CNA0003289 U France IREM 247
81 CNA0003362 U France IRAT 142
82 CNA0003375 U France IRAT 13
83 CNA0003395 U France IRAT 141
84 CNA0003397 U France IRAT 144
85 CNA0003403 U Nigeria TOX 490-3-108-D1-B-B
86 CNA0004193 U France IREM 656
87 CNA0004428 U France N.7384 [RPL X DANIELA]
88 CNA0004463 U France N.7441 [CA 435 X TAINUNG CHUEN 2]
89 CNA0004480 U France IRAT 124
90 CNA0004487 U France MAKOUTA
91 CNA0004543 U Nigeria TOX 1012-12-3-1
92 CNA0004617 U Nigeria TOX 1011-4-2
93 CNA0004640 U Nigeria TOX 1785-19-18
94 CNA0004697 U France N.2583
95 CNA0004752 U France IRAT 122
96 CNA0004759 U Nigeria TOX 514-16-101-1
97 CNA0004788 U Nigeria TOX 503-4-115-B-B
98 CNA0004796 U Nigeria TOX 516-28-10B-D2-B-B
99 CNA0005277 U Nigeria TOX 1858-114
100 CNA0005326 U Nigeria TOX 1780-8-5
101 CNA0005334 U Nigeria TOX 1871-29
102 CNA0005358 U Nigeria TOX 1858-101
103 CNA0005970 U Nigeria FAROX 299
104 CNA0005972 U Nigeria FAROX 301
105 CNA0005994 U Nigeria TOX 995-208-1-101
106 CNA0006034 U Nigeria ITA 150
107 CNA0006035 U Nigeria ITA 225
108 CNA0006572 U France IREM 195
109 CNA0006574 U France IRAT 112
110 CNA0006940 U USA LEMONT
111 CNA0006941 U USA NEW BONNET
112 CNA0008092 U France L 141
113 CNA0008093 U France L 285
114 CNA0008411 U USA BLUE BELLE
115 CNA0008412 U USA BLUEBONNET 50
116 CNA0008432 U USA LACASSINE
117 CNA0008545 U Colombia CT 11216-10-12-B-BRM-10
118 CNA0009102 U Colombia CT10006-7-2-M-5-1P-3
119 CNA0009113 U Colombia CT10037-9-4-M-1-1P-2-M
120 CNA0009115 U Colombia CT11632-3-3-M
121 CNA0009123 U Colombia CT11891-3-3-3-M
122 CNA0009124 U Colombia CT13364-7-1
123 CNA0009139 U Colombia CT13366-15-4
125 CNA0009197 U Colombia CT13377-8-4
126 CNA0009199 U Colombia CT13381-1-3
127 CNA0009223 U Colombia CT13569-5-7
128 CNA0009227 U Colombia CT13570-3-2
129 CNA0009240 U Colombia CT13572-6-2
130 CNA0009280 U Colombia CT13573-11-2
131 CNA0009319 U Colombia CT13579-3-4
132 CNA0009364 U Colombia CT13581-5-2
133 CNA0009415 U Colombia CT13582-11-4
134 CNA0009561 U Colombia CT13584-12-9
135 CNA0009591 U Colombia CT13585-12-3
136 U - B6149F-MR-19
137 - U Philippines B8503-TB-19-B-3
138 - U - BR4742-B-19-23
139 - U India CUTACK 4
140 - U Philippines IR65907-188-1-B
141 - U France IRAT 10
142 - U Philippines KATAKTARA
143 - U Philippines TB154E-TB-2
144 - U Philippines TB47H-MR-11-51-3
145 - U Philippines YN1905-UUL-62
146 - U Philippines YN906-UUL 65
147 - U China YUNLU N 1
148 - U China YUNLU N 7
149 - L EMBRAPA-CNPAF/ Brazil RS16PL12-35-1-B
150 - L EMBRAPA-CNPAF/ Brazil RS16PL1-34-4-B
151 - L EMBRAPA-CNPAF/ Brazil RS16PL5-12-6-B
152 - L EMBRAPA-CNPAF/ Brazil RS16PL12-10-1-B
153 CNA0001416 L EMBRAPA-CNPAF/ Brazil IPSL 0574
154 CNA0001117 L EEPG/ Brazil EEPG-1-169
155 - L EMBRAPA-CPACT/ Brazil BRS AGRISUL
156 - L EMBRAPA-CPACT/ Brazil BRS BOJURU
157 - L EMBRAPA-CNPAF/ Brazil DIAMANTE
158 - L EMBRAPA-CNPAF/ Brazil BRS FORMOSO
159 - L EMBRAPA-CNPAF/ Brazil MARAJO
160 - L EMBRAPA-CNPAF/ Brazil BRS JABURU
161 - L EMBRAPA-CNPAF/ Brazil BRS BIGUA
162 - L EMBRAPA-CNPAF/ Brazil RIO GRANDE
163 - L EPAGRI/ Brazil EPAGRI 107
164 - L EPAGRI/ Brazil EPAGRI 108
165 - L EPAGRI/ Brazil SCS 111
166 - L EPAGRI/ Brazil SCS 112
167 CNA0001337 L IPEACO/ Brazil IPEACO-SL 1969
168 CNA0001339 L IPEACO/ Brazil IPEACO-SL 0769
170 CNA0001407 L IPEACO/ Brazil IPSL 2070
171 CNA0001413 L IPEACO/ Brazil IPSL 0970
172 CNA0001414 L IPEACO/ Brazil IPSL 0570
173 CNA0001106 L IRGA/ Brazil EEA 405
174 CNA0001107 L IRGA/ Brazil EEA 401
175 CNA0001108 L IRGA/ Brazil EEA 404
176 CNA0001109 L IRGA/ Brazil EEA 406
177 - L IRGA/ Brazil IRGA 409
178 - L IRGA/ Brazil IRGA 413
179 - L IRGA/ Brazil IRGA 416
180 - L IRGA/ Brazil IRGA 417
181 - L IRGA/ Brazil IRGA 418
182 - L IRGA/ Brazil IRGA 419
183 - L IRGA/ Brazil IRGA 420
184 CNA0006129 L EMPASC/ Brazil EMPASC 103
185 CNA0006130 L EMPASC/ Brazil EMPASC 104
186 CNA0001118 U EEPG/ Brazil EEPG-1-269-FURNAS
187 CNA0000963 U IPEACO/ Brazil AMARELAO X GUEDES
188 CNA0000969 U IPEACO/ Brazil HONDURAS X MATAO
189 CNA0000976 U IPEACO/ Brazil SATURNO X PRATAO PRECOCE
190 CNA0000994 U IPEACO/ Brazil ESAV X MATAO
191 CNA0001347 U IPEACO/ Brazil IPEACO-SL 2270
192 CNA0001350 U IPEACO/ Brazil IPEACO-SL 1970
193 CNA0004098 U EMBRAPA-CNPAF/ Brazil XINGU
194 CNA0004120 U EMBRAPA-CNPAF/ Brazil RIO PARAGUAY
195 CNA0004121 U EMBRAPA-CNPAF/ Brazil GUARANI
196 CNA0004141 U EMBRAPA-CNPAF/ Brazil TRIUNFO
197 CNA0004172 U EMBRAPA-CNPAF/ Brazil GUAPORE
198 CNA0004206 U EMBRAPA-CNPAF/ Brazil ARAGUAIA
199 CNA0004748 U EMBRAPA-CNPAF/ Brazil CUIABANA
200 CNA0005180 U EMBRAPA-CNPAF/ Brazil TANGARA
201 CNA0006187 U EMBRAPA-CNPAF/ Brazil CAIAPO
202 CNA0006701 U EMBRAPA-CNPAF/ Brazil CARAJAS
203 CNA0007024 U EMBRAPA-CNPAF/ Brazil CNAX 1503-12-9-4-B
204 CNA0007119 U EMBRAPA-CNPAF/ Brazil AIMORE
205 CNA0007706 U EMBRAPA-CNPAF/ Brazil CONFIANCA
206 CNA0008070 U EMBRAPA-CNPAF/ Brazil PRIMAVERA
207 CNA0008711 U EMBRAPA-CNPAF/ Brazil SOBERANA
208 CNA0005673 U IAC/ Brazil IAC 81-176
209 CNA0005901 U IAC/ Brazil URUCUI
210 CNA0006170 U IAC/ Brazil LS 85-125
211 CNA0006174 U IAC/ Brazil LS 85-158
212 CNA0007799 U IAC/ Brazil IAC 1191
213 CNA0006406 U IAC/ Brazil LS 86-68
215 CNA0005672 U IAPAR/ Brazil L 82-192
216 CNA0006666 U IAPAR/ Brazil A12-286-1-1
217 CNA0006672 U IAPAR/ Brazil A8-204-1-1
218 CNA0008309 U IAPAR/ Brazil L 92-342
219 CNA0006413 U IAPAR/ Brazil L 85-20
220 CNA0006422 U IAPAR/ Brazil IAPAR L 99-98
221 CNA0005650 U IPEACO/ Brazil IPEACO 11-P
222 CNA0005660 U IPEACO/ Brazil IPEACO 77-P
223 CNA0003281 U Brazil IRAT 177
224 CNA0005342 U Brazil RIO VERDE
225 CNA0002123 U EEPG/ Brazil JAPONES X PRAIANA
226 - U IAC/ Brazil IAC 201
227 - U IAC/ Brazil IAC 202
228 - U IAC/ Brazil IAC 165
229 - U IAPAR/ Brazil IAPAR 9
230 - U IAPAR/ Brazil IAPAR 62
231 - U IAPAR/ Brazil IAPAR 63
232 CNA0003490 U Brazil MEARIN
233 CNA0004078 U Brazil
-234 CNA0004243 U Brazil
-235 CNA0005975 U Brazil
-236 CNA0006030 U EMBRAPA-CNPAF/ Brazil
-237 CNA0007425 U EMBRAPA-CNPAF/ Brazil CANASTRA
238 CNA0007937 U EMBRAPA-CNPAF/ Brazil PROGRESSO
239 CNA0008172 U EMBRAPA-CNPAF/ Brazil BONANCA
240 CNA0008305 U EMBRAPA-CNPAF/ Brazil CARISMA
241 CNA0008533 U EMBRAPA-CNPAF/ Brazil MARAVILHA
242 CNA0008540 U EMBRAPA-CNPAF/ Brazil TALENTO
* L = lowland accessions ; U = upland accessions. For comparison with other studies, the lowland accessions used in this study were considered as indica and the upland accessions, as japonica [Khush GS (1997) Origin, dispersal, cultivation and variation of rice. Plant Molecular Biology 35:25-34].
Panel SSR Marker Marker concentration for
multiplexed PCR ( nM) Missing data (%) Fluorochrome
Allele size
range (bp)
Number of
alleles PIC Motif Chromosome References**
RM229 129 5.9 HEX 106–131 11 0.83 (TC)11(CT)5C3(CT)5 11 Chen et al. (1997)
1
RM207 129 3.1 FAM 84–158 23 0.86 (CT)25 2 Chen et al. (1997)
RM222* 129 10 FAM 199–215 12 0.72 (CT)18 10 Chen et al. (1997)
RM1 71.67 0.8 FAM 76-119 23 0.75 (AG)26 1 Panaud et al. (1996)
RM248 150 4.1 HEX 80–104 11 0.81 (CT)25 7 Chen et al. (1997)
2
RM38 71.67 5.7 HEX 246–278 18 0.86 (GA)16 8 Chen et al. (1997)
RM5 71.67 1.8 FAM 109-133 9 0.73 (GA)14 1 Panaud et al. (1996)
3
RM253 71.67 9.8 HEX 89-119 11 0.75 (GA)25 6 Chen et al. (1997)
RM11 71.67 3.6 HEX 123–143 11 0.78 (GA)17 7 Panaud et al. (1996)
4
RM13* 129 4.6 FAM 129–164 15 0.72 (GA)6-GA)16 5 Panaud et al. (1996)
RM252 129 11 FAM 193–277 23 0.62 (CT)19 4 Chen et al. (1997)
RM277 129 1.8 FAM 110–126 8 0.58 (GA)11 12 Temnykh et al. (2000)
5
RM204 129 6.9 HEX 106–194 32 0.87 (CT)44 6 Chen et al. (1997)
RM231 129 10.5 FAM 170–196 10 0.78 (CT)16 3 Chen et al. (1997)
6
OG17 71.67 2.3 FAM 114-180 24 0.77 (CT)24 2 Brondani et al. (2001)
7
OG44* 71.67 2.8 HEX 152-182 15 0.80 (CT)4-23bp-(CT)22-(GT)4-(GC)6 3 Brondani et al. (2001)
OG106* 129 10 FAM 200-250 22 0.90 (CT)27 9 Brondani et al. (2001)
8
4879 129 9.5 HEX 108-150 10 0.80 (AAT)8 4 Rangel (2005)
4653* 129 3.9 FAM 80-170 19 0.85 (AAG)25 12 Rangel (2005)
9
RM224 129 4.1 HEX 124-158 10 0.81 (AAG)8-(AG)13 11 Chen et al. (1997)
RM223* 129 3.6 FAM 139-163 15 0.64 (CT)25 8 Chen et al. (1997)
10
RM257 71.67 4.1 HEX 130-192 22 0.90 (CT)24 9 Chen et al. (1997)
OG61* 129 2.3 FAM 96-152 28 0.88 (CT)18 5 Brondani et al. (2001)
11
RM234 129 0.8 HEX 126-156 13 0.78 (CT)25 7 Chen et al. (1997)
RM103 198 3.0 FAM 300-350 4 0.64 (GAA)5 6 Temnykh et al. (2000)
RM334 258 3.3 FAM 120-210 14 0.86 (CTT)20 5 Temnykh et al. (2000)
12
RM309 198 1.9 HEX 150-180 14 0.79 (GT)13 12 Temnykh et al. (2000)
RM286 138 2.1 FAM 80-140 14 0.84 (GA)16 11 Temnykh et al. (2000)
13
RM125 129 0.3 FAM 100-150 13 0.58 (GCT)8 7 Temnykh et al. (2000)
RM171 71.67 7.5 FAM 310-344 8 0.59 (GATG)5 10 Akagi et al. (1996)
RM484 71.67 7.5 HEX 290-300 3 0.53 (AT)9 10 Temnykh et al. (2001)
14
RM341 71.67 1.0 HEX 110-180 19 0.76 (CTT)20 2 Temnykh et al. (2000)
RM169* 258 0.3 FAM 150-200 14 0.75 (GA)12 5 Temnykh et al. (2000)
15
RM216 129 0.5 HEX 120-155 10 0.81 (CT)18 10 Chen et al. (1997)
RM152 258 0.3 FAM 150-180 10 0.58 (GGC)10 8 Akagi et al. (1996)
16
RM267 129 0.3 HEX 125-175 11 0.49 (GA)21 5 Temnykh et al. (2000)
RM264 180 3.3 FAM 125-195 22 0.83 (GA)27 8 Temnykh et al. (2000)
17
RM263 138 0.8 HEX 164-220 13 0.80 (CT)34 2 Chen et al. (1997)
RM335 180 3.3 FAM 100-170 26 0.90 (CTT)25 4 Temnykh et al. (2000)
18
RM287 138 8.0 HEX 90-140 12 0.75 (GA)21 11 Temnykh et al. (2000)
RM151 258 2.3 FAM 197-220 7 0.74 (TA)23 1 Akagi et al. (1996)
RM271 138 4.3 FAM 75-125 6 0.80 (GA)15 10 Temnykh et al. (2000)
19
RM51 270 14.0 FAM 120-150 9 0.77 (GA)13 7 Chen et al. (1997)
20
RM332 129 12.0 HEX 140-190 6 0.62 (CTT)5-(CTT)14 11 Temnykh et al. (2000)
RM310 116.67 3.3 HEX 80-130 9 0.84 (GT)19 8 Temnykh et al. (2000)
RM9 100 4.5 FAM 120-200 14 0.80 (GA)15GT(GA)2 1 Panaud et al. (1996)
21
RM22* 132 1.3 HEX 150-230 7 0.55 (GA)22 3 Panaud et al. (1996)
RM55 150 3.2 HEX 200-245 18 0.89 (GA)17 3 Chen et al. (1997)
RM266 210 8.8 FAM 100-150 13 0.79 (GA)19 2 Temnykh et al. (2000)
22
RM278 258 1.3 HEX 120-160 17 0.89 (GA)17 9 Temnykh et al. (2000)
RM85 180 2.3 FAM 80-120 8 0.79 (TGG)5(TCT)12 3 Temnykh et al. (2000)
RM117 258 4.2 FAM 190-220 12 0.71 (AG)7 12 Temnykh et al. (2000)
23
RM302 180 1.3 HEX 70-210 8 0.82 (GT)30(AT)8 1 Temnykh et al. (2000)
RM206 258 7.8 FAM 115-210 12 0.80 (CT)21 11 Chen et al. (1997)
24
RM159 258 3.1 HEX 220-280 9 0.75 (GA)19 5 Temnykh et al. (2000)
OG99 71.67 2.3 FAM 110-160 7 0.19 (CT)4TT(CT)4CC(CT)3 – 16pb – (CT)8 3 Brondani et al. (2001)
25
RM261 138 4.5 FAM 100-130 15 0.59 C9(CT)8 4 Chen et al. (1997)
26
RM3 210 3.2 HEX 115-160 4 0.70 (GA)2GG(GA)25 6 Panaud et al. (1996)
RM220 150 2.4 FAM 90-135 9 0.69 (CT)17 1 Chen et al. (1997)
RM280 258 4.1 HEX 140-190 6 0.88 (GA)16 4 Temnykh et al. (2000)
27
RM7 210 3.0 FAM 160-195 15 0.85 (GA)19 3 Panaud et al. (1996)
RM144* 258 9.5 FAM 200-250 15 0.75 (ATT)11 11 Temnykh et al. (2000)
RM243 129 4.2 FAM 85-130 10 0.75 (CT)18 1 Chen et al. (1997)
28
RM317 258 5.0 HEX 120-180 9 0.76 (GC)4(GT)18 4 Temnykh et al. (2000)
RM190* 150 0.5 FAM 100-130 11 0.75 (CT)11 6 Akagi et al. (1996)
RM205 210 0.5 HEX 115-170 14 0.78 (CT)25 9 Chen et al. (1997)
29
RM70 258 11.5 FAM 150-215 11 0.80 (ATT)33 7 Chen et al. (1997)
RM14 270 10.0 HEX 160-120 9 0.81 (GA)18 1 Panaud et al. (1996)
5371* 258 8.4 FAM 150-210 5 0.83 (GAA)14 12 Rangel (2005)
30
RM178 258 4.3 HEX 110-140 8 0.69 (GA)5(AG)8 5 Temnykh et al. (2000)
RM210 129 1.3 FAM 115-175 15 0.87 (CT)23 8 Chen et al. (1997)
31
RM161 198 4.4 HEX 150-200 8 0.59 (AG)20 5 Temnykh et al. (2000)
RM135 198 1.3 FAM 100-140 5 0.55 (CGG)10 3 Akagi et al. (1996)
32
OG10* 258 0.0 HEX 40-130 21 0.81 (CT)29 9 Brondani et al. (2001)
RM30 270 4.9 HEX 70-120 15 0.64 (AG)9A(GA)12 6 Panaud et al. (1996)
RM154 258 5.3 HEX 140-210 14 0.91 (GA)21 2 Akagi et al. (1996)
33
RM119 258 7.0 FAM 150-185 6 0.75 (GTC)6 4 Temnykh et al. (2000)
RM311 270 5.0 HEX 160-200 8 0.74 (GT)3(GTAT)8(GT)5 10 Temnykh et al. (2000)
34
RM53* 258 10.0 FAM 168-208 7 0.76 (GA)14 2 Chen et al. (1997)
RM12 129 2.1 FAM 150-190 7 0.41 (GA)21 12 Panaud et al. (1996)
35
RM19 258 11.0 HEX 200-270 11 0.72 (ATC)
10 12 Panaud et al. (1996)
Average - - - - 12.4 0.75 - -
-* Markers with presence of PCR artifacts (especially stutters)
**References
Akagi H, Yokozeki Y, Inagaki A, Fujimura T (1996) Microsatellite DNA markers for rice chromosomes. Theor Appl Genet 93: 1071-1077.
Brondani C, Brondani RPV, Rangel PHN, Ferreira ME (2001) Development and mapping of Oryza glumaepatula derived microsatellite markers in the interspecific cross O. glumaepatula x O. sativa. Hereditas 134: 59-71.
Chen X, Temnykh S, Xu Y, Cho YG, McCouch SR (1997) Development of a microsatellite framework map providing genome-wide coverage in rice (Oryza sativa L). Theor Appl Genet 95: 553-567
Panaud O, Chen X, McCouch SR (1996) Development of microsatellite markers and characterization of simple sequence length polymorphism (SSLP) in rice (Oryza sativa L.) Mol Gen Genet 252: 597-607
Rangel, PN. Construção de mapa de ligação e mapeamento de QTLs utilizando marcadores SSRs, ESTs e SNPs em cruzamento interespecífico Oryza glumaepatula X Oryza sativa. Thesis, Universidade Federal de Goiás, 111 pp.