AMTD
8, 3283–3319, 2015Extended and refined multi sensor reanalysis of total
ozone
R. J. van der A et al.
Title Page
Abstract Introduction
Conclusions References
Tables Figures
◭ ◮
◭ ◮
Back Close
Full Screen / Esc
Printer-friendly Version
Interactive Discussion
Discussion
P
a
per
|
Discussion
P
a
per
|
Discussion
P
a
per
|
Discussion
P
a
per
|
Atmos. Meas. Tech. Discuss., 8, 3283–3319, 2015 www.atmos-meas-tech-discuss.net/8/3283/2015/ doi:10.5194/amtd-8-3283-2015
© Author(s) 2015. CC Attribution 3.0 License.
This discussion paper is/has been under review for the journal Atmospheric Measurement Techniques (AMT). Please refer to the corresponding final paper in AMT if available.
Extended and refined multi sensor
reanalysis of total ozone for the period
1970–2012
R. J. van der A, M. A. F. Allaart, and H. J. Eskes
KNMI, P.O. Box 201, 3730 AE De Bilt, the Netherlands
Received: 23 January 2015 – Accepted: 10 March 2015 – Published: 24 March 2015
Correspondence to: R. J. van der A ([email protected])
AMTD
8, 3283–3319, 2015Extended and refined multi sensor reanalysis of total
ozone
R. J. van der A et al.
Title Page
Abstract Introduction
Conclusions References
Tables Figures
◭ ◮
◭ ◮
Back Close
Full Screen / Esc
Printer-friendly Version
Interactive Discussion
Discussion
P
a
per
|
Discussion
P
a
per
|
Discussion
P
a
per
|
Discussion
P
a
per
|
Abstract
The ozone multi-sensor reanalysis (MSR) is a multi-decadal ozone column data record constructed using all available ozone column satellite datasets, surface Brewer and Dobson observations and a data assimilation technique with detailed error modelling. The result is a high-resolution time series of 6 hourly global ozone column fields and
5
forecast error fields that may be used for ozone trend analyses as well as detailed case studies.
The ozone MSR is produced in two steps. First, the latest reprocessed versions of all available ozone column satellite datasets are collected, and are corrected for biases as function of solar zenith angle, viewing angle, time (trend), and stratospheric
10
temperature using Brewer/Dobson ground measurements from the World Ozone and Ultraviolet Radiation Data Centre (WOUDC; http://www.woudc.org/). Subsequently the debiased satellite observations are assimilated within the ozone chemistry and data assimilation model TMDAM driven by meteorological analyses of the European Centre for Medium-Range Weather Forecasts (ECMWF).
15
The MSR2 (MSR version 2) reanalysis upgrade described in this paper consists of an ozone record for the 43 year period 1970–2012. The chemistry-transport model and data assimilation system have been adapted to improve the resolution, error modelling and processing speed. BUV satellite observations have been included for the period 1970–1977. The total record is extended with 13 years compared to the first version
20
of the ozone multi sensor reanalysis, the MSR1. The latest total ozone retrievals of 15 satellite instruments are used: BUV-Nimbus4, TOMS-Nimbus7, TOMS-EP, SBUV-7, -9, -11, -14, -16, -17, -18, -19, GOME, SCIAMACHY, OMI and GOME-2. The reso-lution of the model runs, assimilation and output is increased from 2◦
×3◦ to 1◦×1◦. The analysis is driven by three-hourly meteorology from the ERA-interim reanalysis of
25
AMTD
8, 3283–3319, 2015Extended and refined multi sensor reanalysis of total
ozone
R. J. van der A et al.
Title Page
Abstract Introduction
Conclusions References
Tables Figures
◭ ◮
◭ ◮
Back Close
Full Screen / Esc
Printer-friendly Version
Interactive Discussion
Discussion
P
a
per
|
Discussion
P
a
per
|
Discussion
P
a
per
|
Discussion
P
a
per
|
comparisons with the individual station observations and with ozone sondes. The OmF statistics show that the mean bias of the MSR2 analyses is less than 1 % with respect to debiased satellite observations after 1979.
1 Introduction
Since the fifties total ozone columns are observed with a network of Dobson
instru-5
ments (e.g. Brönnimann et al., 2003). Later, the network became part of the Global Atmospheric Watch (GAW) program of WMO. From the early eighties Brewer instru-ments were added to this network. The performance of this network is discussed by Fioletov et al. (2008). Regular monitoring of the ozone layer with satellites started in 1970 with the BUV instrument on Nimbus-4 (Krueger et al., 1980) and continued from
10
1978 with SBUV and TOMS instruments on the satellite Nimbus-7. After the discovery of the Antarctic ozone hole in 1985 (Farman et al., 1985), ozone layer monitoring was intensified and new satellite missions were planned. Since then, trend studies of ozone based on satellite observations have been published by many authors (e.g. Stolarski et al., 1991; Fioletov et al., 2002; Weber et al., 2014; WMO, 2014). For the
recon-15
struction of stratospheric ozone, data assimilation has become an important tool. An example is the ECMWF ERA-40 re-analysis of total ozone (Dethof and Hólm, 2004). More recently, an atmospheric composition time series covering the ten year period from 2003 to 2012 became available as part of the FP7-funded Monitoring Atmospheric Composition and Climate (MACC) project (Inness et al., 2013), based on the
assimila-20
tion of satellite measurements.
Long consistent data sets of observed ozone are important for ozone protocol mon-itoring (WMO, 2014), climate studies (IPCC report, 2013; Weber et al., 2014), trend analyses (e.g. Stolarski et al., 1991, 2006; Fioletov et al., 2002; Brunner et al., 2006; WMO, 2007; Mäder et al., 2007; Harris et al., 2008) and UV radiation calculations
25
AMTD
8, 3283–3319, 2015Extended and refined multi sensor reanalysis of total
ozone
R. J. van der A et al.
Title Page
Abstract Introduction
Conclusions References
Tables Figures
◭ ◮
◭ ◮
Back Close
Full Screen / Esc
Printer-friendly Version
Interactive Discussion
Discussion
P
a
per
|
Discussion
P
a
per
|
Discussion
P
a
per
|
Discussion
P
a
per
|
recovery (e.g. Reinsel et al., 2005) as a result of the actions to reduce ozone-depleting substances as regulated by the Montreal Protocol and its amendments. Signs of recov-ery of the ozone layer have been reported in the latest WMO scientific assessment of ozone depletion (WMO, 2014). Such applications of accurate long time series of ozone have motivated the development of the ozone multi-sensor reanalysis (MSR1, van der
5
A et al., 2010). Recent applications of the MSR1 are in research of ozone trends (e.g. Antón et al., 2011; Kuttippurath et al., 2013; Knibbe et al., 2014), climate (e.g. van Noije et al., 2014) and UV (e.g. den Outer, 2012) and is used in the latest assessment (WMO, 2014). De Laat et al. (2014) have used the MSR1 in a multivariate regression to study the recovery of the Antarctic ozone hole. The MSR1 has also been used to
10
provide stratospheric ozone boundary conditions to tropospheric chemistry transport models (e.g. Huijnen et al., 2010). Apart from long-term climate records, the multi-sensor reanalysis offers detailed synoptic ozone maps, available every six hours with detailed error estimates. This rich source of information can be used to study local time series and events, such as the unique September 2002 warming event splitting up the
15
Antarctic ozone hole (Eskes et al., 2005).
Since the MSR1 became available, five years have passed, and new reprocessed satellite data has become available. Therefore we have extended our Multi Sensor Re-analysis (van der A et al., 2010) based on satellite observations to a period covering 43 years. The new ozone Multi Sensor Reanalysis version 2 (MSR2), described in this
20
paper, covers the period 1970–2012 by including BUV observations for the first 8 years and recent observations for the years from 2009 to 2012. Total ozone datasets from the satellite instruments BUV (on the satellite Nimbus-4), TOMS (Nimbus-7 and Earth Probe), SBUV (Nimbus-7, NOAA-9, 11, 14, 16, 17, 18, and 19), GOME (ERS-2), SCIA-MACHY (Envisat), OMI (EOS-Aura), and GOME-2 (Metop-A) have been used in the
25
MSR2. Most retrieval algorithms of those ozone datasets have recently been improved and the data upgraded to a newer data release.
In the new MSR2 several improvements have been made to the methodology. In particular the spatial gridding of the results has been increased from 2◦
AMTD
8, 3283–3319, 2015Extended and refined multi sensor reanalysis of total
ozone
R. J. van der A et al.
Title Page
Abstract Introduction
Conclusions References
Tables Figures
◭ ◮
◭ ◮
Back Close
Full Screen / Esc
Printer-friendly Version
Interactive Discussion
Discussion
P
a
per
|
Discussion
P
a
per
|
Discussion
P
a
per
|
Discussion
P
a
per
|
and the time period has been extended. As explained in detail in van der A et al. (2010) the MSR is constructed in two steps. In the first step all available satellite data are collected and corrected by a multiple regression fit with selected ground observations of ozone. Parameters in this fit are time, the solar zenith angle, the viewing angle and the effective ozone temperature. In the second step the corrected satellite data are 5
assimilated into a global chemistry transport model. The assimilated ozone fields are the resulting multi sensor reanalysis of ozone.
In the next sections we will describe the current methodology of correcting the satel-lite observations, the improvements made to the data assimilation, and an evaluation and discussion of the results.
10
2 Correcting the total ozone observations
2.1 Satellite data of ozone
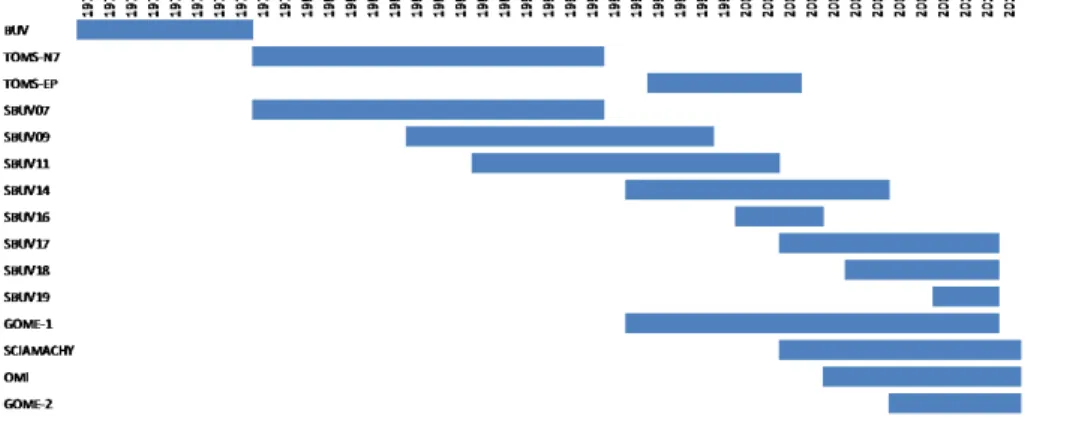
Figure 1 shows the timelines of all satellite instruments used to generate the MSR2 reanalysis, which reveals gaps and overlaps between these records. To extend the dataset into the seventies, the observations from the BUV instrument on Nimbus-4
15
(Krueger et al., 1980; Stolarski et al., 1997) have been added. They are reprocessed with the new version 8.6 algorithm (Bhartia et al., 2013). Since 1978 significantly more ozone observations became available with the TOMS and SBUV instruments on the satellite Nimbus-7 (Bhartia et al., 2002; Miller et al., 2002). These observations were continued with TOMS instruments on the satellites Meteor 3, ADEOS and Earth Probe
20
until the year 2003, when the measurements started to be seriously affected by in-strument degradation. This time series of TOMS was interrupted from May 1993 until July 1996. This gap was filled by continuous SBUV observations on various NOAA satellite missions. The gap was also partly filled since July 1995 with GOME obser-vations aboard ERS-2 (Burrows et al., 1999), the first European satellite measuring
25
AMTD
8, 3283–3319, 2015Extended and refined multi sensor reanalysis of total
ozone
R. J. van der A et al.
Title Page
Abstract Introduction
Conclusions References
Tables Figures
◭ ◮
◭ ◮
Back Close
Full Screen / Esc
Printer-friendly Version
Interactive Discussion
Discussion
P
a
per
|
Discussion
P
a
per
|
Discussion
P
a
per
|
Discussion
P
a
per
|
an instrumental problem in 2003, the GOME instrument was measuring until 2011 with reduced coverage. GOME was followed up by the European satellite instruments SCIAMACHY (Bovensmann et al., 1999) launched in 2002 on the Envisat platform of European Space Agency (ESA), and OMI (Levelt et al., 2006), a Dutch-Finnish instru-ment on the EOS-AURA platform of National Aeronautics and Space Administration
5
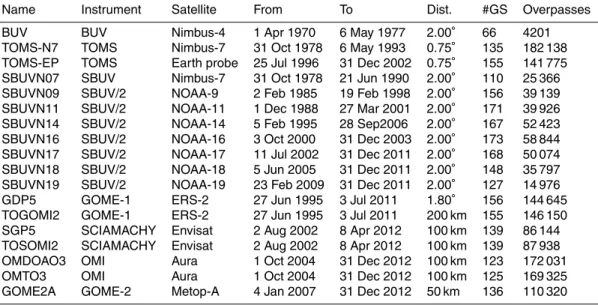
(NASA), launched in 2004. The UV-VIS spectrometer GOME-2 (Callies et al., 2000) was launched in 2006 on the first of a series of three operational EUMETSAT Metop missions, which allows continuous monitoring of the ozone layer until 2020. The com-plete collection of data sets used in the MSR2 is listed in Table 1.
Almost all existing level 2 total ozone datasets from satellite have been used. Level
10
2 data is defined as the geo-located satellite retrieval results, while level 4 is defined as the assimilated satellite data provided as a gridded field. Data from the TOMS in-struments on board the Meteor3 and ADEOS satellites and data from the FY-3 satel-lite were only available as gridded (level 3) data: unfortunately this is not suitable for data assimilation. Data from OMPS on the Suomi-NPP platform and from GOME-2
15
on METOP-B were not used because these time series are yet too short for deriving corrections.
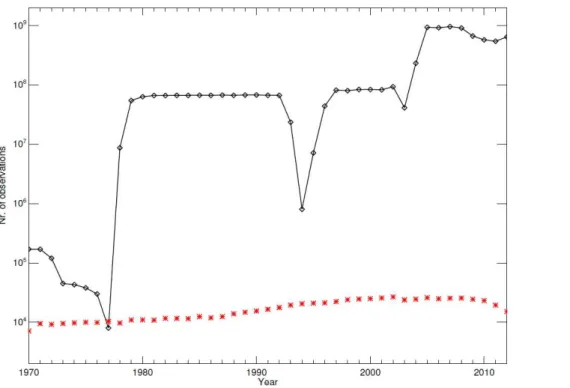
In Fig. 2 we show how the number of annual satellite observations is growing with several orders of magnitude throughout the years. In the seventies the number of obser-vations is still sparse with several big gaps in time without data. The longest time period
20
without data is from May 1977 till October 1978, which explains the dip in 1977 in Fig. 2. Another shorter period without observations exists from June to September 1976. The dip around 1994 corresponds to the end of a long period of TOMS observations on Nimbus 7, two years later followed by the start of the observations of GOME-1. In 2003 we see the reduction of GOME-1 measurements due to a malfunctioning tape-drive on
25
AMTD
8, 3283–3319, 2015Extended and refined multi sensor reanalysis of total
ozone
R. J. van der A et al.
Title Page
Abstract Introduction
Conclusions References
Tables Figures
◭ ◮
◭ ◮
Back Close
Full Screen / Esc
Printer-friendly Version
Interactive Discussion
Discussion
P
a
per
|
Discussion
P
a
per
|
Discussion
P
a
per
|
Discussion
P
a
per
|
used for the MSR2. There are lower numbers in ground observations for 1970, be-cause the MSR2 starts in April 1970, and at the end of the time series, bebe-cause not all observations were yet submitted to the database.
2.2 Ground based data
Complementary to space observations are routine ozone column observations made
5
at surface sites by Brewer, Dobson, and Filter instruments (e.g. Fioletov et al., 2008). Apart from their direct use in ozone monitoring (e.g. Staehelin et al., 2001), these observations have been a crucial source of information to test or validate satellite re-trievals. Extensive research in the performance of this network has been published by Fioletov et al. (2008). The WOUDC collects these ground-based observations, and
10
makes them available for research. Only Brewer and Dobson measurements have been used for the MSR2. A temperature correction based on Kerr (2002) of the total ozone amount has been applied to all Dobson total ozone data.
The daily average total ozone observations for each station, in the period 1970– 2012, have been extracted. The time resolved observations have not been used, as
15
these are available only for a limited number of stations, thus only DirectSun data have been used in this study. A “blacklist” has been created that indicates for each year and for each ground station if the data is suspect. Suspect data have been identified by comparison with various satellite datasets. If sudden jumps, strong trends or very large offsets are found, the station is blacklisted. This subjective blacklist is quite similar 20
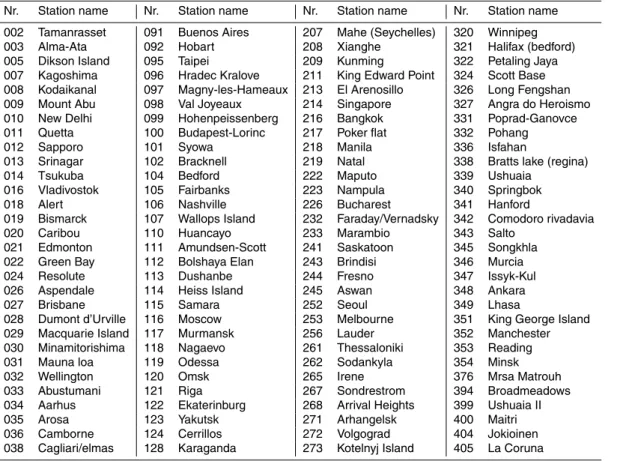
to the one used by Bodeker et al. (2001). In total 5 % of the ground data have been blacklisted. The ground stations used in this study can be found in the Appendix.
2.3 Corrections for the satellite datasets
For long-term accuracy and consistency it is crucial to reduce offsets, trends and long-term variations in the satellite data, so that the data can be used as input to the
assimi-25
AMTD
8, 3283–3319, 2015Extended and refined multi sensor reanalysis of total
ozone
R. J. van der A et al.
Title Page
Abstract Introduction
Conclusions References
Tables Figures
◭ ◮
◭ ◮
Back Close
Full Screen / Esc
Printer-friendly Version
Interactive Discussion
Discussion
P
a
per
|
Discussion
P
a
per
|
Discussion
P
a
per
|
Discussion
P
a
per
|
fitted to correct for the ozone differences (satellite minus ground observation) are the Solar Zenith Angle (SZA), the Viewing Zenith Angle (VZA), the effective temperature of stratospheric ozone, time and an offset (with reference year 2000). New compared to the MSR1 correction is the inclusion of a 2nd order SZA correction, since most satellite data sets show a non-linear SZA dependence for low solar elevation angles. A
ba-5
sic assumption is that all corrections are additive to the total ozone amount. By fitting all data together, regional biases that may be caused by offsets of individual ground instruments are avoided. For each satellite product an “overpass” dataset has been created for all ground stations and a maximum allowed distance between the centre of the ground pixel and the ground station was defined (see column “Dist.” in Table 1).
10
This number is typically 50–200 km depending on the ground pixel size. These over-pass datasets are fitted to the ground data for the 5 free parameters. The regression coefficients for these parameters and for all satellite datasets are listed in Table 2. The number of overpasses actually used in the regression is shown in the last column of Table 1.
15
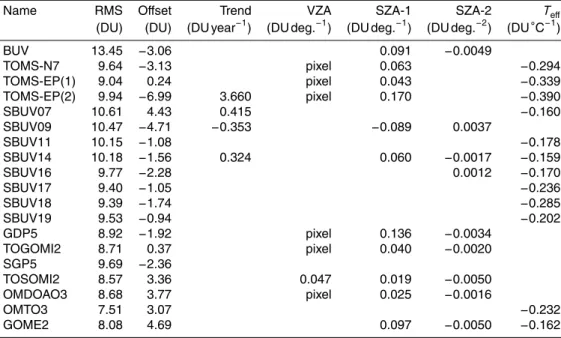
The relevant regression coefficients, i.e. those that reduce the RMS (Root Mean Square) between satellite and ground observations significantly, have been calculated and are shown in Table 3. The TOMS-EP dataset has been corrected for a trend for the last two years only, so this dataset has been divided in two. The datasets that show a non-linear dependence on VZA have been corrected on a “per pixel” basis. Note that
20
the (S)BUV instruments perform only nadir measurements and the VZA dependence is therefore absent.
Based on the calculated corrections the merged MSR level 2 dataset has been cre-ated. The original satellite datasets were read, filtered for bad data, corrected accord-ing to the corrections listed in Table 3, and finally merged into a saccord-ingle time ordered
25
AMTD
8, 3283–3319, 2015Extended and refined multi sensor reanalysis of total
ozone
R. J. van der A et al.
Title Page
Abstract Introduction
Conclusions References
Tables Figures
◭ ◮
◭ ◮
Back Close
Full Screen / Esc
Printer-friendly Version
Interactive Discussion
Discussion
P
a
per
|
Discussion
P
a
per
|
Discussion
P
a
per
|
Discussion
P
a
per
|
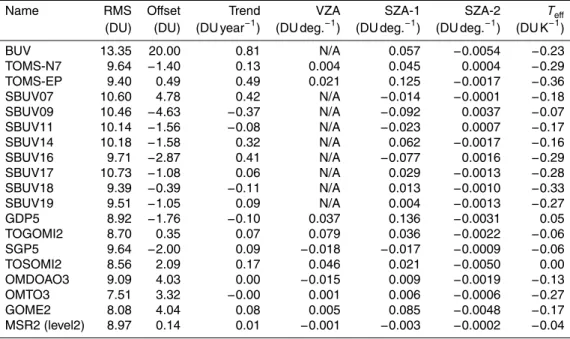
the trend, offset, and seasonal cycle in the satellite observations have been reduced to a negligible level as shown in the last line of Table 2.
3 Ozone model and data assimilation
The chemistry-transport model used is a simplified version of TM5 (Krol et al., 2005; Huijnen et al., 2010), which is driven by ECMWF analyses of wind, pressure and
tem-5
perature fields. The model is using only one tracer for ozone and a parameterization for the chemical modelling. The assimilation approach is an extension of the work de-scribed in Eskes et al. (2003). As input the assimilation uses ozone column values and estimates of the measurement uncertainty. The ozone model setup and data as-similation scheme in TMDAM have been described in van der A et al. (2010), and we
10
refer to this paper for more details. For the MSR2 several improvements have been implemented, which are described below.
The model resolution of TMDAM and its output are upgraded from 2◦
×3◦ to 1◦×1◦. The model is driven by 3 hourly meteorological fields extracted at 1◦
×1◦ from ERA-interim (Dee et al., 2011) reanalysis of ECMWF, available for the period 1979–2012.
15
Assimilation in MSR1 was based on ERA-40 and operational ECMWF data (from 2002 onwards) at a 6 hourly resolution. ERA-interim provides an improved representation of the meteorology and is one consistent dataset for the entire period after 1979. For the period before 1979 ERA-interim is not available, and the ERA-40 reanalysis on 2◦
×3◦ resolution is used. The data assimilation for this period is also performed on
20
a 2◦
×3◦ grid. The 60 ECMWF hybrid layers between 0.01 hPa and the surface have been converted into 44 layers used in TMDAM, whereby in the stratosphere and upper troposphere all levels are identical to the ECMWF levels. The ozone column output of the TMDAM analyses is stored with a resolution of 1/2◦
×1/2◦, using the subgrid gra-dient information from the second-order moments advection scheme (Prather, 1986).
25
AMTD
8, 3283–3319, 2015Extended and refined multi sensor reanalysis of total
ozone
R. J. van der A et al.
Title Page
Abstract Introduction
Conclusions References
Tables Figures
◭ ◮
◭ ◮
Back Close
Full Screen / Esc
Printer-friendly Version
Interactive Discussion
Discussion
P
a
per
|
Discussion
P
a
per
|
Discussion
P
a
per
|
Discussion
P
a
per
|
to version 2.9 in MSR2. The error correlation between individual measurements of different instruments or algorithms is set to zero, while the correlation between mea-surements of the same instrument is assumed to be 50 % following Eskes et al. (2003). The processing speed of the analysis step has been improved by a factor of 20–60 due to several optimizations in the code.
5
The quality control consists of a comparison between the individual observations and the model forecast, or OmF. When the OmF exceeded 3 times the square root of the forecast variance plus the observation variance, the observation is rejected. Only a few percent of all observations are rejected with this quality check.
The 6 hourly instantaneous and monthly mean ozone fields of the MSR2 are
avail-10
able on the TEMIS web site, http://www.temis.nl/. For UV radiation studies the daily ozone fields at local noon are also made available on this web site.
4 Data assimilation results and error analysis
4.1 Time series of the MSR2
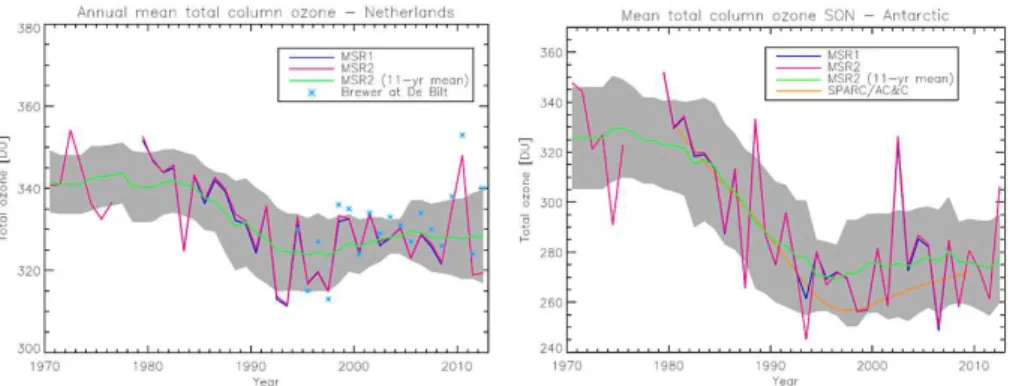
Figure 3 shows the annual mean total ozone over De Bilt (left) and the 3-monthly
15
(September–November) mean ozone column below 60◦S (right). The period covered
by the MSR2 shows the beginning of the ozone hole in the eighties when CFCs were increasing in the stratosphere and the more or less stable period afterwards when the Montreal protocol was implemented and CFCs started their slow decline. For reference the 11 year running mean of ozone is plotted (green line). The annual mean Brewer
20
total ozone for De Bilt that started in 1996 has been added. In the right plot a large difference between MSR1 and MSR2 is visible for the year 1993, when only data from SBUV is available. In the MSR2 data the error criteria are slightly stricter resulting in more missing data for September 1993. This leads to an underestimation of the three monthly average in that year.
AMTD
8, 3283–3319, 2015Extended and refined multi sensor reanalysis of total
ozone
R. J. van der A et al.
Title Page
Abstract Introduction
Conclusions References
Tables Figures
◭ ◮
◭ ◮
Back Close
Full Screen / Esc
Printer-friendly Version
Interactive Discussion
Discussion
P
a
per
|
Discussion
P
a
per
|
Discussion
P
a
per
|
Discussion
P
a
per
|
4.2 Error analysis
The total ozone data are assimilated by applying a parameterized Kalman filter tech-nique. In this approach the forecast error covariance matrix is written as a product of a time independent correlation matrix and a time-dependent diagonal variance. The various parameters in this approach are fixed and are based on the observation minus
5
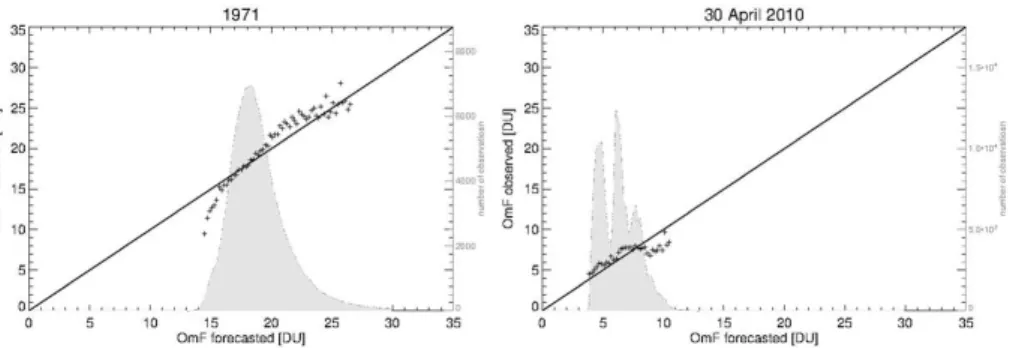
forecast (OmF) statistics accumulated over the period of one year (2000) using GOME observations. This method produces detailed and realistic time- and space-dependent forecast error distributions. To check if these parameters are still valid for the MSR2 in other years, we have compared the observed OmF (by comparing the forecast with individual observations) with the estimate of the OmF. The latter is calculated from the
10
combination of the model forecast error as computed in TMDAM and the given indi-vidual measurement error bars on the observations. This approach can be seen as an extension of the much used χ2 test, which checks basically if the mean of both quantities are consistent. In Fig. 4 we show this comparison for two extreme cases in the MSR2 time series, the first for the complete year 1971 (see Fig. 4a) when only
15
the sparse BUV observations were available, and the second for 30 April 2010 (see Fig. 4b) when there is a very high density of observations from a wide range of satellite instruments. The grey area shows the number of observations with that specific fore-casted OmF. The black line indicates the perfect situation where the observed OmF in the bin would be equal to the forecasted OmF. As one can see from the Figures,
20
in both cases the OmF values are remarkably comparable, especially in the grey area corresponding to the bulk of observations. Based on these results we decided that no changes were needed for the model error parameters in the Kalman Filter as compared to MSR1. The OmF is much smaller for the more modern satellite instruments in 2010, mainly because of the higher number of observations per model grid cell and the daily
25
revisit cycle.
AMTD
8, 3283–3319, 2015Extended and refined multi sensor reanalysis of total
ozone
R. J. van der A et al.
Title Page
Abstract Introduction
Conclusions References
Tables Figures
◭ ◮
◭ ◮
Back Close
Full Screen / Esc
Printer-friendly Version
Interactive Discussion
Discussion
P
a
per
|
Discussion
P
a
per
|
Discussion
P
a
per
|
Discussion
P
a
per
|
as prescribed by the analysis equation of the Kalman filter which leads to a reduction of the error of the model distribution close to the observations. Between successive measurements the error variance is growing due to the model error, and the variance field is advected in the same way as ozone itself (van der A et al., 2010). Those three aspects of the time dependence of the error field can be recognized in Fig. 5. Since
5
the number of observations is much higher in 2006 (and available for more locations) the error is in general much lower. Since no observations over the Antarctic exist in summertime (right figure), the error is much higher, although it is partly reduced by advection of ozone into this region.
4.3 OmF statistics
10
To evaluate the performance of the MSR2 we routinely produce observation-minus-forecast (OmF) and observation-minus-analysis (OmA) statistics. These statistics pro-vide an internal consistency check on the error estimates for the total ozone retrieval as well as for the model performance. In the data assimilation the forecasts are calcu-lated in sequential steps of half an hour. For the assimilation of observations of a single
15
sensor with full daily coverage, the observations at a certain location are typically avail-able once a day and therefore the OmF statistics result from an unconstrained model forecast time step of roughly 1 day. Smaller time steps occur near the poles. For the assimilation of SBUV observations only the revisit time is typically 1 week, given that the assimilation has a spatial correlation length of 500 km. For the assimilation of data
20
from multiple sensors this is different, and time steps between observations vary from half an hour to one day. In this case the OmF, OmA and ozone assimilation results are more restrained by the observations. Typical OmF and OmA behaviour that has been checked are: (i) in general the OmA has to be smaller than the OmF, (ii) no significant geo-location or geo-parameter dependencies should be visible.
25
AMTD
8, 3283–3319, 2015Extended and refined multi sensor reanalysis of total
ozone
R. J. van der A et al.
Title Page
Abstract Introduction
Conclusions References
Tables Figures
◭ ◮
◭ ◮
Back Close
Full Screen / Esc
Printer-friendly Version
Interactive Discussion
Discussion
P
a
per
|
Discussion
P
a
per
|
Discussion
P
a
per
|
Discussion
P
a
per
|
effects found for these parameters are all much smaller than the typical RMS. On aver-age the RMS difference between new satellite observations and the short-range model forecast (1 day) is small: about 6 DU, or roughly 2 % for this month. The rms error of the OmF is smaller than the observational error compared to ground observations, be-cause representative errors of the satellite observations compared to level 4 data are
5
likely to be smaller than for satellite observations compared to ground observations. For high solar zenith angles the RMS value increases, because these measurements are usually associated with the highly variable ozone concentrations in and around the polar vortex. Plots similar to Fig. 6 show that the bias between the forecast and the satellite columns is generally smaller than 1 % after 1979. The bias between analyses
10
and observations is in general even smaller (less than 1 DU), which shows the effect of data assimilation. Compared to the MSR1 results (van der A et al., 2010), the bias has been slightly decreased probably as a result of the higher spatial resolution for the MSR2 and the improved data assimilation.
Figure 7 is similar to Fig. 6 but here the statistics are for the year 1971, when only
15
BUV observations were available. In this period the time between observations of the same air mass is generally much longer than 24 h. There is no plot as function of view-ing angle since BUV was observview-ing under a fixed angle in nadir direction. The mean OmF and OmA values are in general still small (less than 5 %), but the RMS values are higher than after 1979 reaching up to 10 %. A region in the Southern Hemisphere
20
shows a high forecast error, especially visible in the plot as function of latitude. This is because all BUV data in and around the South Atlantic Anomaly has not been made available and therefore the forecasts involve longer time steps. The structures seen in the latitude dependence in Fig. 7 reflect the ozone model errors (drifts), which may be related to issues with the ERA-40 meteorology mainly in the tropics (Uppala et al.,
25
2005) and the removal of BUV data in the South Atlantic Anomaly region.
AMTD
8, 3283–3319, 2015Extended and refined multi sensor reanalysis of total
ozone
R. J. van der A et al.
Title Page
Abstract Introduction
Conclusions References
Tables Figures
◭ ◮
◭ ◮
Back Close
Full Screen / Esc
Printer-friendly Version
Interactive Discussion
Discussion
P
a
per
|
Discussion
P
a
per
|
Discussion
P
a
per
|
Discussion
P
a
per
|
night where observations are lacking. No obvious patterns as function of ground eleva-tion or surface type are visible. Compared to the OmF of the MSR1 data set (see inset) the deviations have become somewhat smaller.
4.4 Validation with ground observations
The corrections for the satellite retrieval data sets have been derived from comparisons
5
with all stations simultaneously and is not latitude or station dependent. This implies that the individual ground observations can still be used for the evaluation of the final MSR2 ozone record. The geographical distribution of the offset between MSR2 data and individual ground stations is shown in Fig. 9. On average the offset is small, and only a few outlier stations are visible, often close to a station with a very small offset 10
which suggests that the offset is station related. No systematic structures are obvious in the geographical distribution.
Another important aspect of the performance of the data assimilation is the verti-cal distribution of ozone in the model. Although the data assimilation is analysing total columns, the model describes the vertical distribution of ozone and an update of the
15
total ozone is distributed over the vertical profile by scaling the modelled profile to have the same total ozone. If this profile shape deteriorates, this will also affect the quality of the analysed ozone columns. We have checked the ozone distribution in different years by comparing with ozone sondes from the WOUDC archive. No significant drift in the ozone profile shape was visible over a time period of 10 years of assimilating ozone
20
columns. As can be seen in Fig. 10 the bias between ozone sondes and the model ozone profiles is less than 10–20 %, which is satisfactory, given that the ozone profile is not constrained by observations. These relatively small profile biases will not signif-icantly impact the ozone column analysis, as demonstrated by the good performance of the assimilation system.
AMTD
8, 3283–3319, 2015Extended and refined multi sensor reanalysis of total
ozone
R. J. van der A et al.
Title Page
Abstract Introduction
Conclusions References
Tables Figures
◭ ◮
◭ ◮
Back Close
Full Screen / Esc
Printer-friendly Version
Interactive Discussion
Discussion
P
a
per
|
Discussion
P
a
per
|
Discussion
P
a
per
|
Discussion
P
a
per
|
5 Concluding remarks
The Ozone Multi-Sensor Reanalysis version 2 (MSR2) provides a 43 year long-term (climate) data record of high-resolution global distributions of total ozone with a 6 hourly sampling. Detailed time and space dependent forecast error fields are provided to-gether with the ozone fields. The data is created in two steps: first, small systematic
5
biases in the satellite data are corrected by using average Brewer and Dobson ground observation as a reference. Secondly, all satellite data are assimilated with a Kalman filter technique in order to create a consistent data record with a regular spatial grid of 1◦
×1◦. The data set is based on the observations of 15 different satellite instruments with nadir observations in the UV.
10
For the new MSR2 data set improvements are made to the calculation of correlations between the observations and the Cariolle parameterisation for chemistry modelling has been upgraded. The calculation speed has been optimised to be able to perform the data assimilation on the increased resolution of 1◦
×1◦.
The parameterized estimated error on the ozone column computed in the data
as-15
similation has been shown to be accurate for all time periods, even when observational data are sparse. It was shown that the Kalman filter predicted OmF SD, based on the measurement errors and the estimated model forecast errors, is generally close to the mean SD of the observed OmF departures. As internal consistency check, the MSR2 level 2 and level 4 data have been compared to ground observations with satisfying
20
results.
To evaluate the quality of the MSR2 data, the OmF and OmA statistics have been analysed. The OmA of this dataset is less than 1 %, which is better than for the assim-ilation of observations of a single sensor and is improved as compared to the MSR1. The model bias as estimated by the difference between OmF and OmA is in general 25
AMTD
8, 3283–3319, 2015Extended and refined multi sensor reanalysis of total
ozone
R. J. van der A et al.
Title Page
Abstract Introduction
Conclusions References
Tables Figures
◭ ◮
◭ ◮
Back Close
Full Screen / Esc
Printer-friendly Version
Interactive Discussion
Discussion
P
a
per
|
Discussion
P
a
per
|
Discussion
P
a
per
|
Discussion
P
a
per
|
errors are around 2–3 % between 1979 and 2012, which is small given that the RMS errors contain contributions from the representativity errors, forecast errors and instru-mental noise. For very long time periods without any data (e.g. in 1977), longer than several months, the error becomes more than 20 %. These cases may be efficiently excluded from the dataset by filtering with the forecast error estimate provided in the
5
ozone data product, which correctly indicates large model forecast errors during these periods.
It has been shown that the MSR2 level 2 data show an insignificant drift and SZA and effective ozone temperature dependence as compared to the ground observations (see Table 2). The fitted offset, trend and seasonality in the comparison between the 10
MSR2 level 4 ozone fields and the average of the ground observations were negligible. The maximum fitted offset is 0.2 DU. All systematic effects found in the satellite data are removed by the simple corrections (using a few basic parameters) applied to the satellite observations in the period 1970–2012.
The availability of reprocessed BUV total ozone measurements made it possible to
15
extend our data series into the seventies. Unfortunately, the BUV observations are not available for the complete period of 1970–1978 and a large part of the data on the Southern Hemisphere has been filtered because of interference from the South At-lantic Anomaly (SAA). This means that part of the MSR2 data in the seventies strongly depend on the model performance. To improve upon this, the Dobson ground
mea-20
surements may be assimilated together with the BUV satellite observations during the seventies. This combined assimilation is very likely to improve the analysed ozone distributions significantly, especially in the SAA region and in the periods without any satellite data (summer 1976 and 1977). For a future extension of the MSR2 we expect to have many satellite observations available, especially from the planned operations of
25
GOME-2 on METOP-C and -D, from OMPS and from the European Sentinel missions.
AMTD
8, 3283–3319, 2015Extended and refined multi sensor reanalysis of total
ozone
R. J. van der A et al.
Title Page
Abstract Introduction
Conclusions References
Tables Figures
◭ ◮
◭ ◮
Back Close
Full Screen / Esc
Printer-friendly Version
Interactive Discussion
Discussion
P
a
per
|
Discussion
P
a
per
|
Discussion
P
a
per
|
Discussion
P
a
per
|
the agencies NASA, NOAA, ESA, and EUMETSAT for making, respectively, TOMS and OMI, SBUV, GOME and SCIAMACHY, and GOME-2 data publically available at their web sites.
References
Antón, M., Kroon, M., López, M., Vilaplana, J. M., Bañón, M., van der A, R., Veefkind, J. P., Stammes, P., and Alados-Arboledas, L.: Total ozone column derived from GOME and SCIA-5
MACHY using KNMI retrieval algorithms: validation against Brewer measurements at the Iberian Peninsula, J. Geophys. Res., 116, D22303, doi:10.1029/2011JD016436, 2011. Bhartia, P. K. and Wellemeyer, C.: TOMS-V8 total O3algorithm, in: OMI Algorithm Theoretical
Basis Document, vol. II, OMI Ozone Products, ATBD-OMI-02, edited by: Bhartia, P. K., NASA Goddard Space Flight Cent., Greenbelt, Md, 15–31, 2002.
10
Bhartia, P. K., McPeters, R. D., Flynn, L. E., Taylor, S., Kramarova, N. A., Frith, S., Fisher, B., and DeLand, M.: Solar Backscatter UV (SBUV) total ozone and profile algorithm, Atmos. Meas. Tech., 6, 2533–2548, doi:10.5194/amt-6-2533-2013, 2013.
Bodeker, G. E., Scott, J. C., Kreher, K., and McKenzie, R. L.: Global ozone trends in potential vorticity coordinates using TOMS and GOME intercompared against the Dobson network: 15
1978–1998, J. Geophys. Res., 106, 23029–23042, 2001.
Bovensmann, H., Burrows, J. P., Buchwitz, M., Frerick, J., Noël, S., Rozanov, V. V., Chance, K. V., and Goede, A. P. H.: SCIAMACHY: mission objectives and measurement modes, J. Atmos. Sci., 56, 127–150, 1999.
Brönnimann, S., Staehelin, J., Farmer, S. F. G., Cain, J. C., Svendby, T., and Svenøe, T.: Total 20
ozone observations prior to the IGY, I: a history, Q. J. Roy. Meteor. Soc., 129, 2797–2817, doi:10.1256/qj.02.118, 2003.
Brunner, D., Staehelin, J., Künsch, H.-R., and Bodeker, G. E.: A Kalman filter reconstruc-tion of the vertical ozone distribureconstruc-tion in an equivalent latitude-potential temperature frame-work from TOMS/GOME/SBUV total ozone observations, J. Geophys. Res., 111, D12308, 25
doi:10.1029/2005JD006279, 2006.
Burrows, J. P., Weber, M., Buchwitz, M., Rozanov, V., Ladstätter-Weißenmayer, A., Richter, A., De Beek, R., Hoogen, R., Bramstedt, K., Eichmann, K. U., Eisinger, M., and Perner, D.: The Global Ozone Monitoring Experiment (GOME): mission concept and first scientific results, J. Atmos. Sci., 56, 151–175, 1999.
AMTD
8, 3283–3319, 2015Extended and refined multi sensor reanalysis of total
ozone
R. J. van der A et al.
Title Page
Abstract Introduction
Conclusions References
Tables Figures
◭ ◮
◭ ◮
Back Close
Full Screen / Esc
Printer-friendly Version
Interactive Discussion
Discussion
P
a
per
|
Discussion
P
a
per
|
Discussion
P
a
per
|
Discussion
P
a
per
|
Callies, J., Corpaccioli, E., Eisinger, M., Hahne, A., Lefebvre, A.: GOME-2 – Metop’s sec-ond generation sensor for operational ozone monitoring, ESA Bull.-Eur. Space, 102, 28–36, 2000.
Cariolle, D. and Teyssèdre, H.: A revised linear ozone photochemistry parameterization for use in transport and general circulation models: multi-annual simulations, Atmos. Chem. Phys., 5
7, 2183–2196, doi:10.5194/acp-7-2183-2007, 2007.
Cionni, I., Eyring, V., Lamarque, J. F., Randel, W. J., Stevenson, D. S., Wu, F., Bodeker, G. E., Shepherd, T. G., Shindell, D. T., and Waugh, D. W.: Ozone database in support of CMIP5 simulations: results and corresponding radiative forcing, Atmos. Chem. Phys., 11, 11267– 11292, doi:10.5194/acp-11-11267-2011, 2011. .
10
Dee, D. P., Uppala, S. M., Simmons, A. J., Berrisford, P., Poli, P., Kobayashi, S., Andrae, U., Balmaseda, M. A., Balsamo, G., Bauer, P., Bechtold, P., Beljaars, A. C. M., van de Berg, L., Bidlot, J., Bormann, N., Delsol, C., Dragani, R., Fuentes, M., Geer, A. J., Haimberger, L., Healy, S. B., Hersbach, H., Hólm, E. V., Isaksen, L., Kållberg, P., Köhler, M., Matricardi, M., McNally, A. P., Monge-Sanz, B. M., Morcrette, J.-J., Park, B.-K., Peubey, C., de Rosnay, P., 15
Tavolato, C., Thépaut, J.-N., and Vitart, F.: The ERA-Interim reanalysis: configuration and performance of the data assimilation system, Q. J. Roy. Meteor. Soc., 137, 553–597, doi:10.1002/qj.828, 2011.
de Laat, A. T. J., van der A, R. J., and van Weele, M.: Tracing the second stage of ozone recovery in the Antarctic ozone-hole with a “big data” approach to multivariate regressions, 20
Atmos. Chem. Phys., 15, 79–97, doi:10.5194/acp-15-79-2015, 2015.
den Outer, P. N., van Dijk, A., Slaper, H., Lindfors, A. V., De Backer, H., Bais, A. F., Feister, U., Koskela, T., and Josefsson, W.: Applying spaceborne reflectivity measurements for calcu-lation of the solar ultraviolet radiation at ground level, Atmos. Meas. Tech., 5, 3041–3054, doi:10.5194/amt-5-3041-2012, 2012.
25
Dethof, A. and Hólm, E. V.: Ozone assimilation in the ERA-40 reanalysis project, Q. J. Roy. Meteor. Soc., 130, 2851–2872, doi:10.1256/qj.03.196, 2004.
Eskes, H. J., van Velthoven, P. F. J., Valks, P. J. M., and Kelder, H. M.: Assimilation of GOME total ozone satellite observations in a three-dimensional tracer transport model, Q. J. Roy. Meteor. Soc., 129, 1663–1681, 2003.
30
AMTD
8, 3283–3319, 2015Extended and refined multi sensor reanalysis of total
ozone
R. J. van der A et al.
Title Page
Abstract Introduction
Conclusions References
Tables Figures
◭ ◮
◭ ◮
Back Close
Full Screen / Esc
Printer-friendly Version
Interactive Discussion
Discussion
P
a
per
|
Discussion
P
a
per
|
Discussion
P
a
per
|
Discussion
P
a
per
|
Farman, J. C., Gardiner, B. G., and Shanklin, J. D.: Large losses of total ozone in Antarctica reveal seasonal ClOx/NOxinteraction, Nature, 315, 207, doi:10.1038/315207a0, 1985.
Fioletov, V. E., Bodeker, G. E., Miller, A. J., McPeters, R. D., and Stolarski, R. S.: Global and zonal total ozone variations estimated from ground-based and satellite measurements: 1964–2000, J. Geophys. Res., 107, 4647, doi:10.1029/2001JD001350, 2002.
5
Fioletov, V. E., Labow, G., Evans, R., Hare, E. W., Köhler, U., McElroy, C. T., Miyagawa, K., Re-dondas, A., Savastiouk, V., Shalamyansky, A. M., Staehelin, J., Vanicek, K., and Weber, M.: Performance of the ground-based total ozone network assessed using satellite data, J. Geo-phys. Res., 113, D14313, doi:10.1029/2008JD009809, 2008.
Harris, N. R. P., Kyrö, E., Staehelin, J., Brunner, D., Andersen, S.-B., Godin-Beekmann, S., 10
Dhomse, S., Hadjinicolaou, P., Hansen, G., Isaksen, I., Jrrar, A., Karpetchko, A., Kivi, R., Knudsen, B., Krizan, P., Lastovicka, J., Maeder, J., Orsolini, Y., Pyle, J. A., Rex, M., Van-icek, K., Weber, M., Wohltmann, I., Zanis, P., and Zerefos, C.: Ozone trends at north-ern mid- and high latitudes – a European perspective, Ann. Geophys., 26, 1207–1220, doi:10.5194/angeo-26-1207-2008, 2008.
15
Huijnen, V., Williams, J., van Weele, M., van Noije, T., Krol, M., Dentener, F., Segers, A., Houwel-ing, S., Peters, W., de Laat, J., Boersma, F., Bergamaschi, P., van Velthoven, P., Le Sager, P., Eskes, H., Alkemade, F., Scheele, R., Nédélec, P., and Pätz, H.-W.: The global chemistry transport model TM5: description and evaluation of the tropospheric chemistry version 3.0, Geosci. Model Dev., 3, 445–473, doi:10.5194/gmd-3-445-2010, 2010.
20
Inness, A., Baier, F., Benedetti, A., Bouarar, I., Chabrillat, S., Clark, H., Clerbaux, C., Coheur, P., Engelen, R. J., Errera, Q., Flemming, J., George, M., Granier, C., Hadji-Lazaro, J., Huij-nen, V., Hurtmans, D., Jones, L., Kaiser, J. W., Kapsomenakis, J., Lefever, K., Leitão, J., Razinger, M., Richter, A., Schultz, M. G., Simmons, A. J., Suttie, M., Stein, O., Thépaut, J.-N., Thouret, V., Vrekoussis, M., Zerefos, C., and the MACC team: The MACC reanalysis: an 8 yr 25
data set of atmospheric composition, Atmos. Chem. Phys., 13, 4073–4109, doi:10.5194/acp-13-4073-2013, 2013.
IPCC: Climate Change 2013: The Physical Science Basis, Contribution of Working Group I to the Fifth Assessment Report of the Intergovernmental Panel on Climate Change, edited by: Stocker, T. F., Qin, D., Plattner, G.-K., Tignor, M., Allen, S. K., Boschung, J., Nauels, A., 30
AMTD
8, 3283–3319, 2015Extended and refined multi sensor reanalysis of total
ozone
R. J. van der A et al.
Title Page
Abstract Introduction
Conclusions References
Tables Figures
◭ ◮
◭ ◮
Back Close
Full Screen / Esc
Printer-friendly Version
Interactive Discussion
Discussion
P
a
per
|
Discussion
P
a
per
|
Discussion
P
a
per
|
Discussion
P
a
per
|
Kerr, J. B.: New methodology for deriving total ozone and other atmospheric vari-ables from Brewer spectrophotometer direct sun spectra, J. Geophys. Res., 107, 4731, doi:10.1029/2001JD001227, 2002.
Knibbe, J. S., van der A, R. J., and de Laat, A. T. J.: Spatial regression analysis on 32 years of total column ozone data, Atmos. Chem. Phys., 14, 8461–8482, doi:10.5194/acp-14-8461-5
2014, 2014.
Krol, M., Houweling, S., Bregman, B., van den Broek, M., Segers, A., van Velthoven, P., Peters, W., Dentener, F., and Bergamaschi, P.: The two-way nested global chemistry-transport zoom model TM5: algorithm and applications, Atmos. Chem. Phys., 5, 417–432, doi:10.5194/acp-5-417-2005, 2005.
10
Krueger, A. J., Guenther, B., Fleig, A. J., Heath, D. F., Hilsenrath, E., McPeters, R., and Prab-hakara, C.: Satellite ozone measurements, Philos. T. R. Soc. A, 296, 191–204, 1980. Kuttippurath, J., Lefèvre, F., Pommereau, J.-P., Roscoe, H. K., Goutail, F., Pazmiño, A., and
Shanklin, J. D.: Antarctic ozone loss in 1979–2010: first sign of ozone recovery, Atmos. Chem. Phys., 13, 1625–1635, doi:10.5194/acp-13-1625-2013, 2013.
15
Levelt, P. F., van den Oord, G. H. J., Dobber, M. R., Mälkki, A., Visser, H., de Vries, J., Stammes, P., Lundell, J., and Saari, H.: The Ozone Monitoring Instrument, IEEE Trans. Geo. Remote. Sens., 44, 1093–1101, doi:10.1109/TGRS.2006.872333, 2006.
Lindfors, A., Tanskanen, A., Arola, A., van der A, R., Bais, A., Feister, U., Janouch, M., Josefsson, W., Koskela, T., Lakkala, K., den Outer, P. N., Smedley, A. R. D., 20
Slaper, H., and Webb, A. R.: The PROMOTE UV Record: toward a global satellite-based climatology of surface ultraviolet irradiance, IEEE J. Sel. Top. Appl., 2, 207–212, doi:10.1109/JSTARS.2009.2030876, 2009.
Mäder, J. A., Staehelin, J., Brunner, D., Stahel, W. A., Wohltmann, I., and Peter, T.: Statistical modeling of total ozone: selection of appropriate explanatory variables, J. Geophys. Res., 25
112, D11108, doi:10.1029/2006JD007694, 2007.
Miller, A. J., Nagatani, R. M., Flynn, L. E., Kondragunta, S., Beach, E., Stolarski, R., McPeters, R. D., Bhartia, P. K., DeLand, M. T., Jackman, C. H., Wuebbles, D. J., Patten, K. O., and Cebula, R. P.: A cohesive total ozone data set from the SBUV(/2) satellite system, J. Geophys. Res., 107, 4701, doi:10.1029/2001JD000853, 2002.
30
AMTD
8, 3283–3319, 2015Extended and refined multi sensor reanalysis of total
ozone
R. J. van der A et al.
Title Page
Abstract Introduction
Conclusions References
Tables Figures
◭ ◮
◭ ◮
Back Close
Full Screen / Esc
Printer-friendly Version
Interactive Discussion
Discussion
P
a
per
|
Discussion
P
a
per
|
Discussion
P
a
per
|
Discussion
P
a
per
|
Staehelin, J., Harris, N. R. P., Appenzeller, C., and Eberhard, J.: Ozone trends: a review, Rev. Geophys., 39, 231–290, 2001.
Stolarski, R. S., Bloomfield, P., McPeters, R. D., and Herman, J. R.: Total Ozone trends deduced from Nimbus 7 Toms data, Geophys. Res. Lett., 18, 1015–1018, 1991.
Stolarski, R. S., Labow, G. J., and McPeters, R. D.: Springtime Antarctic total ozone measure-5
ments in the early 1970s from the BUV instrument on Nimbus 4, Geophys. Res. Lett., 24, 591–594, 1997.
Stolarski, R. S., Douglass, A. R., Steenrod, S., and Pawson, S.: Trends in stratospheric ozone: lessons learned from a 3-D chemical transport model, J. Atmos. Sci., 63, 1028–1041, 2006. Uppala, S. M., Kållberg, P. W., Simmons, A. J., Andrae, U., Bechtold, V. D. C., Fiorino, M., Gib-10
son, J. K., Haseler, J., Hernandez, A., Kelly, G. A., Li, X., Onogi, K., Saarinen, S., Sokka, N., Allan, R. P., Andersson, E., Arpe, K., Balmaseda, M. A., Beljaars, A. C. M., Berg, L. V. D., Bidlot, J., Bormann, N., Caires, S., Chevallier, F., Dethof, A., Dragosavac, M., Fisher, M., Fuentes, M., Hagemann, S., Hólm, E., Hoskins, B. J., Isaksen, L., Janssen, P. A. E. M., Jenne, R., Mcnally, A. P., Mahfouf, J.-F., Morcrette, J.-J., Rayner, N. A., Saunders, R. W., Si-15
mon, P., Sterl, A., Trenberth, K. E., Untch, A., Vasiljevic, D., Viterbo, P., and Woollen, J.: The ERA-40 re-analysis, Q. J. Roy. Meteor. Soc., 131, 2961–3012, doi:10.1256/qj.04.176, 2005. van der A, R. J., Allaart, M. A. F., and Eskes, H. J.: Multi sensor reanalysis of total ozone,
Atmos. Chem. Phys., 10, 11277–11294, doi:10.5194/acp-10-11277-2010, 2010.
van Noije, T. P. C., Le Sager, P., Segers, A. J., van Velthoven, P. F. J., Krol, M. C., Hazeleger, W., 20
Williams, A. G., and Chambers, S. D.: Simulation of tropospheric chemistry and aerosols with the climate model EC-Earth, Geosci. Model Dev., 7, 2435–2475, doi:10.5194/gmd-7-2435-2014, 2014.
Weber, M., Steinbrecht, W., van der A, R. J., Coldewey-Egbers, M., Fioletov, V. E., Frith, S. M., Long, C. S., Loyola, D., and Wild, J. D.: Global climate, stratospheric ozone, B. Am. Meteorol. 25
Soc., 95, S38–S40, 2014.
World Meteorological Organisation (WMO): Scientific Assessment of Ozone Depletion, 2006: Global Ozone Research and Monitoring Project – Report No. 50, Geneva, Switzerland, 572 pp., 2007.
World Meteorological Organization (WMO): Scientific Assessment of Ozone Depletion, 2014: 30
AMTD
8, 3283–3319, 2015Extended and refined multi sensor reanalysis of total
ozone
R. J. van der A et al.
Title Page
Abstract Introduction
Conclusions References
Tables Figures
◭ ◮
◭ ◮
Back Close
Full Screen / Esc
Printer-friendly Version
Interactive Discussion
Discussion
P
a
per
|
Discussion
P
a
per
|
Discussion
P
a
per
|
Discussion
P
a
per
|
Table 1. The satellite datasets used in this study. The columns show (1) the name of the dataset, (2) the satellite instrument, (3) the satellite, (4 and 5) the time period, (6) the maximum distance allowed in an overpass, (7) the number of ground stations (GS) and (8) the total number of overpasses for this dataset.
Name Instrument Satellite From To Dist. #GS Overpasses
BUV BUV Nimbus-4 1 Apr 1970 6 May 1977 2.00◦ 66 4201
TOMS-N7 TOMS Nimbus-7 31 Oct 1978 6 May 1993 0.75◦ 135 182 138
TOMS-EP TOMS Earth probe 25 Jul 1996 31 Dec 2002 0.75◦ 155 141 775
SBUVN07 SBUV Nimbus-7 31 Oct 1978 21 Jun 1990 2.00◦ 110 25 366
SBUVN09 SBUV/2 NOAA-9 2 Feb 1985 19 Feb 1998 2.00◦ 156 39 139
SBUVN11 SBUV/2 NOAA-11 1 Dec 1988 27 Mar 2001 2.00◦ 171 39 926
SBUVN14 SBUV/2 NOAA-14 5 Feb 1995 28 Sep2006 2.00◦ 167 52 423
SBUVN16 SBUV/2 NOAA-16 3 Oct 2000 31 Dec 2003 2.00◦ 173 58 844
SBUVN17 SBUV/2 NOAA-17 11 Jul 2002 31 Dec 2011 2.00◦ 168 50 074
SBUVN18 SBUV/2 NOAA-18 5 Jun 2005 31 Dec 2011 2.00◦ 148 35 797
SBUVN19 SBUV/2 NOAA-19 23 Feb 2009 31 Dec 2011 2.00◦ 127 14 976
GDP5 GOME-1 ERS-2 27 Jun 1995 3 Jul 2011 1.80◦ 156 144 645
TOGOMI2 GOME-1 ERS-2 27 Jun 1995 3 Jul 2011 200 km 155 146 150
SGP5 SCIAMACHY Envisat 2 Aug 2002 8 Apr 2012 100 km 139 86 144
TOSOMI2 SCIAMACHY Envisat 2 Aug 2002 8 Apr 2012 100 km 139 87 938
OMDOAO3 OMI Aura 1 Oct 2004 31 Dec 2012 100 km 123 172 031
OMTO3 OMI Aura 1 Oct 2004 31 Dec 2012 100 km 125 169 325
AMTD
8, 3283–3319, 2015Extended and refined multi sensor reanalysis of total
ozone
R. J. van der A et al.
Title Page
Abstract Introduction
Conclusions References
Tables Figures
◭ ◮
◭ ◮
Back Close
Full Screen / Esc
Printer-friendly Version
Interactive Discussion
Discussion
P
a
per
|
Discussion
P
a
per
|
Discussion
P
a
per
|
Discussion
P
a
per
|
Table 2. Regression coefficients (expressed as corrections) for the various ozone datasets.
The columns show (1) name; (2) RMS original data; (3) offset correction; (4) trend correction;
(5) viewing zenith angle correction; (6) linear solar zenith angle correction; (7) 2nd order solar zenith angle correction; (8) effective ozone temperature correction.
Name RMS Offset Trend VZA SZA-1 SZA-2 T
eff
(DU) (DU) (DU year−1) (DU deg.−1) (DU deg.−1) (DU deg.−1) (DU K−1)
BUV 13.35 20.00 0.81 N/A 0.057 −0.0054 −0.23
TOMS-N7 9.64 −1.40 0.13 0.004 0.045 0.0004 −0.29
TOMS-EP 9.40 0.49 0.49 0.021 0.125 −0.0017 −0.36
SBUV07 10.60 4.78 0.42 N/A −0.014 −0.0001 −0.18
SBUV09 10.46 −4.63 −0.37 N/A −0.092 0.0037 −0.07
SBUV11 10.14 −1.56 −0.08 N/A −0.023 0.0007 −0.17
SBUV14 10.18 −1.58 0.32 N/A 0.062 −0.0017 −0.16
SBUV16 9.71 −2.87 0.41 N/A −0.077 0.0016 −0.29
SBUV17 10.73 −1.08 0.06 N/A 0.029 −0.0013 −0.28
SBUV18 9.39 −0.39 −0.11 N/A 0.013 −0.0010 −0.33
SBUV19 9.51 −1.05 0.09 N/A 0.004 −0.0013 −0.27
GDP5 8.92 −1.76 −0.10 0.037 0.136 −0.0031 0.05
TOGOMI2 8.70 0.35 0.07 0.079 0.036 −0.0022 −0.06
SGP5 9.64 −2.00 0.09 −0.018 −0.017 −0.0009 −0.06
TOSOMI2 8.56 2.09 0.17 0.046 0.021 −0.0050 0.00
OMDOAO3 9.09 4.03 0.00 −0.015 0.009 −0.0019 −0.13
OMTO3 7.51 3.32 −0.00 0.001 0.006 −0.0006 −0.27
GOME2 8.08 4.04 0.08 0.005 0.085 −0.0048 −0.17
AMTD
8, 3283–3319, 2015Extended and refined multi sensor reanalysis of total
ozone
R. J. van der A et al.
Title Page
Abstract Introduction
Conclusions References
Tables Figures
◭ ◮
◭ ◮
Back Close
Full Screen / Esc
Printer-friendly Version
Interactive Discussion
Discussion
P
a
per
|
Discussion
P
a
per
|
Discussion
P
a
per
|
Discussion
P
a
per
|
Table 3.Corrections that have been applied to the satellite datasets. The columns show: (1) name; (2) RMS after application of these corrections; (3) offset correction; (4) trend correction;
(5) view angle correction; (6) linear solar zenith angle correction; (7) 2nd order solar zenith angle correction; (8) effective ozone temperature correction. TOMS-EP (1) is the time series
until 31 December 2001 and TOMS-EP (2) is the time series after this date. “pixel” indicates that the correction is done as function of scan index.
Name RMS Offset Trend VZA SZA-1 SZA-2 Teff
(DU) (DU) (DU year−1) (DU deg.−1) (DU deg.−1) (DU deg.−2) (DU◦C−1)
BUV 13.45 −3.06 0.091 −0.0049
TOMS-N7 9.64 −3.13 pixel 0.063 −0.294
TOMS-EP(1) 9.04 0.24 pixel 0.043 −0.339
TOMS-EP(2) 9.94 −6.99 3.660 pixel 0.170 −0.390
SBUV07 10.61 4.43 0.415 −0.160
SBUV09 10.47 −4.71 −0.353 −0.089 0.0037
SBUV11 10.15 −1.08 −0.178
SBUV14 10.18 −1.56 0.324 0.060 −0.0017 −0.159
SBUV16 9.77 −2.28 0.0012 −0.170
SBUV17 9.40 −1.05 −0.236
SBUV18 9.39 −1.74 −0.285
SBUV19 9.53 −0.94 −0.202
GDP5 8.92 −1.92 pixel 0.136 −0.0034
TOGOMI2 8.71 0.37 pixel 0.040 −0.0020
SGP5 9.69 −2.36
TOSOMI2 8.57 3.36 0.047 0.019 −0.0050
OMDOAO3 8.68 3.77 pixel 0.025 −0.0016
OMTO3 7.51 3.07 −0.232
AMTD
8, 3283–3319, 2015Extended and refined multi sensor reanalysis of total
ozone
R. J. van der A et al.
Title Page
Abstract Introduction
Conclusions References
Tables Figures
◭ ◮
◭ ◮
Back Close
Full Screen / Esc
Printer-friendly Version
Interactive Discussion
Discussion
P
a
per
|
Discussion
P
a
per
|
Discussion
P
a
per
|
Discussion
P
a
per
|
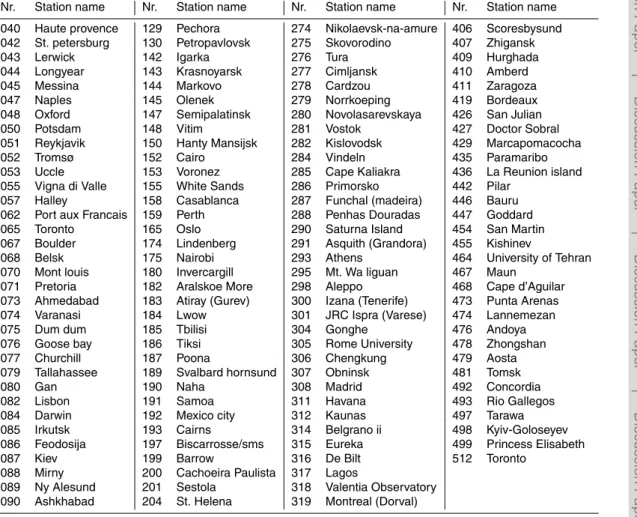
Table A1.List of ground stations used in this study, showing the WMO number of the station and its name.
Nr. Station name Nr. Station name Nr. Station name Nr. Station name
002 Tamanrasset 091 Buenos Aires 207 Mahe (Seychelles) 320 Winnipeg 003 Alma-Ata 092 Hobart 208 Xianghe 321 Halifax (bedford) 005 Dikson Island 095 Taipei 209 Kunming 322 Petaling Jaya 007 Kagoshima 096 Hradec Kralove 211 King Edward Point 324 Scott Base 008 Kodaikanal 097 Magny-les-Hameaux 213 El Arenosillo 326 Long Fengshan 009 Mount Abu 098 Val Joyeaux 214 Singapore 327 Angra do Heroismo 010 New Delhi 099 Hohenpeissenberg 216 Bangkok 331 Poprad-Ganovce 011 Quetta 100 Budapest-Lorinc 217 Poker flat 332 Pohang 012 Sapporo 101 Syowa 218 Manila 336 Isfahan
013 Srinagar 102 Bracknell 219 Natal 338 Bratts lake (regina) 014 Tsukuba 104 Bedford 222 Maputo 339 Ushuaia
016 Vladivostok 105 Fairbanks 223 Nampula 340 Springbok 018 Alert 106 Nashville 226 Bucharest 341 Hanford
019 Bismarck 107 Wallops Island 232 Faraday/Vernadsky 342 Comodoro rivadavia 020 Caribou 110 Huancayo 233 Marambio 343 Salto
021 Edmonton 111 Amundsen-Scott 241 Saskatoon 345 Songkhla 022 Green Bay 112 Bolshaya Elan 243 Brindisi 346 Murcia 024 Resolute 113 Dushanbe 244 Fresno 347 Issyk-Kul 026 Aspendale 114 Heiss Island 245 Aswan 348 Ankara 027 Brisbane 115 Samara 252 Seoul 349 Lhasa
AMTD
8, 3283–3319, 2015Extended and refined multi sensor reanalysis of total
ozone
R. J. van der A et al.
Title Page
Abstract Introduction
Conclusions References
Tables Figures
◭ ◮
◭ ◮
Back Close
Full Screen / Esc
Printer-friendly Version
Interactive Discussion
Discussion
P
a
per
|
Discussion
P
a
per
|
Discussion
P
a
per
|
Discussion
P
a
per
|
Table A1.Continued.
Nr. Station name Nr. Station name Nr. Station name Nr. Station name
040 Haute provence 129 Pechora 274 Nikolaevsk-na-amure 406 Scoresbysund 042 St. petersburg 130 Petropavlovsk 275 Skovorodino 407 Zhigansk 043 Lerwick 142 Igarka 276 Tura 409 Hurghada 044 Longyear 143 Krasnoyarsk 277 Cimljansk 410 Amberd 045 Messina 144 Markovo 278 Cardzou 411 Zaragoza 047 Naples 145 Olenek 279 Norrkoeping 419 Bordeaux 048 Oxford 147 Semipalatinsk 280 Novolasarevskaya 426 San Julian 050 Potsdam 148 Vitim 281 Vostok 427 Doctor Sobral 051 Reykjavik 150 Hanty Mansijsk 282 Kislovodsk 429 Marcapomacocha 052 Tromsø 152 Cairo 284 Vindeln 435 Paramaribo 053 Uccle 153 Voronez 285 Cape Kaliakra 436 La Reunion island 055 Vigna di Valle 155 White Sands 286 Primorsko 442 Pilar
057 Halley 158 Casablanca 287 Funchal (madeira) 446 Bauru 062 Port aux Francais 159 Perth 288 Penhas Douradas 447 Goddard 065 Toronto 165 Oslo 290 Saturna Island 454 San Martin 067 Boulder 174 Lindenberg 291 Asquith (Grandora) 455 Kishinev
068 Belsk 175 Nairobi 293 Athens 464 University of Tehran 070 Mont louis 180 Invercargill 295 Mt. Wa liguan 467 Maun
071 Pretoria 182 Aralskoe More 298 Aleppo 468 Cape d’Aguilar 073 Ahmedabad 183 Atiray (Gurev) 300 Izana (Tenerife) 473 Punta Arenas 074 Varanasi 184 Lwow 301 JRC Ispra (Varese) 474 Lannemezan 075 Dum dum 185 Tbilisi 304 Gonghe 476 Andoya 076 Goose bay 186 Tiksi 305 Rome University 478 Zhongshan 077 Churchill 187 Poona 306 Chengkung 479 Aosta 079 Tallahassee 189 Svalbard hornsund 307 Obninsk 481 Tomsk 080 Gan 190 Naha 308 Madrid 492 Concordia 082 Lisbon 191 Samoa 311 Havana 493 Rio Gallegos 084 Darwin 192 Mexico city 312 Kaunas 497 Tarawa 085 Irkutsk 193 Cairns 314 Belgrano ii 498 Kyiv-Goloseyev 086 Feodosija 197 Biscarrosse/sms 315 Eureka 499 Princess Elisabeth 087 Kiev 199 Barrow 316 De Bilt 512 Toronto
088 Mirny 200 Cachoeira Paulista 317 Lagos
AMTD
8, 3283–3319, 2015Extended and refined multi sensor reanalysis of total
ozone
R. J. van der A et al.
Title Page
Abstract Introduction
Conclusions References
Tables Figures
◭ ◮
◭ ◮
Back Close
Full Screen / Esc
Printer-friendly Version
Interactive Discussion
Discussion
P
a
per
|
Discussion
P
a
per
|
Discussion
P
a
per
|
Discussion
P
a
per
|
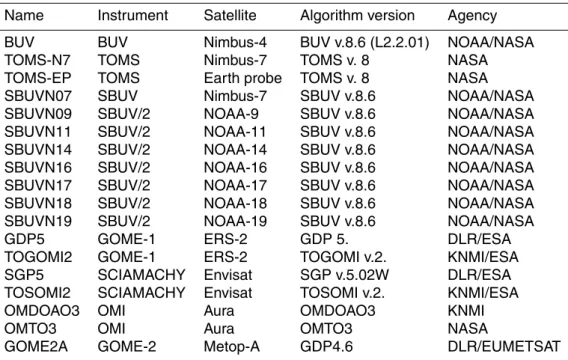
Table A2.The satellite datasets used in this study. The columns show the name of the dataset, the satellite instrument on which it is based, the satellite, the algorithm version used and the responsible agency for this dataset.
Name Instrument Satellite Algorithm version Agency
BUV BUV Nimbus-4 BUV v.8.6 (L2.2.01) NOAA/NASA
TOMS-N7 TOMS Nimbus-7 TOMS v. 8 NASA
TOMS-EP TOMS Earth probe TOMS v. 8 NASA
SBUVN07 SBUV Nimbus-7 SBUV v.8.6 NOAA/NASA
SBUVN09 SBUV/2 NOAA-9 SBUV v.8.6 NOAA/NASA
SBUVN11 SBUV/2 NOAA-11 SBUV v.8.6 NOAA/NASA
SBUVN14 SBUV/2 NOAA-14 SBUV v.8.6 NOAA/NASA
SBUVN16 SBUV/2 NOAA-16 SBUV v.8.6 NOAA/NASA
SBUVN17 SBUV/2 NOAA-17 SBUV v.8.6 NOAA/NASA
SBUVN18 SBUV/2 NOAA-18 SBUV v.8.6 NOAA/NASA
SBUVN19 SBUV/2 NOAA-19 SBUV v.8.6 NOAA/NASA
GDP5 GOME-1 ERS-2 GDP 5. DLR/ESA
TOGOMI2 GOME-1 ERS-2 TOGOMI v.2. KNMI/ESA
SGP5 SCIAMACHY Envisat SGP v.5.02W DLR/ESA
TOSOMI2 SCIAMACHY Envisat TOSOMI v.2. KNMI/ESA
OMDOAO3 OMI Aura OMDOAO3 KNMI
OMTO3 OMI Aura OMTO3 NASA
AMTD
8, 3283–3319, 2015Extended and refined multi sensor reanalysis of total
ozone
R. J. van der A et al.
Title Page
Abstract Introduction
Conclusions References
Tables Figures
◭ ◮
◭ ◮
Back Close
Full Screen / Esc
Printer-friendly Version
Interactive Discussion
Discussion
P
a
per
|
Discussion
P
a
per
|
Discussion
P
a
per
|
Discussion
P
a
per
|
Figure 3.Mean ozone values for the period 1970–2012 above De Bilt (5.18◦E, 52.1◦N) (left,
AMTD
8, 3283–3319, 2015Extended and refined multi sensor reanalysis of total
ozone
R. J. van der A et al.
Title Page
Abstract Introduction
Conclusions References
Tables Figures
◭ ◮
◭ ◮
Back Close
Full Screen / Esc
Printer-friendly Version
Interactive Discussion
Discussion
P
a
per
|
Discussion
P
a
per
|
Discussion
P
a
per
|
Discussion
P
a
per
|