Most Favorable Control Routing Technique
Dr.M.B. Mukesh Krishnan
Assistant Professor, Department of Information Technology SRM University, Kattankulathur, Chennai 603 203, India
mukeshkrishnan.mb@ktr.srmuniv.ac.in
T.Balachander
Assistant Professor, Department of Computer Science and Engineering SRM University, Chennai - 603 203, India
balachander.t@ktr.srmuniv.ac.in
P.Rajasekar
Assistant Professor, Department of Information Technology SRM University, Kattankulathur, Chennai 603 203, India
rajasekar.p@ktr.srmuniv.ac.in
Abstract - Mobile Ad-hoc Networks (MANET) is a self-administrating network, which consists of wireless mobile nodes that communicate each other without using any fixed infrastructure. Broadcasting plays a vital role, where a source node will transmit a packet to all other nodes in the network to find the destination. Flooding is a broadcast mechanism where every node in the network retransmits a packet to its neighbors upon receiving it for the first time and lead to broadcast storm problems. To overcome these problems, Most Favorable Control Routing Technique is proposed
KEYWORDS:MANET,ROUTING,PERFORMANCE,AODV.
I. INTRODUCTION
Wireless technology is one of the fast emerging technologies in the field of networking. The basic design goals are the exchange of information between end users without having any kind of physical connectivity between the devices and supporting mobility of the nodes. The fast growth in the field of wireless technologies is due to the emergence of devices like laptop, tablet, wireless modems and wireless routers that support wireless Local Area Network, which give the user the comfort mobility. With the steady increase in the number of users and mobility, the design of infrastructure becomes costly. This was the time when the Mobile Ad hoc network appeared.
Wireless ad hoc networks (also referred to as packet radio networks and multi hop radio networks) consist of mobile nodes communicating over a shared wireless channel. Contrary to cellular networks, where the nodes are restricted to communicate with a set of carefully placed base stations. MANET, being an infra structure less network, does not have any base station, the structure of MANET and link between nodes change dynamically (David Johnson and David Maltz, 1996) . Due to the any two nodes in wireless ad hoc network are allowed to communicate directly if they are close enough, else nodes use multi hop routing to deliver their packets to distant destinations. Each node must forward traffic unrelated to its own use, and therefore be a router. The primary challenge in building a MANET is equipping each device to continuously maintain the information required to properly route traffic.
The major advantage of ad hoc networks is the “On Demand Setup” where all the nodes which want to have connectivity from their own network without the dependence on any infrastructure. This becomes a major use in places of disaster recovery, Defense applications (army, navy, air force) and Academic institutions, where there needs to be a fast communication set up. There is no need of any infrastructure like routers, as all the nodes can act as routers to establish connectivity and start the communication process. This inherent characteristic boosts up the use of ad hoc networks.
For all those reasons, mobile ad hoc networking is one of the most innovative and challenging areas of wireless networking and this technology promises to become increasingly present in everybody’s life.
This might bring a new research focus on the problem that might be to realize minimizing the drainage of battery power, controlling the congestion in Ad hoc networks. This offers many opportunities for a protocol design to find the efficient route discovery as well.
II. MOST FAVORABLE CONTROL ROUTING TECHNIQUE
If a route was found, then the node proceeds to transmit the packet; else, it broadcasts a RREQ (route request) packet to the destination node, which on receipt of it sends a RREP (route reply) to the source node. Usually, routing protocols are based on a simplistic form of broadcasting called flooding in which re broadcasting of packets, contention, collisions and broadcast storm problems are the issues that affect performance of routing MANET.
This Most Favorable Control Routing technique segregates the network into five regions according to the means of neighbors. After segregation of the network, it initiates a most favorable route discovery process. In this process, node’s neighbor information is the pointer to decide whether a current node is in dense area; the information is collected by broadcasting “hello” packet every second for only one hop.
This packet will ensure that every node has an updated neighbor list. With respect to the number of neighbors for each node, three threshold values are computed to identify whether the region is in high dense, medium dense, medium, low sparse or medium sparse and the rebroadcast are dynamically adjusted. From the collected information of neighboring nodes the first threshold value Average (n1) is calculated by dividing the
total number of neighbors for each node by total number of nodes in the network using equation n1 =
, where n1 is the average number of neighbors; N is the number of neighbors of each node; N is the total number of nodes. Using threshold value Average the next threshold value Minimum (n2) is calculated using Equation n2
= , dividing the total number of neighbors below Average by the total number of nodes whose neighbors are below Average, where n2 is the mean minimum number of neighbors; N is the number of neighbors of each node below average; R is the total number of nodes whose neighbors are below average using the threshold
value Average the next threshold value Maximum (n3) is calculated using Equation n3 =
, dividing the number of neighbors of each node above average by the total number of nodes whose neighbors are above average. where n3 is the mean maximum number of neighbors; N is the number of neighbors of each node above Average; K is the total number of nodes whose neighbors are above Average.
The nodes having the value of neighbor nodes less than threshold value minimum n2 are identified and segregated into low sparse region. The nodes having the value of neighbor nodes greater than are equal to minimum n2 threshold value and less than average threshold value are identified and segregated into medium sparse region. The nodes having the value of neighbor nodes equal to average threshold value are identified and segregated into medium region. The nodes having the value of neighbor nodes greater than average threshold value and less than are equal to maximum threshold value are identified and segregated into maximum dense region. The nodes having the value of neighbor nodes greater than maximum threshold value are identified and segregated into high dense region.
The steps involved in Most Favorable Route discovery algorithm is given below, Step 1. On hearing a broadcast packet m at node X;
Step 2. Get the average number of neighbors (n1), minimum numbers of neighbors (n2) and maximum number of neighbors (n3) .
Step 3. Get the total number of neighbors (n). Step 4. If packet m received for the first time then Step 5. If n<n2 then
Step 6. Node lies in the low sparse region = Cmin Step 7. If n>=n2&&n<n1 then
Step 8. Node lies in the medium sparse region = Cmin1 Step 9. If n==n1 then
Step 10.Node lies in the medium region = Cmid Step 11.If n>n1&&n<=n3 then
Step 12.Node lies in the medium dense region = Cmax1 Step 13.If n>n3 then
Step 14.Node lies in the high dense region
Step 15.If counter threshold value>RREQ_RETRIES Step 16.Free the RREQ packet
Step 17.Else
Figure1. Network classification
Low sparse region Medium sparse region
Medium region Medium dense region
High dense region
Figure 1 shows that, the total number of nodes is equal to 15. The total number of neighbors is calculated based on one-hop neighbors of each node and the value of 47 is obtained. Therefore,
AVG = Total number of neighbors / Number of nodes = 47/13 = 4
MIN = Total number of neighbors below average / Number of nodes below average = 26/10 = 3
MAX = Total number of neighbors above average / Number of nodes above average = 12/2 = 6
Based on the regions segregated the rebroadcasts are dynamically adjusted by enabling the rebroadcast or interrupting the packet rebroadcast. The simulation results reveal that total number of possible rebroadcasts of Route request packet (Total no of ReBroadCast) using the Most Favorable Control Routing (MFCR) is less in number compared with normal AODV algorithm.
III. Performance Evaluation
The objective is to evaluate the performance of efficient broadcasting using Most Favorable Control Routing Technique (MFCR) in a simulated environment. Three performance parameters are used: packet delivery ratio ,routing overhead and end to end delay. The impact on these metrics at various CBR sending rate and maximum speed for the proposed schemes are studied. The results are collected as average values of over 10 runs of each simulation setting. The simulation results of the proposed scheme are compared with AODV and found that the proposed schemes have outperformed the traditional AODV at the time of link breakage.
IV. Simulation Setup
A simulation model is set up for experimentation and performance evaluation of the proposed algorithm with NS-2 simulator. The MAC layer protocol used in this simulations was the Distributed Coordination Function (DCF) of IEEE 802.11 . DCF uses Request-To-Send (RTS) and Clear-To-Send (CTS) control packets for unicast transmissions. Broadcast packets are sent using the unspotted Carrier Sense Multiple Access protocol with Collision Avoidance (CSMA/CA) . A two-ray propagation model was also used in the simulations. Wave LAN was modeled as shared media radio with a nominal bit rate of 2 mb/s and the radio range was 250 m. The trace was constant bit rate (CBR). The source and destination of each CBR flow was randomly selected but not to be identical (sources and destinations of different flows might coincide). Each source transmitted 512 bytes of data packets at a specified rate (packets per second). The mobility model was random waypoint, where the speed of a node was randomly chosen from 0 m/s to a given maximum value, and the node stayed for a pause time after reaching a waypoint. The field configuration was 1400 m2 with 100 nodes.
8
3 4 5
1 9
1
D
1
1 1
S 2
V. Performance Metrics
The three important performance metrics considered for performance evaluation are;
Packet Delivery Ratio (PDR)
Routing Overhead
End to End delay
Packet delivery ratio is the ratio of the data packets delivered to the destinations to those generated by the CBR sources; also a related metric, received throughput (in kilobits per second) at the destination has been evaluated in some cases.
Routing overhead is the number of routing packets transmitted per data packet delivered at the destination.
End-to-end delay include all possible delays caused by buffering during route discovery latency, queuing at the interface queue ,retransmission delays at the MAC , and propagation and transfer times.
VI. Result Analysis
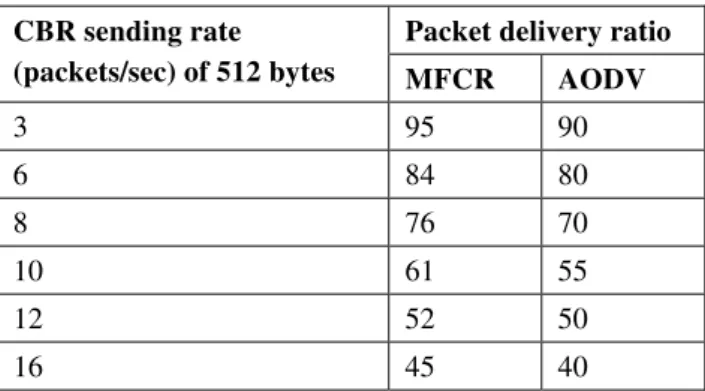
The impact on these metrics at varying network load and maximum speed for the proposed algorithm and the existing algorithm are computed. The results obtained are represented in table format. The effect of CBR sending rate on Packet delivery ratio is shown in Table 1 for Most Favorable Control Routing Technique (MFCR) and AODV. It may be noted that the packet delivery ratio of both protocols decreased as the CBR sending rate increased. If the CBR sending rate increases, the probability of losing a packet will be high. However, MFCR has higher packet delivery ratio than has AODV.
Table 1 Packet delivery ratio over Network Load (packets/sec)
CBR sending rate (packets/sec) of 512 bytes
Packet delivery ratio
MFCR AODV
3 95 90
6 84 80
8 76 70
10 61 55
12 52 50
16 45 40
The effect of varying Maximum speed on Packet delivery ratio for MFCR and AODV is shown in Table 2. The results are represented, the packet delivery ratio begins to decrease as route breaking shall occur frequently. However, the MFCR protocol, with its efficient route discovery and preventive congestion mechanism, offers increased packet delivery ratio as compared with AODV.
Table 2 Packet delivery ratio over Maximum speed
Maximum speed Packet delivery ratio MFCR AODV
10 90 70
20 88 75
30 86 80
40 84 74
50 82 73
60 80 69
Table 3 Routing Overhead over Network Load (packets/sec)
CBR sending rate (packets/sec) of 512 bytes
Routing Overhead (Number of control packets)
MFCR AODV
5 10000 10000
10 18000 32000
15 28000 48000
20 35000 50000
25 40000 55000
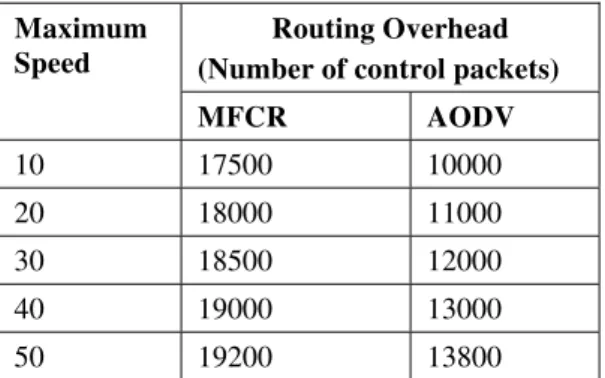
The effect of varying Maximum speed on routing overhead for MFCR and AODV is shown in Table 4. If CBR sending rate increases, the wastage of control packets will be more. Compare with AODV, MFCR protocol is wasted less number of control packets.
Table 4 Routing Overhead over Maximum speed
Maximum Speed
Routing Overhead (Number of control packets)
MFCR AODV
10 17500 10000 20 18000 11000 30 18500 12000 40 19000 13000 50 19200 13800
The effect of varying CBR sending rate on End-to-End delay for MFCR and AODV is shown in Table 5. The delay a packet suffers from the source to reaching the destination. If CBR sending rate increases, the end-to-end delay will also increase. From the Figure, it may be understood that AODV-EBRP has shorter end-end-to-end delay than AODV.
Table 5 End-to-End delay over Network Load (packets/sec)
CBR sending rate (packets/sec) of 512 bytes
End-to-End delay in Seconds
MFCR AODV
4 0.0 0.0
6 0.7 1.0
8 1.1 2.0
10 2.0 3.0
12 2.3 3.7
16 2.8 4.2
The effect of varying Maximum speed on End-to-End delay for MFCR and AODV is shown in Table 6. If node mobility increases, the end-to-end delay will also increase. Route failure probability is reduced in MFCR.
Table 6 End-to-End delay over Maximum speed
Maximum speed End-to-End delay in Seconds
MFCR AODV
10 0.40 0.60
20 0.40 0.60
30 0.41 0.61
40 0.43 0.70
VII. CONCLUSION
In this paper we proposed Most Favorable Control Routing discovery algorithm. The implementation of most favorable method has provided optimal route discovery solution. The proposed route discovery technique is able to overcome the broadcast storm problems associated with flooding. To ensure the necessary QoS in terms of delay & bandwidth while sending packets, reduce the redundant rebroadcast of packets ensuring the increase in packet delivery ratio, less routing overhead and minimum end to end delay.
VIII. REFERENCES
[1] M.B. Mukesh Krishnan and Dr. P. Sheik Abdul Khader , “Fuzzy Based Security Model to Detect Compromised and Selfish Nodes to Mobile AD HOC Network”, European Journal of Scientific Research September 2012 Edition Volume 86 – Issue 4 page number 520 – 524
[2] M.B. Mukesh Krishnan and Dr. P. Sheik Abdul Khader “Trust Evaluation Model for Mobile Ad Hoc Network”, National Journal of System and Information Technology on December 2011 issue ISSN : 0974 -3308 page number 190 to 195 .
[3] M.B. Mukesh Krishnan and Dr. P. Sheik Abdul Khader “Estimating Detection Trust Hold For Intrusion Detection Systems In Mobile Ad Hoc Network: A Comprehensive Study”, Journal of Computer Applications Research and Development April 2011 issue ISSN No. 2248 -9304 page Number 1-7.
[4] M.B.Mukesh Krishnan and P.Rajasekar, ”Providing QoS in Mobile Ad Hoc Network for Multimedia Communication through Mining Techniques”, In Proceedings of International Conference on Recent Trends in Computing(ICRTC), Ghaziabad, India on October 2012 ISBN : 978-93-81583-67-8 page number 40-42.
[5] David B. Johnson and David A. Maltz.(1996) “Dynamic source routing in ad hoc wireless networks”. Technical report, Carnegie Mellon University.
[6] Ipsita Panda “A Survey on Routing Protocols of MANETs by using QoS metrics”, International Journal of Advanced Research in Computer Science and Software Engineering, volume 2, pp:120-129. October 2012
[7] Ricordo Lent, “Linear QoS Goals of Additive and Concave Metrics in Ad-hoc Cognitive Packet Routing”, IEEE TRANSACTIONS ON SYSTEMS, MAN, AND CYBERNETICS—PART B: CYBERNETICS ,volume 36, NO.6, pp: 1255-1260, December 2006 [8] P.venkata krishna et al. “ QoS Enabled Ant Colony Based Multipath Routing for Mobile Ad-hoc Networks”, IET communications, vol
6, issue 1. pp:76-83, 2012
[9] Chakeres et.al., “AODV routing protocol implementation design”, 24th International Conference on Distributed Computing Systems Workshops, pp: 698-703, March 2004