ELECTROTECHNICS, ELECTRONICS, AUTOMATIC CONTROL, INFORMATICS
THERMAL PROCESSES’ IDENTIFICATION USING VIRTUAL INSTRUMENTATION
Iosif Olah1, Nicoleta Ştefania Hulea2, Lucian Mastacan1 and Octavian Costel Vornicu3
1
”Gh. Asachi” Technical University of Iaşi, D. Mangeron 53 A, 700050 România, [email protected], 2CET Iaşi, Calea Chişinăului 25, 700265 România,
3
Rom Star Tehnica S.A. Iaşi, Aleea V. Alecsandri 5, 700054 România.
Abstract: In this paper the experimental identification problem of thermal processes is presented, in order to establish their mathematical models which permit the adoption of the automation solutions, respectively the specification of a suitable control law. With this aim in view, the authors resorted to use Virtual Instrumentation with the aid of the LabVIEW development medium. In order to solve the problem of acquisition and processing data from physical real processes, Virtual Instruments which provide at the end a mathematical model which is basis of choosing the automation equipment of the aim followed was designed and achieved. The achieved Virtual Instruments get the opportunity to be used either in student instruction field with the virtual processes identification techniques or to put the identification of some real processes to good use of diverse beneficiaries. The results of some experimental attempts which were achieved during different thermal processes, illustrate the utility of the demarches performed in this paper.
Keywords: experimental identification, identification, industrial processes, process, thermal process, virtual instrumentation.
1. INTRODUCTION 1.1 Identification of the processes.
The industrial processes (IP) are purpose oriented technical systems having the task of changing the inputs (raw matters, energies, information) in wanted outputs (in general, material goods) in conditions of efficiency and with the assurance ecologic conditions of development.
In order to obtain the required performances (quality, quantity) it is necessary to manage the transformation process by automated control or monitoring. In this purpose, an equipment is necessary to be attached for the process (called, automation equipment), composed of number of structural elements, which solves the following problems: acquires the working data from the process, takes proper decision directing
to the aim and the acquired data, achieves interventions, influences the process until the desirable results are obtained.
Choosing/adoption the automation equipment need to know the features/properties of the respective process.
At the moment, the properties of the industrial processes can be emphasized through the utilization of his appropriate mathematical model (Penescu, et al., 1971; Rohrs, et al., 1993; Niculiţa, et al., 1993).These are usually linear differential equations (with constant or variable coefficients), transfer functions, etc., which binds the input and the output parameters of the considered process, reflecting its stationary and dynamic properties.
The operation through which is established the mathematical model of a process gets the name of
The identification can be ( и в, et al., 1967; Penescu, et al., 1971):
- theoretically, when through the application of laws which govern the phenomena from the analyzed process the appropriate mathematical model can be obtained; model which binds the input and the output parameters of the process;
- experimentally, when on the basis of some experimental attempts realized on the process and acquired data processing the appropriate mathematical model are obtained.
Sometimes, in order to obtain the appropriate mathematical models, these two methods of identification are combined.
1.2 The experimental identification with testing signals.
As part of experimental identification the conception of the mathematical model is followed through processing, with the help of simple and efficient algorithms, of some experimentally obtained results, in certain experimentation conditions.
The experimental identification stages refer to: the organization and the realization of data acquisition; the interpretation and the processing acquired data; the deduction of the mathematic model through mathematical approximation of the results.
The first stage requires the adoption of some proper methods and proceedings which have in view the following appearances: the initial information about the process (its main structure, the parameters which intervene and the connection between these); the possibility of accomplishing the experiment (in natural conditions of its operation or through break natural operation); the form and the limits of variation of the physical parameters which intervene; the influence of dynamic features of the transducers and the used devices in order to achieve data acquisition.
The second stage enforces in the first place the selection and systematization of the results obtained with the aim of the detachment of useful information from acquired data, then the correction of the errors of the method, of the device and of the transmitted information; after this stage, the experimental results are obtained in the shape of tables or charts, fitted methods of approximation will be used in the third stage.
As part of the third stage different mathematical methods of estimating the obtained results is applied; methods which lead to a mathematical model in the shape of a differential equation or as a transfer function.
Practice is usually followed by the obtaining of the transfer function of the process because this is in tight touch with output experimental determinations. With the aim of experimental identification of the processes the following categories of methods are
used ( и в, et al., 1967; Penescu, et al., 1971): identification with testing signal; identification without testing signal, using the parameters from the natural operation of the process; the methods using the adjustable models.
The identification methods with testing signals are active methods because in order to realize the processes’ identification they are acted externally by applying testing signals. The identification is based on the fact that the testing signals applied to the entrance of the process causes variations of the outputs, which reflected these features. With the aim of identification testing signal type is used: step, ramp signal, Dirac impulse and sine-wave.
1.3 The self-stabilizing industrial processes’ experimental identification based on simplified transfer functions.
The great part of the industrial process (the one with transfer of mass, of energy, of warmth etc.) owns the behaviour with self-stabilizing, with or without dead time, characterized by simplified transfer functions as type ( и в, et al., 1967; Penescu, et al., 1971):
s e Ts 1 K ) s (
G −τ
+
= (1)
or s 2 1 e ) s T 1 )( s T 1 ( K ) s (
G −τ
+ +
=
(2)
where K is the gain inherently associated with the plant, τ is the dead time, T, T1 and T2 are time
constants.
The models characterized by transfer function (1) are typical for the objects which realized a pressure, level or flow rate control; sometimes it can characterize the heating process too. The models type (2) is specific to heating process with more elements for storing the energy.
When, on the basis of initial information the process estimation with the above models is adopted, the problem of identification is reduced to the evaluation of parameters K, τ, T, T1 and T2 on the basis of the
process response to the applied testing signal. There are a few mentions in specialty literature about the experimental identification of some simple processes, such as processes characterized by transfer functions type (1) and (2). In general, at present, the identification methods are described by means of complex mathematical methods (mathematical discreet models, statistical advanced calculation, neuronal networks, etc.), which are difficult to use by non-specialists. (Tertişco, et al., 1980; Tertişco, et al., 1987; and others).
high-performance language for technical computing but in order to use it with success the user needs proper qualification.
In (Olah, et al., 2002) an easy method of experimental identification is presented, assisted by computer, by using the Lookout development medium. But Lookout software is less complex than the Lab VIEW development environment.
The reasons stated above have contributed to the choice of using the graphical language Lab VIEW, developed by National Instruments, in order to develop an experimental method for the identification of processes, assisted by computer. The language (National Instruments, 2006b) is easy to understand and use, even by those who have little experience in the programming field.
Recent results (Olah, et al., 2007) in first order processes identification using Virtual Instrumentation indicate that the graphical language LabVIEW is suitable for plant experimental identification.
2. THE IMPLEMENTED
IDENTIFICATION METHOD
For the experimental identification of the process basis on simplified transfer function some graphic and graphic-analytical methods were suggested and utilized (Strejc, 1959; и в, et al., 1967; Penescu, et al., 1971; Hăngănuţ, 1971; Niculiţa, et al., 1993).
In most of the experimental identification methods graphical constructions are realized on obtained experimental curve, more or less complicated. Based on this the time constants T1 and T2 with the help of
some measurements or using monograph are determined graphically or computed (Strejc, 1959; Penescu, et al., 1971).
Fig. 1. The identification of the second order process: u1, y1 – the input and output initial values;
u2, y2 – the final values of the input and output;
y = y2 – y1;
t30 and t70 are the proper times of reaching values
0,3*y and 0,7*y respectively.
In this paper one from the most known and simple methods (Hăngănuţ, 1971) is implemented on computer by means of Virtual Instrumentation. Practically, in this way an automatic identification is achieved, when the operator works with friendly Front Panels and he does not have to realize any graphic buildings or calculations.
The second order process experimental identification according to (Hăngănuţ, 1971) is based on the experimental answer of the process to a testing signal (a step signal), Fig.1.
In the case of the implemented method, with the help of the times t30 and t70 the time constants T1 and T2
(from the transfer function (2)) is determined using the following equations:
2 . 1 t T
T1+ 2 = 70 (3)
⎟⎟ ⎠ ⎞ ⎜⎜ ⎝ ⎛ − + = − 70 30 70 30 2 1 t t 45 . 0 6 . 0 t t T
T . (4)
The gain K is determined with the help of (5):
1 2 1 2 u u u u y y u y du dy K n − − = ≅ = =
∆
∆
.
(5)To estimate the dead time τ the necessary time that the output increases from y1 value to y1 + 0.02* y1
value is established.
The method presented in Fig. 1 can be implemented more easily than other known experimental identification methods by means of virtual instrumentation.
3. THE EXPERIMENTAL
INSTALLATION
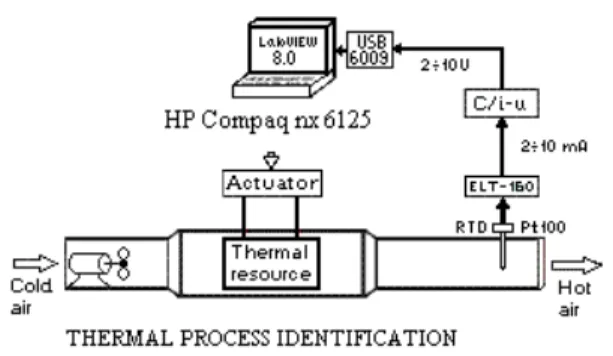
Fig. 2. The experimental installation
4. THE ACHIEVEMENT OF THE VIRTUAL INSTRUMENTS
4.1 The Virtual Instrument for data acquisition.
The Virtual Instrument for the acquisition of data is due to acquire the values of the physical parameter from the process output with a certain frequency. In this case the physical output parameter is temperature from the heating battery or the electric oven. Be used-up a sensor type Pt100 and a signal adapter ELT160, a variation of unified current of 2-10 mA is obtained at the output for a variation range of the temperature of 0-300 oC.
The unified current passed through a calibrated resistant (C/i-u, Fig.2) and delivered a variation of voltage, 2-10 V. This voltage as output signal y (t) is applied to the analogical input AI0 of the NI USB 6009 acquisition board.
The achievement of data acquisition VI was achieved based on the following steps:
- data acquisition with a desired sample of user; - conversion of acquired voltage in real technological parameter, as Celsius degrees for temperature; - graphical displaying of acquired parameter so that the operator can view the evolution of parameter in real time;
- saving the acquired data and also the time, for further processing;
- display data in table in real time;
- stop the data acquisition sequence when the steady-state value is settled.
The designed and realized Virtual Instrument that solves the above problems has two components: the Front Panel (FP) and the Bloc Diagram (DB).
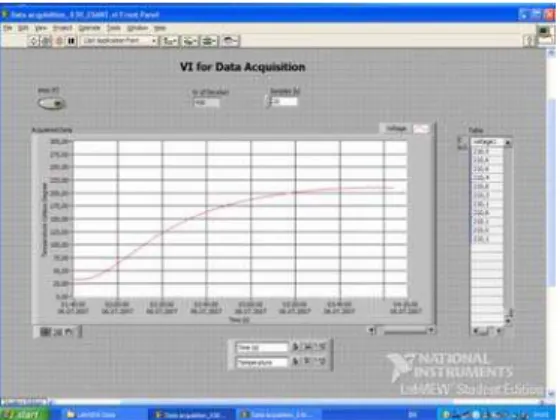
The Front Panel of the achieved data acquisition VI (Olah, et al., 2007) is presented in Fig. 3. A Waveform Chart for acquired signal from the acquisition board, one stop button, one control for sampling time, one indicator of iteration number and one table with acquired data can be noticed. These were selected from Lab VIEW control palette (National Instruments, 2006b).
Fig. 3. The Front Panel of the VI for Data Acquisition; experimental results for the electric air heating battery
Fig. 4. The Block Diagram of the VI for Data Acquisition
The Block Diagram corresponding to the above Front Panel is presented in Fig. 4.
Because the acquisition board was configured to acquire voltage in range of 0-10 V, and the input signal was in range of 2-10 V, a signal processing to result directly the value of proper temperature of the acquisition moment was necessary. This processing was achieved with the help of DAQ Assistant Express VI and some functions available in Lab VIEW function palette. Using Write to Measurement File VI the archiving of data and display data on table was realized. To acquire data with a desired sample a proper configuration of a DAQ Assistant Express VI was realized. All this VIs and functions are placed in a While loop which has its stop button on the Front Panel. By pushing this button the acquisition is stopped.
4.2 The Virtual Instrument achieved for the data processing and calculation of parameters.
This achieved Virtual Instrument had to extract the archived data from a file and processing data so that, finally, the K, T1, T2 and τ parameters could be
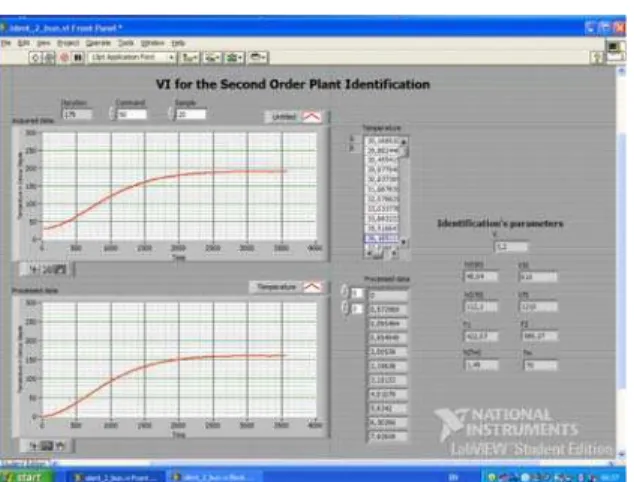
Fig. 5. The Front Panel of the VI for second order process identification; experimental results for the electric air heating battery.
In Fig. 5 the Front Panel for this Virtual Instrument is presented and it can be observed that there are displayed the read data and the processed data, too. The values of h(t30 ), t30, h(t70 ), t70 , h(τ) and τ are
also displayed.
To implement the procedure of the second order process identification a While Loop for data reading part, some LabVIEW functions to compute the y-coordinates of the characteristic points (see Fig 1) and a Sequence Loop for the parameters calculation (Fig.6) was used.
In the While Loop (Fig. 6) the sub VIs for extract data from a specified file and build tables with acquired data can be seen.
Then, in Fig. 7 the sequences for h(τ ), h(t30 ) and
h(t70 ) coordinates and the gain K calculation is
presented.
In Fig. 8, Fig. 9 and Fig. 10 the sequences for τ, t 30
and t70 calculation are presented.
The T1 and T2 parameter calculation sequences are
presented in Fig. 6.
Fig. 6. The Bloc Diagram of the VI for second order process identification.
Fig. 7. The K, h(τ), h(t30) and h(t70) coordinate
calculation.
Fig. 8. The sequence for τ parameter calculation.
Fig. 9. The sequence for t30 parameter calculation.
5. THE EXPERIMENTAL ACHIEVEMENTS The experimental attempts were achieved in the following order:
- All devices presented in Fig. 2 were in normal state of function, fixing zero as the value of the heating current.
- At the considered moment t=0, the step heating current was applied (X% from nominal current value for identified objects: heating battery and electric oven). It was simultaneously set on the data acquisition application.
- After the steady-state value was touched, the data acquisition program and the identification object supply were turned out.
- The acquired data were processed with the aim of obtaining the mathematical model.
In Fig. 3 and Fig. 5 the obtained experimental results are presented for the electric air heating battery, with u(t)=50% (i=4 A) from nominal value.
In Fig. 11 and 12 the obtained experimental results for the electric oven with resistance are presented. In this case u(t)=5.5% and the corresponding heating current is i=1,15 A.
Fig. 11. The Front Panel of the VI for Data Acquisition; experimental results for the electric oven.
Fig. 12. – The Front Panel of the VI for second order process identification; experimental results for the electric oven.
Fig. 13. The experimental step response and the simulated step response for the electric air heating battery.
Fig. 14. The experimental step response and the simulated step response for the electric oven. The experimental identification’s results of the two identified objects lead to the following transfer functions: Gehb (s) for the electric air heating battery
and G eo (s) for the electric oven with resistance.
s 70 e ) s 27 . 586 1 )( s 06 . 422 1 (
2 . 3 )
s ( ehb
G −
+ +
= (6)
s 310
eo e
) s 27 . 1431 1 )( s 4 . 1310 1 (
45 . 32 )
s (
G −
+ +
= (7)
In order to validate the correctness of the obtained results the step responses of both identified processes characterized by transfer functions (6) and (7) was simulated in Matlab development medium (Matlab, 2005). The simulated curves were put over the obtained experimental curves of the two identified processes (Fig. 13 and Fig. 14).
6. CONCLUSIONS
After these achieved researches the following conclusions were obtained:
Niculiţa, P., E. Ceangă and S. Bumbaru (1993). The Automation of Refrigeration Plants. Editura Tehnică, Bucureşti, România.
were compared whit the curves displayed on the conventional recorder devices of the process;
The manual graphical data processing was eliminated in order to obtaining the mathematical model; the identification precision significantly increased;
Olah, I., C. Lupu, L. Mastacan and C.C-tin. Dosoftei (2002). Process Identification and Simulation Using Lookout Development Medium. Bul. Inst. Polit. Iaşi, Tomul XLVIII(LIV), Fsc. 5B, pp. 81-86, Secţia Electrotehnica, Iaşi, România.
All calculations for obtaining the identification parameters were realized automatically;
A reduced identification time and a grown precision resulted;
Olah, I., Nicoleta Ştefania Hulea, O.C. Vornicu and L. Mastacan (2007). Industrial Processes’ Identification Using Virtual Instrumentation.
Conference on Remote Engineering and Virtual International REV2007, 25 – 27 June 2007, Porto, Portugal. Editors Michael E. Auer, J.M. Martins Ferreira. ISBN 978-3-89958-278-9, Austria.
In order to realize identification of the process the conventional equipments existing on the identified process can be used: transducers, command devices, recorders;
In order to identify these two processes only two values (Hăngănuţ, 1971), were used from all the information included in obtained experimental curves. Nevertheless, it can be said, based on the comparison made in Fig. 13 and Fig. 14, that the precision of identification is satisfactory.
iJOE –International Journal of Online Engineering, Vol. 3, No 4 (2007), ISSN 18612121.
The user’s mobility was increased by using a Laptop and USB acquisition boards; this simplifies the identification procedure of the industrial processes.
Penescu, C., G. Ionescu, M. Tertişco and E. Ceangă (1971). Identificarea experimentală a proceselor automatizate. Editura Tehnică, Bucureşti, România.
The research is worth being continued in order to rise the precision of identification. That is why this will
be the object of some further activities. Rohrs, Ch.E., J.L. Melsa and D.G. Schultz (1993).
Linear Control Systems. McGraw-Hill, Inc. New York, St. Louis, San Francisco. Chap. 2 and 4.
REFERENCES
Strejc, V. (1959). Näherungsverfahren für aperiodische Übergangscharakteristiken.
Regelungstechnic, 7, 124-128).
и в, . ., . . у и в and . . Ци и
(1967). Э и и
и и их х и и
х ия.
“Э И ”, К .
Tertişco, M., P. Stoica (1980). Identificarea şi estimarea parametrilor sistemelor. Editura Academiei Republicii Socialiste România, Bucureşti, Romania.
Hăngănuţ, M (1971). Automatica. Editura Didactică
şi Pedagogică, Bucureşti, România.
Tertişco, M., P. Stoica and Th. Popescu (1987).
Identificarea asistată de calculator a sistemelor. Editura Tehnică, Bucureşti, România.
Matlab, Simulink (2005), Identification Toolbox. National Instruments (2006a). NI USB-6009
Acquisition Board.