Profiling of Ligand-Gated Ion Channels at the Level of
Single Cells
Sahil Talwar1, Joseph W. Lynch1,2, Daniel F. Gilbert1,3*
1Queensland Brain Institute, The University of Queensland, Brisbane, Queensland, Australia,2School of Biomedical Sciences, The University of Queensland, Brisbane, Queensland, Australia,3Institute of Medical Biotechnology, Friedrich-Alexander-University Erlangen-Nuremberg, Erlangen, Germany
Abstract
Ion channels are involved in many physiological processes and are attractive targets for therapeutic intervention. Their functional properties vary according to their subunit composition, which in turn varies in a developmental and tissue-specific manner and as a consequence of pathophysiological events. Understanding this diversity requires functional analysis of ion channel properties in large numbers of individual cells. Functional characterisation of ligand-gated channels involves quantitating agonist and drug dose-response relationships using electrophysiological or fluorescence-based techniques. Electrophysiology is limited by low throughput and high-throughput fluorescence-based functional evaluation generally does not enable the characterization of the functional properties of each individual cell. Here we describe a fluorescence-based assay that characterizes functional channel properties at single cell resolution in high throughput mode. It is based on progressive receptor activation and iterative fluorescence imaging and delivers.100 dose-responses in a single well of a 384-well plate, usinga1-3 homomeric andabheteromeric glycine receptor (GlyR) chloride channels as a model system. We applied this assay with transiently transfected HEK293 cells co-expressing halide-sensitive yellow fluorescent protein and different GlyR subunit combinations. Glycine EC50values of different GlyR isoforms were highly
correlated with published electrophysiological data and confirm previously reported pharmacological profiles for the GlyR inhibitors, picrotoxin, strychnine and lindane. We show that inter and intra well variability is low and that clustering of functional phenotypes permits identification of drugs with subunit-specific pharmacological profiles. As this method dramatically improves the efficiency with which ion channel populations can be characterized in the context of cellular heterogeneity, it should facilitate systems-level analysis of ion channel properties in health and disease and the discovery of therapeutics to reverse pathological alterations.
Citation:Talwar S, Lynch JW, Gilbert DF (2013) Fluorescence-Based High-Throughput Functional Profiling of Ligand-Gated Ion Channels at the Level of Single Cells. PLoS ONE 8(3): e58479. doi:10.1371/journal.pone.0058479
Editor:Bernard Attali, Sackler Medical School, Tel Aviv University, Israel
ReceivedOctober 31, 2012;AcceptedFebruary 6, 2013;PublishedMarch 8, 2013
Copyright:ß2013 Talwar et al. This is an open-access article distributed under the terms of the Creative Commons Attribution License, which permits unrestricted use, distribution, and reproduction in any medium, provided the original author and source are credited.
Funding:The project was funded by the National Health and Medical Research Council and the Australian Research Council. Exchange between laboratories was supported by funds from the Central Office for International Affairs at FAU Erlangen, Germany. The funders had no role in study design, data collection and analysis, decision to publish, or preparation of the manuscript.
Competing Interests:The authors have declared that no competing interests exist. * E-mail: [email protected]
Introduction
Ion channels are involved in most physiological and disease processes [1–3] and are considered highly attractive drug targets for therapeutic intervention [4–7]. Their biophysical and phar-macological properties are determined by the combination of subunits, which in the case of ligand-gated channels is often heterogeneous. It can change during development, in a tissue-specific manner or as a consequence of pathophysiological events [8–12]. It is necessary to characterise the properties of ion channels in the context of cellular heterogeneity as a prerequisite to understanding their physiological and pathological roles, and to understand the effects of drugs on them [13,14].
The biophysical and pharmacological properties of ligand-gated ion channels are typically evaluated by analysing activation and inhibition concentration-responses and derived measures, in particular half-maximal activation or inhibition concentration (EC50, IC50), hill coefficient (nH or slope) and dynamic range of
the response. While there are various technologies available that
allow concentration-response experimentation with ion channels, such as flow cytometry [15,16], dynamic mass redistribution [17] or radioactive, non-radioactive and spectroscopic measurements the most commonly applied methods are patch clamp electro-physiology and fluorescence-based functional imaging [7,18–20].
Patch-clamp electrophysiology is referred to as the gold standard of ion channel evaluation as it yields data of unsurpassed spatiotemporal resolution and allows analysis at the level of single cells and even single channels [21,22]. Despite advances in the field of high-throughput electrophysiology, patch-clamp electro-physiology remains labour intensive, requires highly skilled staff and only supports a small number of individual experiments, hence is not readily applicable to large-scale systematic approaches with heterogeneous cell samples and chemical or genetic libraries [5,23].
imple-mented and scaled to high-throughput format, yields robust signals and enables establishment of screening assays with large dynamic range [24] but is limited with regard to single cell-resolution, due to the stochastic average being masked by bulk measurements [25]. Consequently, this technology is inappropriate for functional screening analysis of ion channels in the context of cellular heterogeneity.
To bridge the gap between the limited throughput of patch-clamp electrophysiology and the low resolution of conventional fluorescence-based high-throughput screening techniques, we aimed to establish a method that allows large-scale functional analysis of ion channels at the level of single cells and in high-throughput mode. To this end, we aimed to adapt a YFPI152L
-based protocol for functional analysis of glycine receptor chloride channels (GlyRs) in recombinantly modified HEK293 cells.
YFPI152L, an engineered variant of YFP with greatly enhanced
anion sensitivity, is quenched by small anions and is thus suited to reporting anionic influx into cells [26]. It has proved useful in screening compounds against many chloride channel types [18,24,27].
The GlyR, which is a member of the pentameric Cys-loop ion channel receptor family, mediates inhibitory neurotransmission in the central nervous system. Functional GlyRs are formed from a total of five subunits (a1–a4, b) which assemble either as a
homomeric orabheteromeric channels. Biochemical, biophysical, pharmacological and genetic evidence suggest the majority of glycinergic neurotransmission in adults is mediated by heteromeric
a1b GlyRs although homomeric GlyRs are also expressed in different tissues at varying abundance [10]. However, a homo-meric GlyRs might be more prevalent than previously assumed given thatbsubunit expression has recently been shown to be low in the mouse neocortex, cerebellum and hippocampus [28].
Although GlyRs are not yet targeted by any clinically useful drugs, they have recently emerged as potential therapeutic candidates for neurological disorders including epilepsy [29–31], peripheral inflammatory pain [32], spasticity and hyperekplexia [33]. New drugs that specifically modulate (i.e., inhibit or potentiate) different GlyR isoforms may thus be useful as both therapeutic lead compounds and as pharmacological probes for basic research. In addition GlyRs and other members of the Cys-loop ion channel receptor family have been implicated as neurotoxicity targets for solvents [34] and insecticides [35] and are increasingly acknowledged in the context of cancer [3,36].
In this article, we describe a fluorometric technique that allows automated large-scale concentration-response experimentation with GlyRs in the context of cellular heterogeneity to address the issues encountered in the classical approaches described above. We assessed the quality of the assay by correlating acquired EC50
values to functional characteristics obtained from patch-clamp electrophysiology and evaluated its suitability for operation in high-throughput mode. We further aimed to conduct a case study with the insecticide lindane in pure and mixed cell populations to assess the usability of the employed assaying technique for clustering GlyR phenotype populations and for identification of subunit-specific drugs in heterogeneous cell cultures.
Materials and Methods
Cell Culture
Experiments were performed on HEK293 cells cultured in Dulbecco’s modified Eagle’s medium (DMEM) supplemented with 10% fetal calf serum and 1% penicillin/streptomycin. Approxi-mately 56105cells suspended in 5 mL DMEM were.
plated into 60-mm culture dishes and were transfected when approx. 80% confluent. YFP and GlyR chloride channel subunits were transfected in 1:1 (YFP anda1-3 GlyR homomers) or 2:1:1 ratio (YFP, GlyRa1-3 homo anda1-3bGlyR heteromers) with a total cDNA quantity of 1mg. Cells were transfected using calcium phosphate precipitation transfection technique, as described in Sambrook et al. [37]. Transfection efficiency varies from 20 to 60%. We routinely achieve a correlation of 80 to 90% between cells expressing YFP and cells expressing GlyRs. We have published a detailed comparison of five transient transfection methods employed routinely in the laboratory for this purpose [27].
Molecular Constructs
The humana1,a2 anda3 GlyR plasmid DNAs were subcloned into the pcDNA3.1 plasmid vector and the human b subunit plasmid DNA was subcloned into pIRES2-EGFP plasmid vector. The UniprotKB accession numbers for the DNAs are as follows (with gene name in brackets):a1 (GLRA1): P23415,a2 (GLRA2): P23416,a3 (GLRA3): O75311 andb(GLRB): P48167.
Cell Lines
Hek293 cells (CRL-1573TM) were purchased fromThe American Type Culture Collection(ATCC).
Preparation of Cells for Experiments
Following termination of transfection, cells were trypsinized by adding 0.7 mL of 0.25% trypsin–EDTA solution (Gibco BRL), resuspended into DMEM, and 2.56103cells, suspended in 40mL
DMEM, were plated into each well of a transparent 384-well plate for fluorescence imaging experiments. Cells were used in experiments 24 h later. Individual wells typically contained 56103 cells at the time of the experiment. Approximately 1 h prior to commencement of experiments culture media in 384-well plates were removed by turning the plate upside-down onto a stack of tissue and were left for approximately 30 sec until culture media was entirely removed from the wells. The culture media was replaced by 20mL standard control solution, which contained (in mM) NaCl 140, KCl 5, CaCl2 2, MgCl2 1, HEPES 10, and
glucose 10 (pH 7.4) using NaOH. The NaI test solution was similar in composition to NaCl control solution except the NaCl was replaced by equimolar NaI. For repeated receptor stimulation with increasing agonist concentration NaI test solution was supplemented with 30 mM glycine and serially diluted with NaI test solution to obtain agonist solutions containing 0.1, 0.3, 1, 3, 10, 30, 100, 300, 1000, 3000, 10000 and 30000mM final glycine concentration. For drug screening experiments agonist solutions were supplemented with strychnine (10, 30, 100mM), picrotoxin (10, 100mM) and lindane (10, 100mM) respectively. Drugs were diluted from stocks in agonist solution according to desired final concentrations. The final concentration of applied drugs was adjusted for high-throughput drug screening that is typically conducted at concentrations in the micromolar range [38,39]. Experiments were conducted at room temperature (19–22uC).
Pharmacological Reagents
Imaging Infrastructure
For imaging experiments we have designed an automated fluorescence microscope (Olympus IX51 inverted microscope) equipped with a motorized stage (Prior ProScan II, Prior Scientific Instruments, Cambridge, UK), a CCD camera (CoolSNAP monochrome cf/OL, Olympus) an LC PAL autosampler (CTC Analytics, Zwingen, Switzerland) with 100-mL syringe and a 100-W mercury arc lamp (HBO 103/2, Osram, Germany) for illumination. A suite of LabView 2010 (National Instruments, Ireland) software routines purpose written was used for hardware control, image acquisition, data storage and image analysis [24].
Imaging Experiments
The 384-well plates were placed onto the motorized stage of our in house-built imaging system and cells were imaged with a 106
objective (UPlanFLN, N.A. 0.30, Olympus,Tokyo, Japan). Illumi-nation from a mercury arc lamp, passing through a YFP dichroic mirror (86002V2 JP4 C76444, Olympus), was used to excite YFP fluorescence. Fluorescence was imaged by a CCD and digitized to disk onto a personal computer. The primary resolution of the camera was 139261040 pixels, although images were binned (262), resulting in a resolution of 6966520 pixels.
The maximum image acquisition rate was 1.25 Hz. Solutions containing agonist and drug were pipetted into a 384-well plate and placed onto LC PAL sample holder platform. Liquid handling was performed with the autosampler described above. Solutions were applied to cells at a rate of 0.6 ml/min. The experimental protocol involved imaging each well eleven times: once in 20ml control solution and ten times 5 sec after the injection of 10ml NaI agonist solution containing increasing concentrations of glycine and, when used, constant drug concentrations.
Image Analysis
Images of fluorescent cells were segmented and quantitatively analyzed using a modified version of DetecTIFFHsoftware [40]. In brief, images were segmented using an iterative size and intensity-based thresholding algorithm and the fluorescence signal of identified cells was calculated as the mean of all pixel values within the area of a cell.
Calculation of Concentration-response Relationships
Individual concentration responses were constructed from image series of the same cells exposed to increasing glycine concentrations, resulting in 11-point dose responses for each of the imaged cells. As only those cells near the centre of the well were evaluated each image typically contained 100 to 500 fluorescent cells revealing the same number of agonist concentration responses for each tested well of a 384-well plate. Recorded single cell-derived glycine concentration-response relationships were fitted with the LabView VI nonlinear curve fit.vi. This VI uses the Levenberg-Marquardt algorithm to determine the set of param-eters that best fit the set of input data points (X, Y) as expressed by the nonlinear function:
y~f xð ,aÞ
whereais the set of parameters. The curve model is defined by the following equation:
F i½ ~f((½glycine)½ ,i Fmax,Fmin,EC50,slope)
where F is the fluorescence value corresponding to a particular
glycine concentration, [glycine]; Fmin and Fmax are the
fluores-cence values at highest and lowest agonist concentration, respectively; EC50 is the concentration that elicits half-maximal
activation; and slope is the incline of the sigmoidal curve at half-maximal activation.
Data Filtering
To exclude data recorded from biologically irrelevant objects calculated concentration response characteristics were filtered by the following parameters:
1. Goodness of fit (R2,$0.9), to include curve fits that represent the data points to a high degree.
2. Dynamic range of fluorescence change (DF, 20–100%), to include cells co-expressing both, YFPI152L and GlyRs. The
dynamic range (% fluorescence change) is defined as
DF~ Ffinal=Finit
{1|100
where Fmin and Fmaxare the fluorescence values at highest and
lowest agonist concentration, respectively.
3. Slope of the curve at half-maximal receptor activation (slope, 0.5–5), to include a wide range of physiologically relevant values.
4. Half-maximal concentration of receptor activation (EC50, 0.3–
3000mM), to allow for a large range of experiments with
different cell lines and drugs shifting the EC50towards higher
agonist concentrations.
Filter ranges for enrichment of functional data were determined empirically by biological relevance. If not stated otherwise, averaged EC50values are displayed as median+/2SEM.
Clustering of Functional GlyR Phenotypes in Heterogeneous Cell Cultures
Functional parameters (EC50, slope) of training and test sets
were annotated in Microsoft Excel. The model for phenotype classification was computed by a 10-fold cross-validation of the training set using J48 decision tree algorithm [41] available in WEKA 3.6 software [42]. Predicted phenotypes were saved in *.csv format and displayed with Origin 7G.
Whole-cell Patch-clamp Electrophysiology
Cells were transfected as described above and plated onto glass coverslips in 3 cm culture dishes. Coverslips containing cells were placed in a recording chamber on the stage of an inverted fluorescent microscope and currents were recorded using the whole-cell patch-clamp configuration. Cells were perfused by extracellular solution containing (in mM): 140 NaCl, 5 KCl, 2 CaCl2, 1 MgCl2, 10 HEPES/NaOH and 10 glucose (pH 7.4
adjusted with NaOH). Patch pipettes were fabricated from borosilicate hematocrit tubing (Hirschmann Laborgeraete, Eber-stadt, Germany) and heat polished. Pipettes had a tip resistance of 1–2 MVwhen filled with the intracellular solution consisting of (mM): 145 CsCl, 2 CaCl2, 2 MgCl2, 10 HEPES and 10 EGTA
(pH 7.4 adjusted with CsOH). After establishment of the whole-cell recording configuration, whole-cells were voltage clamped at
Because asubunits can form functional receptors with or withoutbsubunits, it was necessary to confirm that the expressed receptors incorporatedb subunits. As the GlyRbsubunit cDNA was cloned into the pIRES2-EGFP plasmid vector, we used green fluorescent protein fluorescence to identify cells transfected with the GlyR b subunit. The successful incorporation of b subunits into functional heteromeric GlyRs was also confirmed pharmaco-logically by their characteristic reduction in lindane sensitivity as described below.
Statistical Analysis
The statistical significance between two independent experi-mental groups was determined by unpaired Student’s t-test, with p,0.05 representing significance.
Results
We have established a fluorometric, YFPI152L-based screening
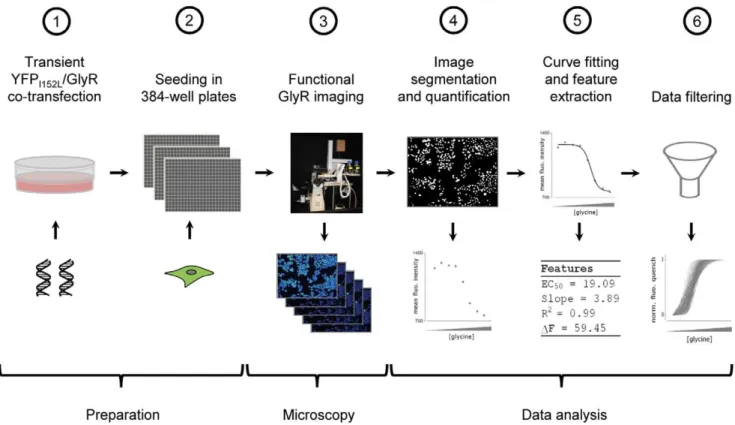
assay for massively parallel functional analysis of GlyRs in individual cells, providing.100 glycine dose-responses in a single experiment. The assaying approach is based on progressive receptor activation by application of increasing agonist concen-tration followed by imaging and quantitative analysis of cellular YFP signal, including image segmentation and quantification, curve fitting and rigorous filtering of parameters derived from dose-responses to discriminate unreliable from physiologically plausible data. The experimental workflow is shown in Fig. 1.
Assay Development
To determine the optimal timing conditions for generating single cell-based concentration responses of GlyRs, we co-transfected HEK293 cells with YFPI152L and a1 GlyR cDNA
and seeded the cells at defined density of 2.56105cells in each well of a 384-well plate. The next day, and approximately 1 h prior to imaging, the culture medium was completely removed and was replaced by 20ml NaCl control solution. The 384-well plate was placed onto the motorized stage of our in house-built imaging system and cells were imaged once in control solution to record cellular YFP fluorescence in unquenched state (see grey dot at time zero in Fig. 2A). As YFPI152Lis almost insensitive to chloride, its
fluorescence intensity is highest in NaCl solution allowing for optimal focussing into the optical layer of cells. Subsequently, cells were perfused with 10ml NaI solution containing progressively increasing concentrations (0.1–300mM) of glycine and were
imaged after the addition of each new glycine concentration by a series of 5 images recorded at 1.5 s intervals. Fig. 2A shows a sample time-resolved single cell recording of fluorescence intensity changes resulting from exposure to the increasing glycine concentrations. Application of low glycine concentrations (0.1– 3mM) resulted in fluorescence quench, followed by decreasing fluorescence quench (grey dots) with a peak at 3 sec (3mM) to
6 sec (0.1mM) past receptor activation (red dots) indicating iodide efflux upon receptor activation possibly due to the newly-created outward anion electrochemical gradient enhancing iodide efflux through other transport pathways. Application of higher glycine concentrations (10–300mM) resulted in fluorescence quench, followed by increasing fluorescence quench, indicating iodide
Figure 1. Work flow of experiment and data analysis.HEK293 cells were transiently co-transfected with YFPI152Land GlyR cDNA (a). Approximately 48 h later, cells were seeded into the wells of 384-well plates at defined density and are cultured for another 24 h (b). Functional analysis of GlyRs is carried out by progressive receptor activation and iterative fluorescence imaging using an in house-built automated screening device with integrated liquid-handling robotics (c). Recorded images are segmented and fluorescence dose-responses calculated (d) are fitted (e). Finally, functional parameters measured in single cells, such as R2,DF, slope and EC50are filtered to discriminate functional from non-functional data (f).
influx via GlyRs into the cell. Red dots indicate time points allowing for largest dynamic range of the concentration response. We recorded fluorescence intensity changes immediately after solution delivery (Fig. 2A, blue dots) for two reasons. First, it avoids possible contamination of concentration-response relationships by other transport pathways, and second, it dramatically speeds up the rate of data acquisition compared to time points indicated by red dots. Fluorescence dose-response data were fitted automati-cally using a Levenberg-Marquardt algorithm provided by the LabView VI nonlinear curve fit.vi. Fitting-derived parameters are often biased by objects such as non-cellular fluorescent matter or by cells that either do not express GlyRs or are washed away during repetitive perfusion. We thus filtered the fitting-derived parameters using four quality criteria: goodness of fit (R2), dynamic range of fluorescence quench (DF), slope of the curve at half-maximal receptor activation (slope, nH) and half-maximal concentration of receptor activation (EC50). The settings for each
parameter are listed above in Methods. Fig. 2B shows filtering statistics calculated from fluorescent objects recognized in 200 wells randomly selected from 10 independent experiments with 20 selected wells per experiment (n = 51469 objects, 5146.961823.8 objects/experiment, 257.3691.2 objects/well). The columns display the mean number of objects (6SD) that were accepted per experiment after filtering by the parameters, EC50
(473161888; 9067%), slope (442261828; 8468%), R2 (417661999 78613%) and DF (36116876; 74614%), respec-tively. When all four parameters were combined, approximately half of all recognized objects were rejected (26146871 objects, 5167%). Fig. 2C represents normalized rejected (black, n = 95) and accepted (grey, n = 186) concentration-response curves calculated from fluorescence signals measured in a randomly selected well (n = 281). The dot-plot in Fig. 2D shows the relation of EC50and slope values. This representation was used throughout
this study as it allowed clear visible discrimination of distinct functional populations. Allowing for rejected objects, the number of recorded concentration-responses per well is high. In average 131641 individual concentration-responses were generated in one well adding up to,10,000 concentration-responses per 384-well
plate with 60–80 wells per plate. To our knowledge, this level of data acquisition from single cells has not previously been achieved in a single experiment, i.e. from a 384-well plate.
Quality Control and Assay Validation
To determine whether this assay could discriminate among different GlyR isoforms we transiently co-transfected HEK293 cells with halide-sensitive YFPI152Land eithera1,a2 ora3 GlyR
cDNA. Fig. 3A displays single cell-derived EC50and slope values
fora1,a2 anda3 GlyRs recorded in individual wells as described above. Averaged EC50values (inmM) are as follows:a1 (10.160.4,
n = 147), a2 (4962, n = 114) and a3 (186617, n = 212). Slope values range between 0.47–1.92 (1.1960.03), 0.51–4.73 (2.9260.09) and 0.39–3.43 (0.9160.03) fora1,a2 anda3 GlyRs, respectively. Averaged and normalized dose-responses from the experiment depicted in panel A are shown in Fig. 2B.
To evaluate how our method compares to whole cell patch-clamp electrophysiology, we correlated averaged EC50values from
the data shown in Fig. 3A with values previously measured in our lab (Fig. 3C). Regression analysis (dashed line) revealed excellent correlation with data from whole-cell patch-clamp electrophysiol-ogy (R2= 0.99). Thus, our fluorescence-based method for physi-ological profiling of GlyR subtypes compares well with patch-clamp electrophysiology.
To assess inter-well reproducibility we recorded concentration-response relations from 64 wells of a 384-well plate containing cells
co-expressing YFPI152Landa2bGlyR heteromers. Fig. 3D shows
a box-plot of glycine EC50measured in single wells from a total of
6514 cells (102635 cells/well). The mean single well-derived EC50
values as indicated by black line in displayed boxes vary between 10 and 30mM glycine. The overall low inter-well variability indicates the assay is suited for high-throughput screening.
To test whether our assay is applicable to identification of drugs that specifically modulate homomeric or heteromeric GlyRs, we exposed cells co-expressing YFPI152Land a1 ora1breceptors to
strychnine or lindane while performing the glycine dose-response protocol as described above. Fig. 3E shows averaged glycine EC50
values of HEK293 cells expressinga1 ora1bGlyRs measured in single wells and exposed to control solution (a1:9.860.5, n = 197;
a1b: 7.862.3, n = 149) as well as to solution containing 10mM
lindane or 30mM strychnine, respectively. As expected for a
classical competitive antagonist that does not discriminate amongst GlyR subtypes [43], strychnine dramatically increased the glycine EC50values of both receptors (a1:346626, n = 186;a1b121615,
n = 205) (Fig. 3E). Lindane has previously been shown in electrophysiological studies to inhibit a1 but not a1b GlyRs [35]. Our fluorescence assay likewise demonstrates lindane antagonism of a1 but not a1b GlyRs (a1:26.461.6, n = 156;
a1b 8.160.6, n = 128) (Fig. 3E) thus validating our assay for identification and characterization of GlyR subtype-specific drugs. Note that the strychnine sensitivity as determined here is lower than has previously been determined by electrophysiology or radioligand binding assays [10]. Because glycine accesses its receptor site quickly and strychnine access its site slowly, in co-application experiments as employed here, the YFP will be quenched (signalling full activation) before strychnine has had time to inhibit the receptors. Hence, super-saturating strychnine concentrations are required to enable it to bind rapidly enough to antagonise glycine activation.
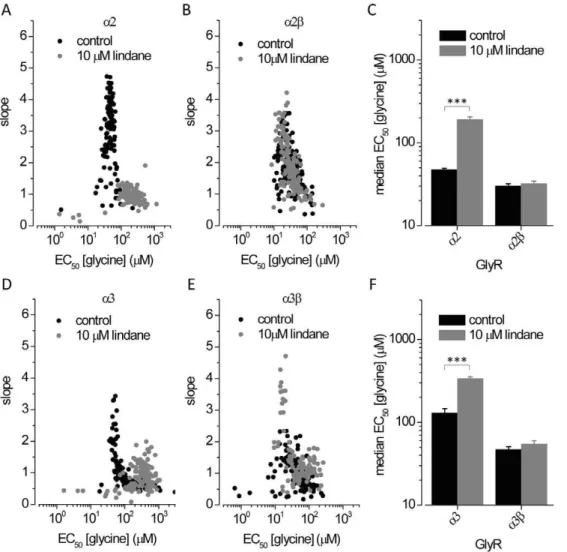
Case Study: Mode of Action of Lindane at Heteromeric a2banda3bGlyRs
It has recently been reported that the neurotoxic insecticide lindane (c-hexachlorocyclohexane) selectively inhibits homomeric
a1, a2 and a3 GlyRs but not heteromeric a1b channels [35] rendering the molecule an excellent pharmacological tool for identifying the presence of b subunits in functional GlyRs. However, its effects on a2b and a3b GlyRs has not been investigated. Cells expressing YFPI152Land a2,a2b, a3 or a3b
GlyRs were investigated in control NaI solution in the presence of NaI solution plus 10mM lindane. Fig. 4 shows dot-plots of EC50
and slope values obtained from glycine dose-response recordings ona2 anda2bGlyRs (upper panels) and ona3 anda3bGlyRs (lower panels) in both the absence and presence of 10mM lindane. Under control conditions average half-maximala2 anda2bGlyR activation was observed at 4762 (n = 114) and 3062 (n = 166)mM glycine, respectively (Fig. 4C). Exposure to 10mM lindane results in inhibition of homo but not heteromeric receptors (a2:190615, n = 106;a2b3262.5, n = 155). Similar results were obtained with cells expressinga3 homo and a3b heteromeric GlyRs (Fig. 4F). Under control conditions median half-maximala3 anda3bGlyR activation was observed at 130617 (n = 212) and 46.864.0 (n = 122) mM glycine, respectively. Exposure to 10mM lindane results in inhibition of homo but not heteromeric receptors (a3:337618, n = 138;a3b5565, n = 106). These results confirm lindane as a pharmacological tool for identifying the presence ofb
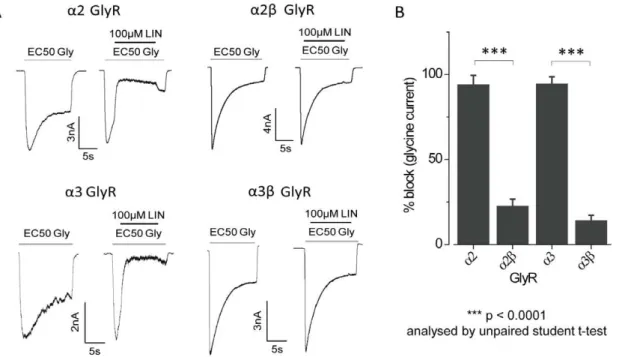
Effect of Lindane ata2banda3bGlyRs Assessed by Patch-clamp
The effects of lindane were also investigated ona2,a2b,a3 or
a3bGlyRs using the whole-cell patch-clamp technique. As shown in the sample recordings in Fig. 5A, the effects of 100mM lindane were investigated on currents activated by EC50glycine in each of
the four receptor types. Averaged results, presented in Fig. 5B, indicate lindane potently inhibiteda2 anda3 GlyRs but had no significant effect ona2banda3bGlyRs (% block,a2:9465,a2b: 2364,a3:9664,a3b: 1463). This validates the results obtained using our novel fluorescence-based assay.
Functional Phenotyping of GlyRs in Heterogeneous Cell Populations
For the sake of feasibility and throughput, conventional fluorescence-based ion channel-targeted drug screening is typically conducted in recombinant cell lines that express a single ion channel. The same is true for screening approaches targeting a specific ion channel subunit. Although multiplexing of various readout measures, e.g. different fluorescence indicators, is often applied this methodology is not applicable to parallel functional analysis of multiple subunits of the same receptor as the identical indicator is required for functional imaging of different subunits. Hence, when a large number of individual subunits are to be analysed, each isoform requires individual evaluation in serial
Figure 2. Development of the assay for single cell-based functional imaging. A.Determination of optimal assay conditions. HEK293 cells YFPI152Landa1 GlyRs were seeded into 384-well plates. The culture medium was replaced by 20ml control NaCl solution and cells were imaged once to record cellular fluorescence in unquenched state (grey dot at 0mM glycine). This step was conducted to optimise auto-focussing and detection of fluorescent objects in recorded fluomicrographs. Cells were perfused with NaI solution containing indicated lycine concentrations, whereupon a series of 5 images was recorded every 1.5 s. The lowest and highest fluorescence intensity, recorded in the first and fourth/fifth image is colored blue and red, respectively, with the intensities in intermediate images colored grey.B.Data filtering. Images of fluorescent cells always contained a substantial amount of debris (e.g. dead cells, cells expressing YFPI152Lbut not GlyRs or cells detaching during perfusion). To discriminate functionally relevant fluorescence signals from artefactual data, dose responses were filtered after automatic curve fitting. The histogram shows the average number (mean6SD) of objects per image, averaged from 10 experiments, with 20 randomly selected wells per experiment before (black, cells & debris) and after filtering (striped, mainly cells) using either of the parameters EC50, slope (nH), R2andDF as described in Methods. To achieve a maximal number of unbiased concentration responses all four parameters were combined for filtering (grey), resulting in approx. 50% of data points considered acceptable.C.Representation of normalized concentration-responses measured in a single well after filtering. In this example a total of 186 (grey) and 95 (black) cells were accepted and rejected, respectively.D.Scatter plot of EC50and slope values derived from curves shown in panel C. ***P,0.0001 relative to untreated control, unpaired t-test.
mode that is time and cost intensive. To demonstrate the versatility of our assaying technique for parallel functional analysis of multiple GlyR subunits in heterogeneous cell cultures we applied the assay with pure and mixed recombinant cell lines and the GlyR inhibitors strychnine, picrotoxin and lindane. HEK293 cells were transiently co-transfected with halide-sensitive YFPI152L as
well as witha2 anda2bglycine receptor chloride channel cDNA and were seeded into 64 wells (868 wells) of a 384-well plate in the
following pattern. A mixture ofa2 anda2bGlyR expressing cells (1:1 ratio) was seeded into columns 1–5 and 8. Columns 6 and 7 were supplemented with cells expressing a2 and a2b GlyRs, respectively. The agonist solutions were supplemented with strychnine, picrotoxin and lindane, each at 10 and 100mM
concentration and cells were used for functional screening as shown in Fig. 1. Fig. 6A shows a color map of median glycine EC50 (in mM) with cold and warm colors representing low and
high values, respectively. The color coding indicates inhibition of
a2 homomeric GlyRs by all drugs as well as a2b heteromeric GlyRs by strychnine but no inhibition ofa2bheteromeric GlyRs
by picrotoxin and lindane, validating previous data obtained using the assay as well as from the literature [43]. A dot-plot of glycine EC50and slope values measured in presence of 10 and 100mM
lindane in pure (a2, blue;a2b, orange) and mixed (a2+a2b, green, 1:1 ratio) cell populations from the experiment in A is shown in Fig. 6B. For clustering of functional GlyR phenotypes in pure and heterogeneous cultures we used the functional profiles of lindane-exposed cells expressinga2 anda2bGlyRs and trained a classifier using a set of 402 cells with 136 cells for classa2 and 267 cells for classa2b A 10-fold cross-validation on the training set revealed 97.8% (a2:132 [97.8%)]; a2b: 3 [2.2%] cells) and 91% (a2:24 [8.9%];a2b: 243 [91.1%] cells) accuracy fora2 anda2b GlyR expressing cells, respectively. Cluster analysis using the model from cross-validation revealed 53 (57.6%) and 39 (42.3%) cells classified
a2 anda2b, respectively. The bars in the histogram in Fig. 6C represent the percentage of cells assigned to either of the two classes and reflect the initial 1:1 mixing ratio. The proportion of cells classified a2 in populations enclosinga2b GlyR is overall higher compared to the fraction of cells predicteda2bin cultures
expressinga2 GlyR. These data suggest heterogeneous expression of a2 and a2b GlyRs in cell cultures transfected witha2 andb
GlyR cDNA but were not further evaluated. Our results extend the applicability of the assay to functional phenotyping of GlyRs in heterogeneous cell cultures for identification of subtype-specific drugs and verify its suitability as a versatile platform for cell-based ion channel-targeted drug screening.
Discussion
Large-scale analysis of ion channel function and systematic screening for subunit-specific drugs is hampered by the limitations of conventional assaying techniques. Despite available automated platforms, high-resolution patch-clamp electrophysiology is still limited in throughput compared to, e.g. fluorometric approaches that allow experimentation in high-throughput mode but that are low in resolution. For the sake of feasibility, throughput and cost reasons, large-scale functional analysis and ion channel-targeted drug screening are initially conducted in high-throughput mode using fluorometric approaches and identified candidates are subsequently analysed in more detail in secondary assays using
either fluorescence-based or electrophysiological techniques. The initial benefit is often compromised by subsequent time-consuming and cost-intensive re-screens for confirmation of candidates and detailed characterization. To address this issue, we have developed an assay for functional profiling of ligand-gated ion channels, in particular GlyRs in single cells that is cost-effective, reliable and that is advantageous for several reasons. First, this assay is high-throughput compatible, thus allowing for efficient and thorough screening. Second, the approach makes use of little and cost-effective reagents, circumventing the need for expensive plastic ware and reagents, such as loadable fluorescence indicators. Third, this assay reveals a high number of single cell derived dose-responses and associated characteristics, such as EC50, slope (nH)
and dynamic range of concentration response that allow large-scale analysis of ion channel function and systematic screening for subunit-specific drugs in pure and heterogeneous cell cultures.
We applied the assay with homomerica1,a2 anda3 GlyRs and observed excellent correlation to EC50 values from patch-clamp
electrophysiology, the gold standard in ion channel research, demonstrating the high level of accuracy of the assay and its suitability for assessing functional characteristics in single cells.
Figure 4. Effects of the lindane ona2,a3,a2banda3bGlyRs as determined by fluorescence assay. A, B, D, E.Dot plots of glycine EC50 and slope values in absence (black) and presence (grey) of 10mM lindane measured in single cells expressinga2 anda2b(A–B) anda3 anda3b(D–E) GlyR.C, F.Histogram of median glycine EC50(6SD) calculated from data shown in panels A, B (C) and D,E (F). These results provide evidence for lindane as a pharmacological tool for identifying the presence ofbsubunits ina2banda3bheteromeric GlyRs. ***P,0.0001 relative to untreated control, unpaired t-test.
Despite the fact that a large proportion (,50%) of all raw data
generated using the assay were rejected there are still .100 individual dose-responses measured in a single experiment, i.e. well of a 384-well plate. At given conditions imaging of a single agonist concentration, including liquid-handling and image acquisition requires approx. 22 s per well. A complete imaging cycle for generating an eight to ten-point concentration-response,
including auto-focus procedure and acquisition of control image adds up to a cumulative duration of 3.6–4.3 min per well allowing for screening analysis of 60–80 wells per 384-well plate. In this configuration up to 10,000 dose-responses are measured per 384-well plate resulting in,30,000 dose-responses per day with three
384-well plates per day. Measurement of a single dose response using the conventional fluorescence-based approach and our in
Figure 5. Effects of the lindane ona2,a3,a2banda3bGlyRs as determined by patch-clamp.A. Examples of currents activated by EC50 glycine concentrations in HEK293 cells expressing the indicated GlyR subunits. Examples of the effects of 100mM lindane on each GlyR isoform are also shown. B. Mean percentage (6SD) of EC50glycine current blocked by 100mM lindane. All results were averaged from 4–7 cells. ***p,0.0001 analysed by unpaired t-test.
doi:10.1371/journal.pone.0058479.g005
Figure 6. Clustering functional GlyR phenotypes in pure and heterogeneous cell populations. A.Color map of mean glycine EC50(mM) in presence and absence of the drugs strychnine, picrotoxin and lindane, as indicated. Warm and cold colors represent low and high EC50values indicating no effect and inhibition, respectively. The black rectangle highlights experiments shown in B and C.B.Dot plot of glycine EC50and slope values measured in presence of 10 and 100mM lindane in pooled pure (a2, blue;a2b, orange) and mixed (a2+a2bgreen, 1:1 ratio) cell populations from the experiment in A. Values measured in pure populations were used for training a J48 decision tree classification algorithm.C.Functional phenotyping of lindane-exposed GlyRs in pure (a2, blue;a2b, orange) and mixed (a2+a2bgreen) cell populations. Cells were classified according to their descriptors with a training set of 402 cells distributed in 2 classes:a2 (black),a2b(grey). Bars represent the percentage of cells assigned to either of the two classes and reflect the initial 1:1 mixing ratio (green).
house-built imaging system takes about 15 min suggesting an approx. 500-fold increased throughput for the novel assaying technique presumably outranging any other existing technique for assessing physiological properties of ion channels and highlighting the advantage of our approach over conventional fluorescence-based and electrophysiological methods.
We evaluated the quality of the assay to assess its suitability for high-throughput screening and observed robust operation and small inter-well variation implying its usability for high-throughput screening. Despite these results we were not able to use the full potential of the assay, e.g. for screening analysis of a complete 384-well plate due to limitations of our custom-designed hardware restricting the throughput to approx. 80 wells of a 384-well multititer plate. All experiments were conducted in extracellular solution at room temperature. Under these conditions and from our experience cells can be used in experiments for four to five hours limiting the time window for functional imaging. Imple-mentation of infrastructure controlling environmental conditions, such as temperature and atmosphere allowing for long-term life-cell imaging would help to increase throughput and efficiency of the assay. Furthermore, iterative and sequential delivery of assay reagents using our in house-built imaging system is time-consuming and limits the applicability of the assay to non-desensitizing ion channels. Implementation of, e.g. microfluidic devices permitting rapid solution exchange [20,44–46] or usage of caged agonists and flash-photolysis [47,48] enabling concentration changes with fast kinetics could shorten cumulative imaging time, thus increasing throughput and extending the applicability of the assay to other types of ion channels.
We applied the assay in small-scale screening experiments with the drugs strychnine, picrotoxin and lindane and confirmed previously reported pharmacological profiles. Both picrotoxin and lindane have been reported to potently inhibit homomeric a2 GlyRs at the concentrations employed here [49,35]. However, the color map in Fig. 6 A indicates overall less block of homomerica2 GlyRs by picrotoxin compared to lindane. The two drugs produce inhibition by different mechanisms. Picrotoxin inhibitory potency is reduced as glycine concentration is increased [50]. In contrast, lindane inhibitory potency is not affected by glycine concentration [35]. In Fig. 6 we measured glycine EC50values in the presence of
fixed concentrations of each drug. As glycine should not easily be able to overcome non-competitive lindane inhibition, an extremely high glycine EC50will be observed in the presence of lindane. In
contrast, glycine should be more easily able to overcome picrotoxin inhibition, a more modest glycine EC50 increase is
expected in the presence of picrotoxin. Our findings on the toxicity profiles of lindane ata2banda3bGlyRs were validated by patch-clamp electrophysiology. These results demonstrate the accuracy of the assaying technique and its applicability to ion channel-targeted drug screening. Despite the fact that we applied the assay with drugs inhibiting GlyR it is equally applicable for identification of channel activators and potentiators.
To demonstrate the versatility of the method as a general platform for drug screening in heterogeneous cell cultures we applied our assay with lindane-exposed pure and mixed cell populations. The initial 1:1 mixing ratio was reflected by cluster analysis. Remarkably, the proportion of cells classified a2 in populations includinga2bGlyR was overall higher compared to the fraction of cells predicteda2bin cultures expressinga2 GlyR. These data suggest heterogeneous expression ofa2 anda2bGlyRs in cell cultures transfected witha2 andbGlyR cDNA and validate observations from electrophysiology. Whenbcontaining GlyR are to be analysed by whole-cell patch-clamping is always necessary to confirm that the expressed receptors incorporatedbsubunits, e.g.
by using a fluorescent protein cloned into thebsubunit-encoding plasmid vector. While the assaying technique was initially applied for identification of subunit-specific drugs in mixed cell popula-tions it provided additional information on heterogeneous GlyR expression, extending its applicability to functional analysis, that could be used e.g. for optimizing the expression of ion channels in recombinant systems or for creating comprehensive, large-scale and even time-resolved functional expression profiles of ion channels in cultures of primary or stem cells that are typically assessed in small-scale approaches using conventional methods. Single-endpoint or time-resolved expression profiles could be integrated with data from ‘omics’ approaches and help to gain a systems-level understanding of human physiology in maintenance and disease.
In the present example the heterogeneous culture was established from a known and small number of subpopulations and the applied analytical strategy using EC50and slope values for
prediction of classes has proven to be sufficient for clustering functional phenotypes. When more complex heterogeneous cell cultures, that consist of an unknown number of subpopulations, or mixed cell populations created from multiple cell lines are to be screened, more sophisticated analytical methods can be employed for interpretation of screening results. In this case additional single cell-derived functional characteristics, such as the dynamic range of the concentration response or even non-functional, e.g. morphological descriptors could be included for multiparametric analysis [51–53].
Our method uses a single indicator for functional characterisa-tion allowing addicharacterisa-tional fluorescence or luminescence-based indicators to be implemented for multiplexing, e.g. for parallel analysis of further ion channels, to assess the activity of signalling pathways or for mapping cellular morphology to functional phenotypes. The combination of different assaying methods in the same experiment adds a level of efficiency by reducing sample supply, reducing cell culture and assay consumable requirements and eliminating redundant steps for sample preparation, plate replication, and assay execution.
Author Contributions
Designed the software used in analysis: DFG. Conceived and designed the experiments: DFG JWL. Performed the experiments: DFG ST. Analyzed the data: DFG ST. Wrote the paper: DFG JWL ST.
References
1. Raiteri M (2006) Functional pharmacology in human brain. Pharmacol Rev. 58(2): 162–93.
2. Winsky-Sommerer R (2009) Role of GABAA receptors in the physiology and pharmacology of sleep. Eur J Neurosci. 29(9): 1779–94.
3. Becchetti A (2011) Ion channels and transporters in cancer. 1. Ion channels and cell proliferation in cancer. Am J Physiol Cell Physiol. 301(2): C255–65. 4. Overington JP, Al-Lazikani B, Hopkins AL (2006) How many drug targets are
there? Nat Rev Drug Discov. 5(12): 993–6.
5. Dunlop J, Bowlby M, Peri R, Vasilyev D, Arias R (2008) High-throughput electrophysiology: an emerging paradigm for ion-channel screening and physiology. Nat Rev Drug Discov. 7(4): 358–68.
6. Grigoriadis DE, Hoare SR, Lechner SM, Slee DH, Williams JA (2009) Drugability of extracellular targets: discovery of small molecule drugs targeting allosteric, functional, and subunit-selective sites on GPCRs and ion channels. Neuropsychopharmacology. 34(1): 106–25.
7. Wickenden A, Priest B, Erdemli G (2012) Ion channel drug discovery: challenges and future directions. Future Med Chem. 4(5): 661–79.
8. Gotti C, Moretti M, Gaimarri A, Zanardi A, Clementi F et al. (2007) Heterogeneity and complexity of native brain nicotinic receptors. Biochem Pharmacol. 74(8): 1102–11.
9. Paoletti P, Neyton J (2007) NMDA receptor subunits: function and pharmacology. Curr Opin Pharmacol. 7(1): 39–47.
10. Lynch JW (2009) Native glycine receptor subtypes and their physiological roles. Neuropharmacology. 56(1): 303–9.
11. Esmaeili A, Zaker SR (2011) Differential expression of glycine receptor subunit messenger RNA in the rat following spinal cord injury. Spinal Cord 49(2): 280– 4.
12. Nakagawa T (2010) The biochemistry, ultrastructure, and subunit assembly mechanism of AMPA receptors. Mol Neurobiol. 42(3): 161–84.
13. Wang D, Bodovitz S (2010) Single cell analysis: the new frontier in ‘omics’. Trends Biotechnol. 28(6): 281–90.
14. Hoggatt J, Scadden DT (2012) The stem cell niche: tissue physiology at a single cell level. J Clin Invest. 122(9): 3029–34.
15. Gilbert DF, Wilson JC, Nink V, Lynch JW, Osborne GW (2009) Multiplexed labeling of viable cells for high-throughput analysis of glycine receptor function using flow cytometry. Cytometry A.
16. Robinson JP, Patsekin V, Holdman C, Ragheb K, Sturgis J et al. (2012) High-Throughput Secondary Screening at the Single-Cell Level. J Lab Autom. 17. Schro¨der R, Schmidt J, Bla¨ttermann S, Peters L, Janssen N et al. (2011).
Applying label-free dynamic mass redistribution technology to frame signaling of G protein-coupled receptors noninvasively in living cells. Nat Protoc. 6(11): 1748–60.
18. Gilbert DF, Islam R, Lynagh T, Lynch JW, Webb TI (2009) High Throughput Techniques for Discovering New Glycine Receptor Modulators and their Binding Sites. Front Mol Neurosci. 2: 17.
19. Terstappen GC, Roncarati R, Dunlop J, Peri R (2010) Screening technologies for ion channel drug discovery. Future Med Chem. 2(5): 715–30.
20. Spencer CI, Li N, Chen Q, Johnson J, Nevill T et al. (2012) Ion channel pharmacology under flow: automation via well-plate microfluidics. Assay Drug Dev Technol. 10(4): 313–24.
21. Neher E, Sakmann B (1976) Single-channel currents recorded from membrane of denervated frog muscle fibres. Nature. 260(5554): 799–802.
22. Hamill OP, Marty A, Neher E, Sakmann B, Sigworth FJ (1981) Improved patch-clamp techniques for high-resolution current recording from cells and cell-free membrane patches. Pflugers Arch. 391(2): 85–100.
23. Stoelzle S, Obergrussberger A, Bru¨ggemann A, Haarmann C, George M et al. (2011) State-of-the-Art Automated Patch Clamp Devices: Heat Activation, Action Potentials, and High Throughput in Ion Channel Screening. Front Pharmacol. 2: 76.
24. Kruger W, Gilbert D, Hawthorne R, Hryciw DH, Frings S et al. (2005) A yellow fluorescent protein-based assay for high-throughput screening of glycine and GABAA receptor chloride channels. Neurosci Lett. 380(3): 340–5.
25. McManus OB, Garcia ML, Weaver D, Bryant M, Titus S et al. (2004) Ion Channel Screening. In: Sittampalam GS, Gal-Edd N, Arkin M, Auld D, Austin C et al. editors. Assay Guidance Manual [Internet]. Bethesda (MD): Eli Lilly & Company and the National Center for Advancing Translational Sciences 26. Galietta LJ, Haggie PM, Verkman AS (2001) Green fluorescent proteinbased
halide indicators with improved chloride and iodide affinities, FEBS Lett. 499: 220–224.
27. Gilbert D, Esmaeili A, Lynch JW (2009) Optimizing the expression of recombinant alphabetagamma GABAA receptors in HEK293 cells for high-throughput screening. J Biomol Screen. 14(1): 86–91
28. Weltzien F, Puller C, O’Sullivan GA, Paarmann I, Betz H (2012) Distribution of the glycine receptor b-subunit in the mouse CNS as revealed by a novel monoclonal antibody. J Comp Neurol. 520(17): 3962–81.
29. Eichler SA, Kirischuk S, Ju¨ttner R, Schaefermeier PK, Legendre P et al. (2008) Glycinergic tonic inhibition of hippocampal neurons with depolarizing GABAergic transmission elicits histopathological signs of temporal lobe epilepsy. J Cell Mol Med.
30. Eichler SA, Fo¨rstera B, Smolinsky B, Ju¨ttner R, Lehmann TN et al. (2009) Splice-specific roles of glycine receptor alpha3 in the hippocampus. Eur J Neurosci. 30(6): 1077–91.
31. Legendre P, Fo¨rstera B, Ju¨ttner R, Meier JC (2009) Glycine Receptors Caught between Genome and Proteome - Functional Implications of RNA Editing and Splicing. Front Mol Neurosci. 2: 23.
32. Harvey RJ, Depner UB, Wa¨ssle H, Ahmadi S, Heindl C et al. (2004) GlyR alpha3: an essential target for spinal PGE2-mediated inflammatory pain sensitization. Science 304(5672): 884–7.
33. Chung SK, Vanbellinghen JF, Mullins JG, Robinson A, Hantke J et al. (2010) Pathophysiological mechanisms of dominant and recessive GLRA1 mutations in hyperekplexia. J Neurosci. 30(28): 9612–20.
34. van Thriel C, Westerink RH, Beste C, Bale AS, Lein PJ et al. (2012) Translating neurobehavioural endpoints of developmental neurotoxicity tests into in vitro assays and readouts. Neurotoxicology. 33(4): 911–24.
35. Islam R, Lynch JW (2012) Mechanism of action of the insecticides, lindane and fipronil, on glycine receptor chloride channels. Br J Pharmacol. 165(8): 2707–20. 36. Neumann SB, Seitz R, Gorzella A, Heister A, Doeberitz MK et al. (2004) Relaxation of glycine receptor and onconeural gene transcription control in NRSF deficient small cell lung cancer cell lines. Brain Res Mol Brain Res. 120(2): 173–81.
37. Sambrook J, Russell DW (2006) Calcium-phosphate-mediated Transfection of Eukaryotic Cells with Plasmid DNAs. CSH Protoc. (1).
38. Mola MG, Nicchia GP, Svelto M, Spray DC, Frigeri A (2009) Automated cell-based assay for screening of aquaporin inhibitors. Anal Chem. 81(19): 8219–29. 39. Giddings AM, Maitra R (2010) A disease-relevant high-content screening assay to identify anti-inflammatory compounds for use in cystic fibrosis. J Biomol Screen. 15(10): 1204–10.
40. Gilbert DF, Meinhof T, Pepperkok R, Runz H (2009) DetecTiff: a novel image analysis routine for high-content screening microscopy. J Biomol Screen. 14(8): 944–55.
41. Quinlan R (1993). C4.5: Programs for Machine Learning. Morgan Kaufmann Publishers, San Mateo, CA.
42. Hall M, Frank E, Holmes G, Pfahringer B, Reutemann P et al. (2009); The WEKA Data Mining Software: An Update; SIGKDD Explorations, Volume 11, Issue 1.
43. Webb TI, Lynch JW (2007) Molecular pharmacology of the glycine receptor chloride channel. Curr Pharm Des. 13(23): 2350–67.
44. Kim MJ, Lee SC, Pal S, Han E, Song JM (2011) High-content screening of drug-induced cardiotoxicity using quantitative single cell imaging cytometry on microfluidic device. Lab Chip. 11(1): 104–14.
45. Neuzˇi P, Giselbrecht S, La¨nge K, Huang TJ, Manz A (2012) Revisiting lab-on-a-chip technology for drug discovery. Nat Rev Drug Discov. 11(8): 620–32. 46. Chen CY, Wo AM, Jong DS (2012) A microfluidic concentration generator for
dose-response assays on ion channel pharmacology. Lab Chip. 12(4): 794–801. 47. Gilbert D, Funk K, Dekowski B, Lechler R, Keller S et al. (2007) Caged capsaicins: New tools for the examination of TRPV1 channels in somatosensory neurons. Chembiochem. 8(1): 89–97.
48. Fan L, Lewis RW, Hess GP, Ganem B (2009) A new synthesis of caged GABA compounds for studying GABAA receptors. Bioorg Med Chem Lett. 19(14): 3932–3.
49. Pribilla I, Takagi T, Langosch D, Bormann J, Betz H (1992) The atypical M2 segment of the beta subunit confers picrotoxinin resistance to inhibitory glycine receptor channels. EMBO J. 11(12): 4305–11.
50. Lynch JW, Rajendra S, Barry PH, Schofield PR (1995) Mutations affecting the glycine receptor agonist transduction mechanism convert the competitive antagonist,picrotoxin, into an allosteric potentiator. J Biol Chem. 270(23): 13799–806.
51. Fuchs F, Pau G, Kranz D, Sklyar O, Budjan C et al. (2010) Clustering phenotype populations by genome-wide RNAi and multiparametric imaging. Mol Syst Biol. 6: 370.
52. Ku¨mmel A, Selzer P, Beibel M, Gubler H, Parker CN et al. (2011) Comparison of multivariate data analysis strategies for high-content screening. J Biomol Screen. 16(3): 338–47.