8 Crop Breeding and Applied Biotechnology 12: 8-16, 2012 VA Pontes Júnior et al.
Crop Breeding and Applied Biotechnology 12: 8-16, 2012 Brazilian Society of Plant Breeding. Printed in Brazil
Received 11 August 2010
Accepted 12 May 2011
Productive potential and interaction of elite bean lines with
environments in the Central Cerrado of Brazil
ARTICLE
Vilmar de Araújo Pontes Júnior1, Leonardo Cunha Melo2*, Helton Santos Pereira2, Maria José Del Peloso2, Luís Cláudio de Faria2, Adriane Wendland2, Antônio Joaquim Braga Pereira Braz3 and Simone Borges Ferreira4
Abstract - The search for more productive varieties of beans, with lower production cost and adaptable to most technological conditions has been intensified. The objective of this study was, therefore, to evaluate the stability and adaptability of common bean lines of the carioca group in the final evaluation network in the Central Cerrado of Brazil, in 2005 and 2006. Twelve lines and four cultivars were evaluated in 23 environments. A completely randomized block design was used with three replications, with plots of four rows of four meters. Grain yield data were subjected to analysis of variance, stability and of adaptability by the methodologies of Lin and Binns, Annichiarico and visual assessment, respectively. The most stable and promising lines for recommendation as new cultivars were CNFC 10429, CNFC 10431 and CNFC 10408.
Key words: Phaseolus vulgaris L., genetic improvement, genotype-environment interaction.
1 Universidade Federal de Goiás, Rod. GO-462, km 0, C. P. 131, 74.690-900, Goiânia, GO, Brazil
2 Embrapa Arroz e Feijão, Rod. GO-462, km 12, Zona Rural, C. P. 179, 75.375-000, Santo Antônio de Goiás, GO, Brazil. *E-mail: [email protected]
3 Universidade de Rio Verde (FESURV), C. P. 104, 75.901-970, Rio Verde, GO, Brazil
4 Agência Goiana de Assistência Técnica, Extensão Rural e Pesquisa Agropecuária (EMATER), Rua 227A, n. 331, Setor Leste Universitário, 74.610-060, Goiânia, GO, Brazil
INTRODUCTION
Brazil is the world’s largest producer of common bean (Phaseolus vulgaris L.), with an output of 2.84 million tons, and the State of Goiás and the Distrito Federal rank fifth nationally, accounting for about 10 % of the country’s production (Feijão 2010). In spite of the impressive increase in average yield of this crop in the last years (from 421 kg ha-1 in 1987 to 1.135 kg ha-1 in 2007), this productivity is still low in view of the yield potential of the cultivars available. Among the Brazilian states, Goiás and the Distrito Federal present
Studies on GE interaction, although they are very important for improvement, provide no detailed information on the performance of each genotype in relation to environmental variations (Cruz and Regazzi 2001). Thus, it is helpful to estimate the stability (response to interaction with the environment) and adaptability (production potential) of elite lines with a view to the identification of genotypes with predictable behavior and responsive to environmental variations. The stability and effect of the GE interaction on phenotypic performance of common bean were the focus of several studies in the South (Dalla Corte et al. 2002, Melo et al. 2007, Pereira et al. 2009c) and in the Central region of Brazil (Carbonell et al. 2004, Oliveira et al. 2006, Pereira et al. 2009b, 2010).
The identification of cultivars with greater phenotypic stability is an alternative to reduce the undesirable effects of GE interaction and to exploit this interaction in cultivars for planting, with a view to raise productivity levels and to make the process of cultivar recommendation safer. There is a number of methods for this purpose, each one with its advantages and disadvantages, detailed by Cruz and Regazzi (2001) and Cruz and Carneiro (2006). One of the most used methods for common bean is the one proposed by Lin and Binns (1988), which defines the phenotypic performance as a measure to estimate the mean square of the distance between the mean and maximum response of the cultivar to all environments. This method was adapted by Carneiro (Cruz and Carneiro 2006), in view of the need of identifying superior genotypes in groups of favorable and unfavorable environments, using the methodology of environment classification proposed by Eberhart and Russell (1966). The methodology proposed by Annicchiarico (1992) is also very useful to assess the stability based on the risk related to the use of the cultivars.
Given the above information, the objective of this study was to evaluate the productive potential and yield stability of common bean genotypes of the carioca group in the final trials of the evaluation network for the Central Cerrado region in Brazil, based on three methodologies.
MATERIAL AND METHODS
To represent the different soil and climatic conditions in the Central Cerrado of Brazil, tests of the network for final evaluations of common bean, called
VCU (Value for Cultivation and Use), were conducted in 10 municipalities in the state of Goiás and the Distrito Federal. Twelve lines and four cultivars of the carioca group were evaluated in 2005 and 2006, in 23 environments: Santo Antônio de Goiás (rainy, dry and winter - 2005; rainy with a test inoculated with Rhizobium, rainy, dry and winter 2006), Brasilia (Winter 2006), Urutaí (rainy and winter -2006), Itumbiara (Winter - -2006), Anápolis (rainy, dry and winter 2005; rainy and dry 2006), Rio Verde (rainy -2005; rainy - 2006), Porangatu (dry - 2006), Ipameri (Winter - 2005), Senador Canedo (Winter - 2005), Planaltina (rainy - 2005; rainy - 2006).
The experiment was arranged in a complete block design with three replications, and plots consisted of four rows of four meters and the evaluated area of two central rows (4m2) with a spacing of 0.5 meters between rows and a planting density of 15 seeds per meter. The plants were fertilized according to the results of soil analysis of each experimental unit and no disease control was applied.
The yield was measured by grain weight per surface area of each plot, adjusted to 13 % moisture. The data of each site were subjected to individual and combined analysis of variance and the genotype means compared by the Tukey test at 5 % probability, using the statistical software package Genes (Cruz 2007). Grain yield stability and adaptability were determined by methods of visual analysis (Cruz 2007), proposed by Lin and Binns (1988) and modified by Carneiro (Cruz a n d C a r n e i r o 2 0 0 6 ) a n d t h e m e t h o d o l o g y o f Annicchiarico (1992), also with Genes software.
To measure the behavior of genotypes in a given set of environments, these ones were separated and denominated favorable (grain yield > overall average) and unfavorable (grain yield < overall average) environments. The purposes of the decomposition are to recommend genotypes that perform well in both favorable and unfavorable environments, which indicate the existence of, environments with high and low technology levels, respectively.
The overall stability of the genotypes (Pi) was estimated by the method of Lin and Binns (1988) and Pi partitioned in the parts related to favorable and unfavorable environments. The overall estimate of is
given by: where Pi is the
stability estimate of the ith genotype; Y
10 Crop Breeding and Applied Biotechnology 12: 8-16, 2012 VA Pontes Júnior et al.
productivity of the ith genotype in the jth environment, Mj is the maximum response observed among all genotypes in the jth environment, and e is the number of environments.
The environments were classified based on environmental indices defined as the difference between the genotype mean at each site and the overall mean. In environments with positive indices including value 0, Pij was estimated by an equation similar to the one above, replacing term 2e by 2f, where f is the number of favorable environments. Similarly, in unfavorable environments, whose indices are negative, 2e was replaced by 2u, where u is the number of unfavorable environments.
The method of Annicchiarico (1992) is based on the genotypic confidence index, which is estimated by:
considering all environments, where
is the average percentage of genotype I; is the standard deviation of the zij values ith associated with the genotype; and is the percentile of the function of the standard normal distribution.
The index was also calculated for the favorable and unfavorable environments, and the confidence coefficient was set at 75 %, i.e., α = 0.25.
Visual analysis is used so that it is possible to observe the performance of genotypes in each environments they were submitted to. This procedure evaluated the stability and adaptability by a performance graph of the genotype studied. The methodology provides maximum and average values of a set of genotypes in the evaluated environments and the relative behavior of each genotype, allowing conclusions about the superiority or inferiority in relation to these two reference values.
During the experiments, the plants were also evaluated for disease reaction, architecture and lodging, on 1-9 scales described by Melo (2009). For reactions to the diseases anthracnose, rust, common bacterial blight, angular leaf spot and powdery mildew, a scale was used in which grade 1 stands for absence of symptoms and grade 9 for plants about to collapse or dead. For plant architecture, the grades ranged from 1 (for upright plants, with height of the tip of the first pod to the ground above 12 cm, and for compact plants without vines) to 9 (highly branched plant, pods touching the soil and numerous vines), and for lodging,
grades ranged from 1 (no lodged plants in the plot) to 9 (all plants lodged). The grade data were not analyzed statistically, because they did not meet the assumptions for analysis of variance. However, they served as complementary information in the statistical analysis for yield, for a detailed characterization of the agronomic performance of genotypes.
RESULTS AND DISCUSSION
No significant differences were detected by the F test at 5 % probability in only three of the 23 environments (Santo Antônio de Goiás and winter/2006 dry/2005 and Urutaí winter/2006), which shows that in most environments, the evaluated genotypes proved to be genetically distinct for grain yield (Table 1).
The values of the coefficient of variation (CV) were lower than or equal to 25 % (Table 1) in most trials, which is the maximum value accepted for new common bean cultivars for recommendation (Brasil 2006). The means and CV’s varied, indicating diversity of the conditions the genotypes were subjected to. In the combined analysis (Table 2), all effects were significant, indicating the presence of variability among genotypes for selection, variability between the environments used and a differential response of the genotypes to environments. The significance of the GE interaction indicated that the stability analysis would be useful in the identification of superior lines.
Applied Biotechnology 12: 8-16, 2012
1
Productive potential and interaction of elite bean lines with environments in the Central Cerrado of Brazil
Table 1.Locations and summary of the separate analyses of variance of 23 VCU tests of carioca bean
1 Growing season; 2 Mean square of genotypes; 3 Mean square of the error; 4 Overall experimental mean (kg ha-1); 5 CV – Coefficient of variation (%); ns, * and **,
12 Crop Breeding and Applied Biotechnology 12: 8-16, 2012 VA Pontes Júnior et al.
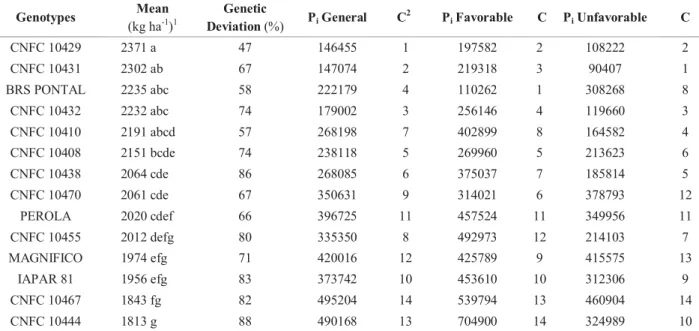
productivity (Table 3). In addition, the genetic deviation of this line was low, indicating high predictability and reliability of performance under different environmental conditions. This measure of genetic deviation is very important for the breeder, once it indicates the degree of oscillation in yield stability of a genotype under different growing conditions, making the
recommendation of new lines more reliable. The results show a high stability of CNFC 10429 in favorable as well as in unfavorable production environments, suggesting it is suitable for farms with high as well as low technology.
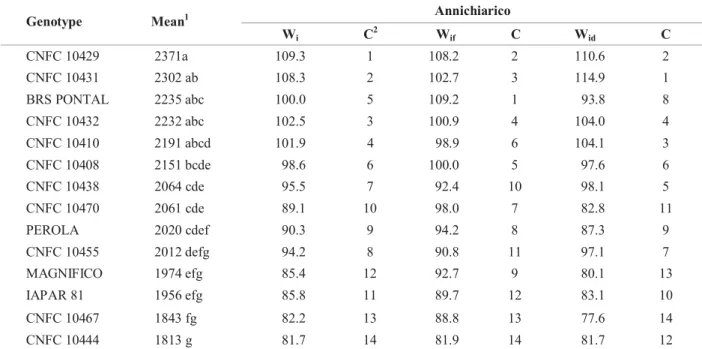
The method of Annichiarico identified a genotypic confidence index (Wi) of over 100% for genotype CNFC
Table 3. Grain yield, genetic deviation, general response of 14 common bean genotypes with carioca grain evaluated in 23 favorable
and unfavorable environments by the method of Lin and Binns (1988)
1 Means followed by at least one same letter did not differ statistically from each other by Tukey´s test, at 5 % probability; 2 Genotype classification based on stability by the method.
Table 2. Combined analysis of variance for grain yield of carioca bean (kg ha-1) in 23 experiments
10429, indicating a probability of 75 % that this line exceeds the grain yield of other genotypes in other production environments by 9.3 % (Table 4). In the favorable environments, this line was noted again, exceeding the overall average of 8.2 %. In the adverse environments, however, CNFC 10429 stood out with a superiority of 10.6 %. The estimate of genotypic confidence index underlies the estimation of the relationship of elite genotypes with the environmental mean and the assessment of the superiority of elite genotypes over the environmental mean. This line also showed tolerance to the disease caused by the bacterium Xanthomonas axonopodis pv. phaseoli, known as common bacterial blight, which accounts for
considerable production losses, especially in regions with moderate to high temperatures, as in the Central Cerrado region of Brazil. It is also tolerant to angular leaf spot, caused by the fungus Pseudocercospora griseola, with widespread occurrence in virtually all bean-producing regions of Brazil, and can lead to total production loss, in severe cases. This line had the most upright plant architecture and less lodged plants than the controls (Table 5).
The overall average yield of line CNFC 10431 was statistically equal to CNFC 10429 and higher than the controls CNFC Iapar 81, Pérola and Magnífico (Table 3). The methodology of Lin and Binns indicated a high yield stability of this genotype in both environments. The method of Annichiarico detected that genotype CNFC 10431 exceeds the average grain yield by at least 8.3 %, considering all the environments (Table 4). In unfavorable environments, this line stood out again, exceeding the environmental mean by 14.9 %. For all genotypes, the CNFC 10431 had the highest yield stability in unfavorable environments and may be indicated for these conditions. However, in terms of disease susceptibility, lodging and plant architecture, the performance of CNFC 10429 was better than of CNFC 10431 (Table 5)
The similarity between the methods of Lin and Binns and Annicchiarico was discussed by Borges et al. (2000), Silva and Duarte (2006), Silva Filho et al. (2008) and Pereira et al. (2009a), who attributed the similarity to the fact that these methods identify the superiority of the genotypes based on the best genotype in each environment (Lin and Binns) and the mean of each environment (Annicchiarico), confirming the results obtained by this study. According to Cargnelutti Filho et al. (2007), in a study that compared methods related to yield adaptability and stability of maize cultivars, the cultivars with high productivity associated to high stability and adapted to favorable environments are usually indicated by the methods of Lin and Binns (1988) modified by Carneiro (Cruz and Carneiro 2006) and of Annicchiarico (1992). However, the additional information provided by the estimates of genetic deviation proposed by Lin and Binns and the genotypic confidence index of Annicchiarico, are also useful for decision making in the selection of the genotypes.
The other lines, although the yield averages were not high, presented genotypes with other important traits for common bean. One example is line CNFC 10467,
Figure 1. Visual analysis of yield stability and adaptability of
line CNFC 10429 and cultivar Pérola in 23 environments.
Environments (A) 1. Santo Antônio de Goiás-GO (winter 2006
14 Crop Breeding and Applied Biotechnology 12: 8-16, 2012 VA Pontes Júnior et al.
Table 4. Estimates of adaptability and phenotypic stability (Wi) parameters of 14 common bean genotypes with carioca grain
evaluated in 23 environments by the method of Annichiarico (1992), separated in favorable (Wif) and unfavorable (Wid) environments
1 Means followed by at least one same letter were equal (Tukey, á=0.05); 2 Genotype classification based on stability by the method.
Table 5.Means and maximum values for grain yield (kg ha-1), grades of disease reaction and agronomic traitsof 14 common bean
genotypes evaluated in 23 environments
with delayed grain darkening, setting in after one year of storage. This trait is important for the producer because it allows the possibility of storage without depreciation. Another line is CNFC 10470, with large grain with an average mass of 100 seeds of 30 g, a characteristic that makes it more competitive in the market. Line CNFC 10408 has good yield stability and a similar productivity to cultivar Pérola in the evaluated environments, aside from better plant architecture and increased tolerance to lodging than BRS Pontal and Pérola. In addition, the reaction to common bacterial blight is similar to BRS Pontal, which is one of the Carioca bean cultivars with highest resistance level to this disease. Another advantage of line CNFC 10408 is that the cycle is semi-early, with 75 - 85 days, whereas
BRS Pontal and Pérola have a normal cycle, with 85 - 95 days (Del Peloso et al. 2009).
Therefore, in relation to grain yield, the lines CNFC 10429, CNFC 10431 and CNFC 10408 are the most stable and promising for recommendation as new cultivars for the Central Cerrado region of Brazil. The lines CNFC 10467 and CNFC 10470 with particular characteristics and moderate yield stability can be indicated for niche markets or used as parents in breeding programs.
ACKNOWLEDGEMENTS
The authors thank the CNPq – Conselho Nacional de Desenvolvimento Tecnológico for the grant to the first author and Embrapa for financial support of this study.
Potencial produtivo e interação de linhagens elite de feijoeiro com
ambientes no Cerrado Central do Brasil
Resumo - A procura por cultivares de feijão mais produtivas, com menor custo de produção e adaptadas as mais variadas condições tecnológicas tem aumentado. Assim, o objetivo deste trabalho foi avaliar a estabilidade e adaptabilidade das linhagens de feijoeiro comum do grupo carioca em ensaios da rede de avaliação final de feijoeiro-comum no cerrado central do Brasil, anos de 2005 e 2006. Foram avaliadas 12 linhagens e quatro cultivares testemunhas em 23 ambientes. Foi empregado o delineamento de blocos completos casualizados com três repetições, sendo as parcelas constituídas de quatro linhas de quatro metros. Os dados de produtividade de grãos foram submetidos a análises de variância e de estabilidade e adaptabilidade pelas metodologias de Lin and Binns, Annichiarico e Visual. As linhagens CNFC 10429, CNFC 10431 e CNFC 10408 mostraram-se mais estáveis e promissoras para indicação como nova cultivar.
Palavras-chave: Phaseolus vulgaris L., melhoramento genético, interação genótipos com ambientes.
REFERENCES
Annicchiarico P (1992) Cultivar adaption and recommendation from alfafa trials in Northern Italy. Journal of Genetics
and Plant Breeding46: 269-278.
Brasil. Instrução Normativa nº 25, de 23 de maio de 2006. Anexo I. Requisitos mínimos para determinação do valor de cultivo e uso de feijão (Phaseolus vulgaris) para a inscrição no registro nacional de cultivares - RNC. Diário
Oficial daRepública Federativa do Brasil, Brasília, June
19, 2006. Available at <http://extranet.agricultura.gov.br/ sislegis consulta/servlet/VisualizarAnexo?id=11376> Assessed in Jan. 2010.
Borges LC, Ferreira DF, Abreu AFB and Ramalho MAP (2000) Emprego de metodologias de avaliação da estabilidade fenotípica na cultura do feijoeiro comum (Phaseolus vulgaris L.). Revista Ceres 47: 89-102.
Carbonell SAM, Azevedo Filho JA, Dias LAS, Garcia AAF and Morais LK (2004) Common bean cultivars and lines
interactions with environments. Scientia Agricola 61:
169-177.
Cargnelutti Filho A, Perecin D, Malheiros EB and Guadagnin JP (2007) Comparação de métodos de adaptabilidade e estabilidade relacionados à produtividade de grãos de cultivares de milho. Bragantia 66: 168-176.
C r u z C D ( 2 0 0 7 ) G e n e s v. 2 0 0 7 . 0 . 0: a p l i c a t i v o computacional em genética e estatística. Universidade Federal de Viçosa, Departamento de Biologia Geral, Viçosa. Available at <http://www.ufv.br/dbg/genes/ genes.htm> Assessed in Dec. 2009.
Cruz CD and Carneiro PCS (2006) Modelos biométricos
aplicados ao melhoramento genético. Editora UFV,
16 Crop Breeding and Applied Biotechnology 12: 8-16, 2012 VA Pontes Júnior et al.
Cruz CD and Regazzi AJ (2001) Modelos biométricos
aplicados ao melhoramento genético. Editora UFV,
Viçosa, 390p.
Dalla Corte A, Moda-Cirino V and Destro D (2002) Adaptability and phenotypic stability in early common
bean cultivars and lines. Crop Breeding and Applied
Biotechnology2: 525-534.
Del Peloso MJ, Melo LC, Pereira HS, Faria LC, Costa JGC, Diaz JLC and Wendland A (2009) Cultivares de feijoeiro comum desenvolvidas pela Embrapa. In AL Fancelli (org)
Feijão: Tópicos especiais em manejo. 1st ed., ESALQ,
Piracicaba, p. 23-40.
Eberhat SA and Russell WA (1966) Stability parameters for comparing varieties. Crop Science6: 36-40.
Feijão: dados conjunturais do feijão (área, produção e
rendimento) e caupi (Vigna unguiculata (L.) Walp) no
Br a s i l : 1 985 a 2 0 0 8 . Av ail ab le at < htt p: / / www.cnpaf.embrapa.br/apps/socioeconomia/index.htm> Assessed in Mar. 2010.
Lin CS and Binns MR (1988) A superiority measure of cultivar performance for cultivar x location data. Canadian
Journal Plant Science68: 193-198.
Melo LC (2009) Procedimentos para condução de
experimentos de valor de cultivo e uso em feijoeiro
comum. Embrapa-CNPAF, Santo Antônio de Goiás, 104p.
(Embrapa-CNPAF. Documentos, 239).
Melo LC, Santos PG, Faria LC, Diaz JLC, Del Peloso MJ, Rava CA and Costa JGC (2007) Interação com ambientes e estabilidade de genótipos de feijoeiro-comum na região
Centro-Sul do Brasil. Pesquisa Agropecuária Brasileira
42: 715-723.
Oliveira GV, Carneiro PCS, Carneiro JES and Cruz CD (2006) Adaptabilidade e estabilidade de linhagens de feijão comum
em Minas Gerais. Pesquisa Agropecuária Brasileira41:
275-265.
Pereira HS, Melo LC, Faria LC, Diaz JLC, Del Peloso MJ and Wendland A (2010) Environmental stratification in Parana and Santa Catarina to evaluate common bean
genotypes. Crop Breeding and Applied Biotechnology
10: 132-139.
Pereira HS, Melo LC, Del Peloso MJ, Faria LC, Costa JGC, Diaz JLC, Rava CA and Wendland A (2009a) Comparação de métodos de análise de adaptabilidade e estabilidade
fenotípica em feijoeiro-comum. Pesquisa Agropecuária
Brasileira 44: 374-383.
Pereira HS, Melo LC, Faria LC, Del Peloso MJ, Costa JGC, Rava CA and Wendland A (2009b) Adaptabilidade e estabilidade de genótipos de feijoeiro-comum com grãos
tipo carioca na região Central do Brasil. Pesquisa
Agropecuária Brasileira44: 29-37.
Pereira HS, Melo LC, Faria LC, Diaz JLC, Del Peloso MJ, Costa JGC and Wendland A (2009c) Stability and adaptability of carioca common bean genotypes in states of the central South Region of Brazil. Crop Breeding and
Applied Biotechnology9: 181-188.
Silva Filho JL, Morello CL, Farias FJC, Lamas FM, Pedrosa MB and Ribeiro JL (2008) Comparação de métodos para avaliar a adaptabilidade e estabilidade produtiva em
algodoeiro. Pesquisa Agropecuária Brasileira 43:
349-355.
Silva WCJ and Duarte JB (2006) Métodos estatísticos para estudo de adaptabilidade e estabilidade fenotípica em soja.