Demarcation of informative chromosomes in tropical sweet corn inbred lines
using microsatellite DNA markers
Pedram Kashiani
1, Ghizan Saleh
1, Jothi Malar Panandam
2, Nur Ashikin Psyquay Abdullah
1and Ahmad Selamat
11
Department of Crop Science, Faculty of Agriculture, Universiti Putra Malaysia, Selangor, Malaysia.
2
Department of Animal Science, Faculty of Agriculture, Universiti Putra Malaysia, Selangor, Malaysia.
Abstract
A study of genetic variation among 10 pairs of chromosomes extracted from 13 tropical sweet corn inbred lines, using 99 microsatellite markers, revealed a wide range of genetic diversity. Allelic richness and the number of effective al-leles per chromosome ranged from 2.78 to 4.33 and 1.96 to 3.47, respectively, with respective mean values of 3.62 and 2.73. According to the Shannon’s information index (I) and Nei’s gene diversity coefficient (Nei), Chromosome 10 was the most informative chromosome (I = 1.311 and Nei = 0.703), while Chromosome 2 possessed the least (I = 0.762 and Nei = 0.456). Based on linkage disequilibrium (LD) measurements for loci less than 50 cM apart on the same chromosome, all loci on Chromosomes 1, 6 and 7 were in equilibrium. Even so, there was a high proportion of genetic variation in Chromosomes 4, 5, 8, 9 and 10, thereby revealing their appropriateness for use in the genetic di-versity investigations among tropical sweet corn lines. Chromosome 4, with the highest number of loci in linkage dis-equilibrium, was considered the best for marker-phenotype association and QTL mapping, followed by Chromo-somes 5, 8, 9 and 10.
Key words:microsatellite, inbred line, chromosome, genetic variation, linkage disequilibrium.
Received: January 11, 2012; Accepted: April 9, 2012.
Introduction
Sweet corn (Zea maysL. ssp.saccharata, 2n = 20), with a thin pericarp layer on the caryopsis, is consumed at the immature grain-stage of endosperm development. It can be grown in a wide range of environments, so long as its water requirements are in accordance (Kashiani et al., 2011). Due to its high economic value, production in the tropical areas is on the increase (Kashiani et al., 2010; Salehet al., 2010). The sugary (su) or sweet gene in Chro-mosome 4 either prevents or retards normal conversion of sugar into starch during endosperm development, whence the sweet taste.
The study of variation among chromosomes, besides being a quick way of detecting genes linked to molecular markers, makes it easy to define the degree of genetic rela-tionships among inbred lines. The use of these molecular markers in the breeding process also facilitates efficiently reaching breeding goals, with less reliance on field assay-ing by inoculation. Over the last two decades, innumerable molecular markers have been developed for almost all the major crop species (Barcaccia, 2010). Microsatellites, also known as SSRs, short tandem repeats (STRs), and
se-quence-tagged microsatellite sites (STMS), are repeated units of short nucleotide motifs in tandem, that are 1 to 6 bp long. Di-, tri- and tetra-nucleotide repeats are widely dis-tributed throughout the genomes of plants and animals (Tautz and Renz, 1984; Perseguiniet al., 2011). Report-edly, microsatellite technology is useful for evaluating ge-netic diversity and phylogege-netic relationships in plant species (Naeem et al., 2011), microsatellite loci having proven their efficiency as genetic markers, under these cir-cumstances. To date, SSRs have been used with corn for mapping (Taramino and Tingey, 1996), genetic fingerprint-ing (Senioret al., 1998), and assessing genetic diversity among inbred lines (Liuet al., 2003). Nonetheless, chro-mosomes, with higher locus contribution to genetic varia-tion for important traits among tropical sweet corn lines, have not yet been demarcated from those with numerous housekeeping genes.
Sweet corn inbreds are extensively used in hybrid production (Anderson and Brown, 1952; Troyer, 2001). They are also important in certain genetic studies,viz., the development of linkage maps (Burret al., 1988), and quan-titative trait loci mapping (QTL) (Austin et al., 2001). Through its narrower genetic base, when compared to field corn (Srdicet al., 2008), the application of high variability microsatellite markers to sweet corn breeding lines would
Send correspondence to Ghizan Saleh. Department of Crop Sci-ence, Faculty of Agriculture, Universiti Putra Malaysia 43400 Serdang, Selangor, Malaysia. E-mail: ghizan@agri.upm.edu.my.
greatly contribute to its breeding efficiency. Currently, in-formation on many of these microsatellites, and their re-spective location on the chromosome, is available in databases. Nonetheless, chromosomes with numerous polymorphic microsatellite loci, capable of detecting high genetic variability, have not yet been distinguished. More-over, even when using any kind of molecular marker, there is no available information on the characterization of the 10 pairs of specific chromosomes. Although karyotypic data are available, there is an obvious lack in knowledge on inter- and intra-chromosomal variation. This obliges re-searchers to select microsatellite loci throughout the ge-nome for genetic diversity studies and QTL investigation, thus making investigation time consuming and costly. Hence, the main objective of the present study was to de-marcate informative chromosomes with the highest inter-and intra-variation among tropical sweet corn inbred lines, for further marker-assisted breeding work, genetic diver-sity studies and QTL investigation.
Material and Methods
Through an extensive breeding program carried out in Universiti Putra Malaysia, a set of homozygous inbred lines developed from various tropical-source populations was obtained after eight generations of self-pollination and se-lection. Among these, 13, originally developed from Ma-laysian, Indonesian, Hawaiian, Taiwanese and Thailand source-populations, were selected for investigation of in-nate chromosomal variation. Twenty seeds from each line were germinated in jiffy cups. Eventual seedlings were grown to the two-leaf stage, whereupon genomic DNA was extracted from the young leaves of 10 per line using a DNeasy® Plant Mini Kit from QIAGEN®, according to manufacturer’s instruction, but with minor modifications as regards washing steps.
Based on their polymorphism information content (PIC) and QTL information as previously reported, one hundred and five microsatellite regions that are distributed throughout the corn genome were chosen from the maize genome database (MaizeGDB). Six out of 105 micro-satellite primers were not successfully amplified, even when tested at different annealing temperatures. The re-maining 99, as well as their respective locations in the ten corn chromosomes, are shown in Figure 1. Amplifications were carried out using volumes consisting of 20mL PCR re-action containing 5mL (25-30 ng) of genomic DNA, 1.5mL of PCR 10x buffer, 1.5mL of 25 mM MgCl2, 0.3mL of dNTP Mix (10 mM each of dATP, dGTP, dCTP, dTTP), 0.2 unit ofTaqpolymerase (all from QIAGEN®,TaqDNA Polymerase Kit) 1.8mL (4 pmol/mL) of each primer (F and R primers), and 9.7mL of distilled water. PCR amplifica-tion was in an Eppendorf Mastercycler Gradient Thermal cycler (Eppendorf Scientific, Westbury, NY), using 96-well-plates. Amplification conditions with the touchdown
thermal cycling protocol were 95 °C for 1 min, 30 cycles of 94 °C for 1 min, 67 °C annealing temperature decreasing by 0.4 °C per cycle for 2 min and 72 °C for 2 min, and a termi-nal extension step at 72 °C for 1 h. Following amplification, 10 mL of amplified DNA were mixed with 5 mL of a formamide loading buffer, and then placed into 4% (w/v) metaphore agarose 36-cm well-to-read gels with 1x TBE buffer. Electrophoresis was performed at 100 volts for 5 min, and followed by 55 volts for approximately 4 h until the bromophenol blue band of the loading dye had been moved forward by 10 cm. After staining with ethidium bro-mide, all the gels were visualized under UV light with an Alpha EaseR FC Imaging System (Alpha Innotech Corpo-ration, CA). The ChemilImagerTM Gel Doc. imaging sys-tem (Alpha Innotech Corporation, CA) was used to record the gels as JPEG files for counterchecking. Fragment sizes were estimated based on GeneRulerTM 25 and 50 bp DNA Ladders (Fermentas).
Descriptive statistics for each chromosome, includ-ing average number of alleles (na), number of effective
al-leles (ne) (Kimura and Crow, 1964), observed and expected
homozygosity (Homo and Home, respectively), observed
and expected heterozygosity (Hoand He, respectively)
(Le-vene, 1949; Nei, 1987), average heterozygosity (H), the$ Shannon’s information index (I) (Lewontin, 1972), Nei’s expected heterozygosity (Nei, 1973), gene flow (Nm) (Nei, 1987), and coefficient of inbreeding (F) (Lukas and Don-ald, 2002), were all estimated using the Population Genetic Analysis software (POPGENE) version 1.3.1 (Yehet al., 1999). F-statistics (FIS, FSTand FIT) for each chromosome
were estimated from variance components based on Wright (1978). Classical (D), standardized (D’), and conventional (r2) linkage disequilibrium (LD) coefficients for any pair of alleles amplified at two loci on the same chromosome, were estimated based on Lewontin and Kojima (1960), using Arlequin suite version 3.5 computer software (Excoffier and Lischer, 2010).
Results
There was a wide range of genetic variation among the 10 pairs of chromosomes obtained from the inbred lines evaluated. Allelic richness and the number of effective al-leles per chromosome ranged from 2.78 to 4.33 and 1.96 to 3.47, respectively, with respective mean values of 3.62 and 2.73 (Table 1). The combination, high homozygosity (Homo = 0.9396), and very low heterozygosity
(Ho = 0.0604), was a sure indication of Hardy-Weinberg
disequilibrium arising from heterozygosity loss during selfing and selection. Heterozygote locus deficiency was also revealed by the high and negative proportion of total chromosomal inbreeding, as an outcome of inbreeding among loci within chromosomes (FIS= -0.6666), and the
studied (Homo = 0.9715), and Chromosome 3, the least
(Homo= 0.8928). Chromosome 7 possessed the lowest rate
of gene flow (Nm = 0.0094) of all (Table 1).
According to the Shannon’s information index (I) and Nei’s gene diversity, Chromosome 10 was the most infor-mative (I = 1.3111 and Nei = 0.7033), and Chromosome 2 the least variable (I = 0.7616 and Nei = 0.4562). The pro-portion of total chromosomal inbreeding due to variation among chromosomes, and that due to both inbreeding within the chromosome and variation among chromo-somes, indicate the wide range of genetic diversity among the 10 pairs (FST= 0.9385 and FIT= 0.8972). This was also
shown by the high I and Nei estimates, with mean values of 1.0503 and 0.5850, respectively. Chromosomes 4, 5, 8, 9 and 10 with the highest number of alleles per locus, number of effective alleles, Shannon’s information index and Nei’s heterozygosity coefficient, were identified as the informa-tive chromosomes in the inbred lines, thus making them ap-propriate for these specific genetic diversity studies.
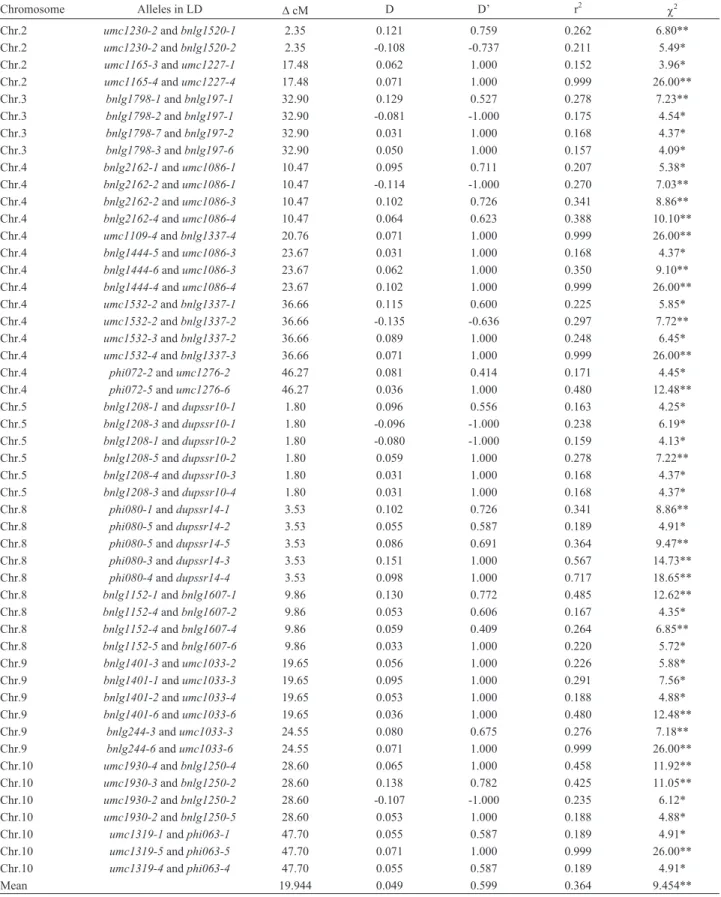
446 pairs of alleles were in linkage disequilibrium, of which only 50 were less than 50 cM apart on the same chro-mosome (Table 2). Chrochro-mosome 4 bore the highest number of pairs in LD (122), whereas in Chromosome 6, there were only six. On considering only loci less than 50 cM apart, all were in linkage equilibrium in Chromosomes 1, 6 and 7. Those pairs in linkage disequilibrium, with the shortest dis-tance from each other based on cM, werebnlg1208 and dupssr10 (1.80 cM), umc1230 and bnlg1520(2.35 cM), phi080anddupssr14(3.53 cM), bnlg1152andbnlg1607 (9.86 cM), bnlg2162 and umc1086 (10.47 cM), and umc1165andumc1227(17.48 cM), all located on Chromo-somes 5, 2, 8, 8, 4 and 2, respectively (Table 2). The highest conventional measure of linkage disequilibrium between pairs of alleles at two loci was in umc1165-4 and umc1227-4, followed by umc1109-4 and bnlg1337-4, bnlg1444-4andumc1086-4,umc1532-4 andbnlg1337-3, bnlg244-6andumc1033-6, andumc1319-5andphi063-5 Figure 1- Microsatellite markers (99) utilized for demarcation of informative chromosomes among tropical sweet corn inbred lines, and their locations in
the genome. Distances are shown in centiMorgan units (cM), microsatellites in red are at disequilibrium, and Dark spots on chromosomes indicatehot LD
(all with r2= 0.999,c2= 26.00, at p£0.001) located on Chromosomes 2, 4, 4, 4, 9 and 10, respectively. All were less than 50 cM apart. Thus, linkage between loci on mosome 4 was stronger than in the others. In general, Chro-mosome 4, with the highest number of pairs of alleles at two loci in linkage disequilibrium (122), the highest num-ber of pairs of alleles at two loci in linkage disequilibrium located less than 50 cM apart (14), and the highest overall mean of conventional measure of linkage disequilibrium between pairs of alleles at two loci separated less than 50 cM apart (r2= 0.44), is a highly desirable candidate for further QTL analysis.
Discussion
Previous studies have shown that corn contains nu-merous (Senior and Heun, 1993; Senioret al., 1996, 1998), and highly polymorphic microsatellites, even among small samples of corn inbreds (Chinet al., 1996; Taramino and Tingey, 1996). This could be due to their capacity to detect codominantly inherited length polymorphisms of repetitive DNA sequences, and thus discriminate between large num-bers of alleles (Matsuokaet al., 2002; Perseguini et al., 2011). Variation among the 10 sweet-corn chromosomes, obtained from the inbred lines investigated here, could be a expeditious basis for determining the degree of genetic re-lationships among different lines, or for detecting genes linked to microsatellite loci. Chromosomes with high varia-tion among inbred lines could be employed in future genetic-diversity research, in which a low number of ampli-fied loci could reveal high diversity. The highest genetic variation among the inbred lines was in Chromosomes 10, 8, 5, 9 and 4. Mohammadiet al.(2008) reported that Chro-mosomes 1, 6 and 9 with 4, 4 and 3 informative markers, re-spectively, significantly contributed to total variation in yield in corn inbred lines. Chromosomes with high Shan-non’s information index (I) and high Nei’s heterozygosity coefficient (Nei) were found to be liable for a high propor-tion of total genetic variapropor-tion, whereby their utility in effec-tively discriminating inbred lines quickly and at a lower cost. Nevertheless, the high I and Nei values obtained from a particular chromosome might be due to locus hetero-zygosity, rather than the heterozygosity of corresponding chromosomes coming from different inbred lines. Chromo-somes 9, 8, 4 and 10, with over 90% homozygosity, were found to have the highest number of alleles per locus, num-ber of effective alleles, and Shannon’s information index, as well as a high Nei’s heterozygosity coefficient, thereby indicating their capacity to discriminate among the inbred lines studied. Zhanget al.(1994, 1996) investigated the ef-fectiveness of chromosomal variation based on informative markers, by improving the correlations between molecular marker divergence and hybrid performance. Their conclu-sion was that the relationship between the effectiveness of chromosomal variation based on molecular marker
Table 2- Pairs of alleles in linkage disequilibrium from different loci less than 50 cM apart, on the same chromosome.
Chromosome Alleles in LD DcM D D’ r2
c2
Chr.2 umc1230-2andbnlg1520-1 2.35 0.121 0.759 0.262 6.80**
Chr.2 umc1230-2andbnlg1520-2 2.35 -0.108 -0.737 0.211 5.49*
Chr.2 umc1165-3andumc1227-1 17.48 0.062 1.000 0.152 3.96*
Chr.2 umc1165-4andumc1227-4 17.48 0.071 1.000 0.999 26.00**
Chr.3 bnlg1798-1andbnlg197-1 32.90 0.129 0.527 0.278 7.23**
Chr.3 bnlg1798-2andbnlg197-1 32.90 -0.081 -1.000 0.175 4.54*
Chr.3 bnlg1798-7andbnlg197-2 32.90 0.031 1.000 0.168 4.37*
Chr.3 bnlg1798-3andbnlg197-6 32.90 0.050 1.000 0.157 4.09*
Chr.4 bnlg2162-1andumc1086-1 10.47 0.095 0.711 0.207 5.38*
Chr.4 bnlg2162-2andumc1086-1 10.47 -0.114 -1.000 0.270 7.03**
Chr.4 bnlg2162-2andumc1086-3 10.47 0.102 0.726 0.341 8.86**
Chr.4 bnlg2162-4andumc1086-4 10.47 0.064 0.623 0.388 10.10**
Chr.4 umc1109-4andbnlg1337-4 20.76 0.071 1.000 0.999 26.00**
Chr.4 bnlg1444-5andumc1086-3 23.67 0.031 1.000 0.168 4.37*
Chr.4 bnlg1444-6andumc1086-3 23.67 0.062 1.000 0.350 9.10**
Chr.4 bnlg1444-4andumc1086-4 23.67 0.102 1.000 0.999 26.00**
Chr.4 umc1532-2andbnlg1337-1 36.66 0.115 0.600 0.225 5.85*
Chr.4 umc1532-2andbnlg1337-2 36.66 -0.135 -0.636 0.297 7.72**
Chr.4 umc1532-3andbnlg1337-2 36.66 0.089 1.000 0.248 6.45*
Chr.4 umc1532-4andbnlg1337-3 36.66 0.071 1.000 0.999 26.00**
Chr.4 phi072-2andumc1276-2 46.27 0.081 0.414 0.171 4.45*
Chr.4 phi072-5andumc1276-6 46.27 0.036 1.000 0.480 12.48**
Chr.5 bnlg1208-1anddupssr10-1 1.80 0.096 0.556 0.163 4.25*
Chr.5 bnlg1208-3anddupssr10-1 1.80 -0.096 -1.000 0.238 6.19*
Chr.5 bnlg1208-1anddupssr10-2 1.80 -0.080 -1.000 0.159 4.13*
Chr.5 bnlg1208-5anddupssr10-2 1.80 0.059 1.000 0.278 7.22**
Chr.5 bnlg1208-4anddupssr10-3 1.80 0.031 1.000 0.168 4.37*
Chr.5 bnlg1208-3anddupssr10-4 1.80 0.031 1.000 0.168 4.37*
Chr.8 phi080-1anddupssr14-1 3.53 0.102 0.726 0.341 8.86**
Chr.8 phi080-5anddupssr14-2 3.53 0.055 0.587 0.189 4.91*
Chr.8 phi080-5anddupssr14-5 3.53 0.086 0.691 0.364 9.47**
Chr.8 phi080-3anddupssr14-3 3.53 0.151 1.000 0.567 14.73**
Chr.8 phi080-4anddupssr14-4 3.53 0.098 1.000 0.717 18.65**
Chr.8 bnlg1152-1andbnlg1607-1 9.86 0.130 0.772 0.485 12.62**
Chr.8 bnlg1152-4andbnlg1607-2 9.86 0.053 0.606 0.167 4.35*
Chr.8 bnlg1152-4andbnlg1607-4 9.86 0.059 0.409 0.264 6.85**
Chr.8 bnlg1152-5andbnlg1607-6 9.86 0.033 1.000 0.220 5.72*
Chr.9 bnlg1401-3andumc1033-2 19.65 0.056 1.000 0.226 5.88*
Chr.9 bnlg1401-1andumc1033-3 19.65 0.095 1.000 0.291 7.56*
Chr.9 bnlg1401-2andumc1033-4 19.65 0.053 1.000 0.188 4.88*
Chr.9 bnlg1401-6andumc1033-6 19.65 0.036 1.000 0.480 12.48**
Chr.9 bnlg244-3andumc1033-3 24.55 0.080 0.675 0.276 7.18**
Chr.9 bnlg244-6andumc1033-6 24.55 0.071 1.000 0.999 26.00**
Chr.10 umc1930-4andbnlg1250-4 28.60 0.065 1.000 0.458 11.92**
Chr.10 umc1930-3andbnlg1250-2 28.60 0.138 0.782 0.425 11.05**
Chr.10 umc1930-2andbnlg1250-2 28.60 -0.107 -1.000 0.235 6.12*
Chr.10 umc1930-2andbnlg1250-5 28.60 0.053 1.000 0.188 4.88*
Chr.10 umc1319-1andphi063-1 47.70 0.055 0.587 0.189 4.91*
Chr.10 umc1319-5andphi063-5 47.70 0.071 1.000 0.999 26.00**
Chr.10 umc1319-4andphi063-4 47.70 0.055 0.587 0.189 4.91*
Mean 19.944 0.049 0.599 0.364 9.454**
LD = linkage disequilibrium,DcM = difference between two alleles in cM, D = classical linkage disequilibrium coefficient measuring deviation from
random association between alleles at different loci, D’ = standardized linkage disequilibrium coefficient, r2= conventional measure of linkage
disequi-librium between pairs of alleles at two loci andc2= Chi-square value.
zygosity and heterosis is variable, depending on the genetic material used in the study, germplasm diversity, and the complexity of the genetic heterosis base.
Crop yields and their components are complex char-acters, controlled by multi-genes and environmental factors (Kashiani and Saleh, 2010). Linkage disequilibrium (LD), the non-random association of alleles at closely linked loci, is used to infer the location of gene coding traits by virtue of their correlated appearance with surrounding markers (Za-vattariet al., 2000). In contrast to animals and humans, lit-tle information is available on linkage disequilibrium in crop species, with most research concentrating on Arabidopsis thaliana and field corn (Flint-Garcia et al., 2003; Stichet al., 2005, 2006). Since homogeneity was pre-dominant, analysis was concentrated on linkage disequilib-rium among the inbred lines, and not within a single one or group. The high incidence of linkage disequilibrium (446 pairs of loci in LD) implied that the extent of LD between microsatellite markers could possibly facilitate the detec-tion of marker-phenotype associadetec-tions in a genome scan. This value, although in agreement with the results of Liuet al.(2003), was considerably higher than that reported by Remingtonet al. (2001), and lower than that reported by Stichet al.(2005). The discrepancy between the present re-sults and those above mentioned can presumably be attrib-uted to marker density and the number of inbred lines evaluated. Marker density used in this study, although much higher than that reported by Remingtonet al.(2001), was approximately equal to that used by both Liuet al. (2003) and Stichet al.(2005). However, the number of in-bred lines used in the current study was lower than that used by Remingtonet al.(2001), Liuet al.(2003) and Stichet al. (2005).
It has been theoretically shown that selection acting on a monogenic trait generates LD around the gene. Fur-thermore, if selection involves an oligogenic or polygenic trait, LD is generated, not only between linked genes, but also between unlinked genes coding for the trait. During de-velopment of the inbred lines used here, selection, which took place simultaneously for several traits with high heri-tability estimates and significant correlations with yield, could consequently have also generated LD between the genes influencing different traits. Therefore, the high pro-portion of observed LD in this study was generated by se-lection potential. It has been suggested that sese-lection, relatedness, population stratification and genetic drift are important forces generating and conserving LD between pairs of genome-widely distributed microsatellite markers (Stichet al., 2005). Furthermore, the increasing physical distance between pairs of markers was found to decrease LD, due to crossingover (Talbert and Henikoff, 2010). However, no correlations could be found between physical distance and LD in corn Centromere 2 that had been fully sequenced (Wolfgruberet al., 2009), possibly through both the conversion of one marker ordinarily having no effect on
the coinheritance of its neighbours, and crossingover hav-ing been suppressed around centromeres.
In order to avoid disequilibrium between loci influ-encing several traits, only LD between loci less than 50 cM apart on the same chromosome was considered. Under these conditions, 66.7% of Chromosome 4 loci were ampli-fied in LD, whereas only 18.2% of Chromosome 3 and 5 loci were. Furthermore, Chromosome 4 was found to have the highest number of linkages among loci separated by ei-ther more or less than 50 cM (144 and 14 pairs in LD, re-spectively), thereby indicating the high potential utility of this chromosome for investigating marker-phenotype asso-ciation and QTL. The presence of QTLs for Chromosone 4 corn agronomic traits has been amply reported (Sourdilleet al., 1996; Lubberstedt et al., 1997; Ribaut et al., 1997; Khairallahet al., 1998; Yousef and Juvik, 2002; Juviket al., 2003; Messmeret al., 2009). Furthermore, since they posses a considerable number of loci in disequilibrium (9, 7, 6 and 6, respectively), Chromosomes 8, 10, 9 and 5 were also identified as candidate chromosomes for further QTL studies. Based on the latest information from Maize GDB (March, 2011), 768 out of 1716 QTL reported for corn ag-ronomic traits were found to be on Chromosomes 4, 5, 8, 9 and 10 (114, 179, 189, 171 and 115, respectively). Among the QTL found on Chromosomes 4, 5, 8, 9 and 10, 357 (46.48%) were found to have contributed to yield (Hoet al., 2002; Landiet al., 2002; Sibovet al., 2003; Moreauet al., 2004; Messmeret al., 2009; Huet al., 2010a,b). thus indi-cating that, in the present study, the microsatellites in LD on these same Chromosomes are useful for detecting yield-marker association for further marker-assisted selec-tion of inbred lines and their F1single-cross progenies.
Finally, microsatellites were found to be informative markers for revealing chromosomal variation among the tropical sweet corn inbred-lines studied herein. Chromo-somes 4, 5, 8, 9 and 10 were found to possess a high propor-tion of specific genetic variapropor-tion, thus revealing their appropriateness for genetic diversity studies. Chromosome 4, with the highest number of loci in linkage disequilib-rium, is the most appropriate for marker-phenotype associ-ation and QTL mapping for yields and yield-related traits, with Chromosomes 5, 8, 9 and 10 as runner-ups.
Acknowledgments
The authors gratefully acknowledge the financial support for research under e-Science Fund (Project No.: 05-01-04-SF0700) from the Ministry of Science, Technol-ogy and Innovation, Malaysia (MOSTI).
References
Austin DF, Lee M and Veldboom LR (2001) Genetic mapping in maize with hybrid progeny across testers and generations: Plant height and flowering. Theor Appl Genet 102:163-176. Barcaccia G (2010) Molecular markers for characterizing and
conserving crop plant germplasm. In: Jain, SM and Brar DS (eds), Molecular Techniques in Cropimprovement. Sprin-ger, New York, pp 231-254.
Burr B, Burr FA, Thompson KH, Albertson MC and Stuber CW (1988) Gene mapping with recombinant inbreds in maize. Genetics 118:519-526.
Chin EC, Senior ML, Shu H and Smith JS (1996) Maize simple re-petitive DNA sequences: Abundance and allele variation. Genome 39:866-873.
Excoffier L and Lischer HEL (2010) Arlequin suite ver. 3.5: A new series of programs to perform population genetics anal-yses under Linux and Windows. Mol Ecol Res 10:564-567. Flint-Garcia SA, Thornsberry JM and Buckler Vth ES (2003) Structure of linkage disequilibrium in plants. Annu Rev Plant Biol 54:357-374.
Ho C, McCouch R and Smith E (2002) Improvement of hybrid yield by advanced backcross QTL analysis in elite maize. Theor Appl Genet 105:440-448.
Hu J, Yang Z, Yu Y and Li G (2010a) QTL mapping for pericarp thickness in sweet corn. Maize Gen Conf 52:228.
Hu J, Yang ZY, Yu Y and Li G (2010b) Identification of QTL for yield-related traits induced by space flight in sweet corn. Maize Gen Conf 52:209.
Juvik JA, Yousef GG, Han TH, Tadmor Y, Azanza F, Tracy WF, BarZur A and Rocheford TR (2003) QTL influencing kernel chemical composition and seedling stand establishment in sweet corn with the shrunken2 and sugary enhancer1 endo-sperm mutations. Anglais 128:864-875.
Kashiani P and Saleh G (2010) Estimation of genetic correlations on sweet corn inbred lines using SAS mixed model. Am J Agric Biol Sci 5:309-314.
Kashiani P, Saleh G, Abdullah NAP and Abdullah SN (2010) Variation and genetic studies on selected sweet corn inbred lines. Asian J Crop Sci 2:78-84.
Kashiani P, Saleh G, Osman M and Habibi D (2011) Sweet corn yield response to alternate furrow irrigation methods under different planting densities in a semi-arid climatic condition. Afr J Agric Res 6:1032-1040.
Khairallah MM, Bohn M, Jiang C, Deutsch JA, Jewell DC, Mihm JA, Melchinger AE, González-De-León D and Hoisington DA (1998) Molecular mapping of QTL for southwestern corn borer resistance, plant height and flowering in tropical maize. Plant Breed 117:309-318.
Kimura M and Crow JF (1964) The number of alleles that can be maintained in a finite population. Genetics 49:725-738. Landi P, Sanguineti MC, Darrah LL, Giuhani MM, Salvi S, Conti
S and Tuberosa R (2002) Detection of QTLs for vertical root pulling resistance in maize and overlap with QTLs for root traits in hydroponics and for grain yield under different wa-ter regimes. Maydica 47:233-243.
Levene H (1949) On a matching problem arising in genetics. Ann Math Stat 20:91-94.
Lewontin RC (1972) Testing the theory of natural selection. Na-ture 236:181-182.
Lewontin RC and Kojima K (1960) The evolutionary dynamics of complex polymorphisms. Evolution 14:458-472.
Liu K, Goodman M, Muse S, Smith JS, Buckler E and Doebley J (2003) Genetic structure and diversity among maize inbred lines as inferred from DNA microsatellites. Genetics 165:2117-2128.
Lubberstedt T, Melchinger AE, Schoen CC, Utz H and Klein D (1997) QTL mapping in testcrosses of European flint lines of maize: I. Comparison of different testers for forage yield traits. Crop Sci 37:921-931.
Lukas FK and Donald MW (2002) Inbreeding effects in wild pop-ulations. Trends Ecol Evol 17:230-241.
Matsuoka Y, Mitchell SE, Kresovich S, Goodman M and Doebley J (2002) Microsatellites in zea – Variability, patterns of mu-tations, and use for evolutionary studies. Theor Appl Genet 104:436-450.
Messmer R, Fracheboud Y, Banziger M, Vargas M, Stamp P and Ribaut JM (2009) Drought stress and tropical maize: QTL-by-environment interactions and stability of QTLs across environments for yield components and secondary traits. Theor Appl Genet 119:913-930.
Mohammadi SA, Prasanna BM, Sudan C and Singh NN (2008) SSR heterogenic patterns of maize parental lines and predic-tion of hybrid performance. Biotechnol Biotech Eq 22:541-547.
Moreau L, Charcosset A and Gallais A (2004) Use of trial cluster-ing to study QTL x environment effects for grain yield and related traits in maize. Theor Appl Genet 110:92-105. Naeem R, Dahleen L and Mirza B (2011) Genetic differentiation
and geographical Relationship of Asian barley landraces us-ing SSRs. Genet Mol Biol 34:268-273.
Nei M (1973) Analysis of gene diversity in subdivided popula-tions. Proc Natl Acad Sci USA 70:3321-3323.
Nei M (1987) Molecular Evolutionary Genetics. Columbia Uni-versity Press, New York, 512 pp.
Perseguini JMKC, Chioratto AF, Zucchi MI, Colombo CA, Car-bonell SAM, Mondego JMC, Gazaffi R, Garcia AAF, de Campos T, de Souza AP,et al.(2011) Genetic diversity in cultivated carioca common beans based on molecular marker analysis. Genet Mol Biol 34:88-102.
Remington DL, Thornsberry JM, Matsuoka Y, Wilson LM, Whitt SR, Doebley J, Kresovich S, Goodman MM and Buckler ES (2001) Structure of linkage disequilibrium and phenotypic associations in the maize genome. Proc Natl Acad Sci USA 98:11479-11484.
Ribaut JM, Jiang C, Gonzalez-de-Leon D, Edmeades GO and Hoisington DA (1997) Identification of quantitative trait loci under drought conditions in tropical maize. 2. Yield components and marker-assisted selection strategies. Theor Appl Genet 94:887-896.
Saleh GB, Min TD, Noordin WD, Halim RA and Anuar AR (2010) Spatial variability of soil and plant nutrients and their influence on maize grain yield. J Food Agric Environ 8:1313-1325.
Senior ML and Heun M (1993) Mapping maize microsatellites and polymerase chain reaction confirmation of the targeted repeats using a CT primer. Genome 36:884-889.
Senior ML, Chin ECL, Lee M, Smith JSC and Stuber CW (1996) Simple sequence repeat markers developed from maize se-quences found in the GENBANK database: Map construc-tion. Crop Sci 36:1676-1683.
rela-tionships in maize using an agarose gel system. Crop Sci 38:1088-1098.
Sibov ST, de Souza Jr CL, Garcia AA, Silva AR, Garcia AF, Mangolin CA, Benchimol LL and de Souza AP (2003) Mo-lecular mapping in tropical maize (Zea mays L.) using microsatellite markers. 2. Quantitative trait loci (QTL) for grain yield, plant height, ear height and grain moisture. Hereditas 139:107-115.
Sourdille P, Baud S and Leroy P (1996) Detection of linkage be-tween RFLP markers and genes affecting anthocyanin pig-mentation in maize (Zea maysL.). Euphytica 91:21-30. Srdic J, Nikolic A and Pajic Z (2008) SSR markers in
characteri-sation of sweet corn inbred lines. Genetika 40:169-177. Stich B, Melchinger AE, Frisch M, Maurer HP, Heckenberger M
and Reif JC (2005) Linkage disequilibrium in European elite maize germplasm investigated with SSRs. Theor Appl Genet 111:723-730.
Stich B, Maurer H, Melchinger A, Frisch M, Heckenberger M, van der Voort J, Peleman J, Sørensen A and Reif J (2006) Comparison of linkage disequilibrium in elite European maize inbred lines using AFLP and SSR markers. Mol Breed 17:217-226.
Talbert PB and Henikoff S (2010) Centromeres convert but don’t cross. PLoS Biology 8:e1000326.
Taramino G and Tingey S (1996) Simple sequence repeats for germplasm analysis and mapping in maize. Genome 39:277-287.
Tautz D and Renz M (1984) Simple sequences are ubiquitous re-petitive components of eukaryotic genomes. Nucleic Acids Res 12:4127-4138.
Troyer AF (2001) Temperate corn. In: Hallauer AR (ed) Specialty Corns. CRC Press, Boca Raton, pp 393-466.
Wolfgruber TK, Sharma A, Schneider KL, Albert PS, Koo DH, Shi J, Gao Z, Han F, Lee H, Xu R, et al.(2009) Maize
centromere structure and evolution: Sequence analysis of centromeres 2 and 5 reveals dynamic loci shaped primarily by retrotransposons. PLoS Genetics 5:20.
Wright S (1978) Evolution and the genetics of populations: Vari-ability within and among populations. University of Chi-cago Press, ChiChi-cago, 590 pp.
Yeh FC, Yang RC and Boyle T (1999) Popgene: Microsoft Win-dows-based freeware for population genetic analysis release 1.31, University of Alberta, Alberta.
Yousef GG and Juvik JA (2002) Enhancement of seedling emer-gence in sweet corn by marker-assisted backcrossing of ben-eficial QTL. Crop Sci 42:96-104.
Zavattari P, Deidda E, Whalen M, Lampis R, Mulargia A, Loddo M, Eaves I, Mastio G, Todd JA and Cucca F (2000) Major factors influencing linkage disequilibrium by analysis of dif-ferent chromosome regions in distinct populations: Demog-raphy, chromosome recombination frequency and selection. Hum Mol Genet 9:2947-2957.
Zhang Q, Gao YJ, Yang SH, Ragab RA, Maroof MAS and Li ZB (1994) A diallel analysis of heterosis in elite hybrid rice based on RFLPs and microsatellites. Theor Appl Genet 89:185-192.
Zhang Q, Zhou Z, Yang G, Xu C, Liu K and Maroof SM (1996) Molecular marker heterozygosity and hybrid performance in indica and japonica rice. Theor Appl Genet 93:1218-1224.
Internet Resources
Maize genome database (MaizeGDB),
http://www.maizegdb.org.php (accessed July 28, 2011).
Associate Editor: Everaldo Gonçalves de Barros