Determination of genetic variability of traditional varieties
of Brazilian rice using microsatellite markers
Claudio Brondani, Tereza Cristina Oliveira Borba, Paulo Hideo Nakano Rangel
and Rosana Pereira Vianello Brondani
Empresa Brasileira de Pesquisa Agropecuária Arroz e Feijão, Santo Antônio de Goiás, GO, Brazil.
Abstract
The rice (Oryza sativa) breeding program of the Rice and Bean research center of the Brazilian agricultural company Empresa Brasileira de Pesquisa Agropecuária (Embrapa) is well established and provides new cultivars every year to attend the demand for improved high yielding varieties with tolerance to biotic and abiotic stresses. However, the elite genitors used to compose new populations for selection are closely related, contributing to the yield plateau reached in the last 20 years. To overcome this limit, it is necessary to broaden the genetic basis of the cultivars using diverse germplasm such as wild relatives or traditional varieties, with the latter being more practical because they are more easily crossed with elite germplasm to accelerate the recovery of modern plant types in the breeding lines. The objective of our study was to characterize the allelic diversity of 192 traditional varieties of Brazilian rice using 12 sim-ple sequence repeat (SSR or microsatellite) markers. The germplasm was divided into 39 groups by common name similarity. A total of 176 alleles were detected, 30 of which (from 23 accessions) were exclusive. The number of al-leles per marker ranged from 6 to 22, with an average of 14.6 alal-leles per locus. We identified 16 accessions as a mix-ture of pure lines or heterozygous plants. Dendrogram analysis identified six clusters of identical accessions with different common names and just one cluster with identical accessions with the same common name, indicating that SSR markers are fundamental to determining the genetic relationship between landraces. A subset of 24 landraces, representatives of the 13 similarity groups plus the 11 accessions not grouped, was the most variable set of geno-types analyzed. These accessions can be used as genitors to increase the genetic variability available to rice breed-ing programs.
Key words:Brazil, genetic resources, microsatellite markers,Oryza sativa.
Received: August 16, 2005; Accepted: March 15, 2006.
Introduction
Rice (Oryza sativa) genetic resources are widely available worldwide, this crop being cultivated between latitudes 55° N and 36° S in a variety of ecosystems, includ-ing irrigated, rainfed lowland, rainfed upland and flood-prone areas. Human selection and crop adaptation to di-verse environmental conditions have resulted in a large number of genotypes, and it has been estimated that about 120,000 rice varieties exist in worldwide (Khush, 1997). Rice production doubled between 1966 and 1990 due to the proliferation of highly productive cultivars, but the use of elite germplasm in breeding programs reduced the genetic variability available for selection and is believed to be the main factor for the leveling off of yield (Rangel et al., 1996). In addition, limited genetic diversity has lead to in-creased disease susceptibility and an increase in insect
pests. The use of rice genetic resources available at gene-banks is an important strategy for incorporating genetic variability into rice breeding programs, which can poten-tially generate new cultivars with broadened genetic basis and allows new and useful allelic combinations (McCouch, 2005). Crosses to broaden the genetic basis of rice also can promote the preservation of rare alleles that can be incorpo-rated in elite germplasm. The use of adapted rice landraces, as the primary source of variation into which desired char-acters present in modern cultivars are introgressed may be an effective strategy for producing cultivars adapted to dif-ficult production environments (Hawtinet al., 1997).
Rice is a very important source of carbohydrate and protein for Brazilians which was probably introduced to Brazil during Portuguese colonization around 1550 (Perei-ra, 2002). Subsequent cultivation has generated many local Brazilian varieties (landraces) adapted to different environ-ments, resulting in a regional fixation of distinctly favor-able alleles. To preserve this genetic variability, more than Genetics and Molecular Biology, 29, 4, 676-684 (2006)
Copyright by the Brazilian Society of Genetics. Printed in Brazil www.sbg.org.br
Send correspondence to Claudio Brondani. Embrapa Arroz e Fei-jão, Caixa Postal 179 75375-000 Santo Antônio de Goiás, GO, Brazil. E-mail: brondani@cnpaf.embrapa.br.
3,000 traditional Brazilian accessions have been collected during the last 30 years. These accessions are representa-tives of a variety of soil and climate conditions, including low temperatures in the South Region of Brazil, saline and dry soils in the Brazilian Northeast and low fertility acid soils in the Cerrado (Brazilian savanna) Region (Burleet al., 2001).
For the effective conservation of rice genetic re-sources it is important to characterize genetic variability in order to assist germplasm bank curators to preserve genetic diversity and for breeders to use it effectively (Olufowoteet al., 1997). Speed, reproducibility and the ability to detect genetic variation within and between accessions determine the utility of molecular techniques for germplasm bank management (Gilbertet al., 1999). The increasing avail-ability of highly polymorphic genetic markers and the de-creasing cost of genotyping provide powerful tools for finding the true biological relationship between individuals (Presciuttiniet al., 2002). Simple sequence repeat (SSR or microsatellite) markers provide a higher level of informa-tion compared with other classes of molecular markers (Rafalskiet al., 1996). In rice, more than 2,000 SSR mark-ers are available from SSR-enriched libraries and from the sequenced rice genome (McCouchet al., 2002). This high number of markers permits the selection of the most infor-mative and well-distributed SSR loci in the rice genome to be used in molecular analysis.
In the work described in this paper we used SSR markers to infer genetic variability in rice landraces with the objective of characterizing the allelic diversity of a sin-gle set of landraces from the entire collection of Brazilian rice landraces.
Material and Methods
Plant material
We investigated 192 Brazilian rice landrace acces-sions stored at the Rice and Bean Germplasm Bank at the Rice and Bean Research Center of the Brazilian agricul-tural company Empresa Brasileira de Pesquisa Agropecuá-ria (Embrapa Arroz e Feijão, Santo Antônio de Goiás, GO, Brazil). The acessions were divided into 39 groups based on their common names, but 44 accessions were not in-cluded in any of these groups (Table 1).
DNA extraction and SSR analysis
For each accession, DNA was extracted from the leaves of five plants, quantified and adjusted to a final con-centration of 3 ng mL-1 using the protocol described by
Brondaniet al. (2002). Two five-plant pools were made for each of the 192 accessions. The pooled DNA was used as a template for the SSR PCR reactions.
To select suitable SSR markers we used 40 SSR markers with high PIC values to genotype four rice geno-types (cultivars Cica-8, BR Irga 409, Primavera and BRS
Colosso) in order to select the SSR markers showing the most desirable characteristics (highest polymorphism, good band resolution and good distribution as regards all twelve rice chromosomes), the genotyping being carried out as described in the next paragraph. The codes of the primers selected were the following: RM9, RM11, RM22 (Panaudet al., 1996); RM204, RM207, RM223, RM229, RM247, RM252 (Chenet al., 1997); RM310 (Temnykhet al., 2000); and OG61 and OG106 (Brondaniet al., 2001).
The PCR reactions were conducted in a final volume of 13mL containing 0.3mM of each primer, 1 unit ofTaq
DNA polymerase, 0.2 mM of each dNTP, 1 mM TRIS-HCl (pH 8.3), 50 mM KCl, 1.5 mM MgCl2, 1.3mL of DMSO
(50% w/v) and 7.5 ng of template DNA. The PCR was per-formed in a PT-100 thermocycler (MJ Research) pro-grammed for one pre-cycle at 96 °C for 5 min, followed by 30 cycles of 94 °C for 1 min, 56 °C for 1 min and 72 °C for 1 min, with a final extension at 72 °C for 7 min. Amplifica-tion was checked by horizontal electrophoresis in 3.5% (w/v) agarose gel containing TBE (0.09 M TRIS-Borate and 2 mM EDTA, pH 8.3) and 0.2mg mL-1ethidium
bro-mide. Allelic polymorphism was detected in 4% (w/v) de-naturing polyacrylamide gels containing 7M urea and 1x TBE buffer, bands being visualized using silver staining (Bassamet al., 1991).
Statistical analysis
The number of alleles per locus and polymorphism information content (PIC) were estimated using the Ge-netic Data Analysis program (Lewis and Zaykin, 2000). The estimates of probability of identity (PI) were obtained using the Identity program (Sefc et al., 1997). The dendrogram was constructed from the genetic distance ma-trix obtained by Rogers distance as modified by Wright (1978), hereafter named Rogers-W distance coefficient. The accessions were grouped by cluster analysis using the unweighted pair group method with averages (UPGMA) (Weir, 1990) as implemented in the Numerical Taxonomy and Multivariate Analysis System (NTSYS) program (Rohlf, 1989). Tocher’s optimization method was per-formed using the Genes program (Cruz, 1997).
Results and Discussion
Traditional rice varieties, or landraces, have a high level of genetic heterogeneity compared to modern culti-vars. This genetic variability is very important for the sustainability of small farmers, because despite the low yield capacity, these varieties present high yield stability (Oka, 1991). Landraces are adapted to local, small-scale, low-input environments where the plant ideotype may dif-fer considerably from that developed for modern agricul-tural systems (Veteläinenet al., 1997). The evaluation of the genetic variability of accessions of landraces can pro-vide the basic information necessary to help genbanks
678
Genetic
variability
of
rice
landraces
Table 1- Brazilian rice landraces used in the simple sequence repeat (SSR) analysis. The landraces were grouped according to the similarity based of their common names. The state where the landraces were col-lected is shown in the third column and the cluster code in the dendrogram in the fourth column.
Group Common name State* Cluster Group Common name State* Cluster Group Common name State* Cluster Group Common name State* Cluster
1 1) 3 Meses GO A 7 49) Branco 4 Meses GO A 24 97) Guaíra GO A 39 145) Zebu PI A
2) 3 Meses Curto MG A 50) Branco Longo
Precoce
SP A 98) Guaíra Amarelo GO A 146) Zebu Branco MA A
3) 3 Meses Precoce GO B 51) Branquinho BA - 99) Guaíra Branco GO A 147) Zebu Ligeiro PI A
4) 4 Meses GO A 8 52) Brejeiro MG - 25 100) IAC do Produtor MS A 148) Zebu Pingo
d’água
RR A
5) 4 Meses Antigo MT A 53) Brejeiro MG E 101) IAC 1246 RO A - 149) Bacaba PI A
6) 60 Dias GO A 9 54) Buriti PI A 102) IAC 47 MS A - 150) Bambu RO A
7) 90 Dias AL A 55) Buriti Vermelho MA E 103) IAC 25 Branco PI M - 151) Barriga Branca MG B
8) Noventinha MS B 10 56) Caiana Grande AL J 26 104) IR-8 PI K - 152) Batatais PR A
9) 100 Dias GO A 57) Cana Roxa GO A 105) IR-8 do Padre PI K - 153) Beira Campo MT A
2 10) De Abril RJ J 58) Cana Roxa
Vermelha
MA A 27 106) Japonês RS - - 154) Boliviano MT A
11) De Maio MS J 11 59) Canela de Aço AC A 107) Japonês CE A - 155) Cacho Grande MT A
3 12) Agulha CE B 60) Canela de Ferro AC - 108) Japonês Claro RO B - 156) Carijó GO A
13) Agulha MT A 12 61) Carioca RJ A 28 109) Ligeirinho PI D - 157) Casca Branca MG A
14) Agulha MT A 62) Carioquinha GO E 110) Ligeiro MA F - 158) Chifre de Veado MS A
15) Agulha Amarelo AM A 63) Carioquinha
Amarelo
GO A 111) Ligeiro Vermelho PI B - 159) Comprido GO A
16) Agulha Vermelho CE M 64) Carioquinha Areia GO G 29 112) Macaba Ligeiro PI B - 160) Comum GO A
17) Agulhão AL J 65) Carioquinha
Vermelho
GO A 113) Macaba
Maranhense
PI B - 161) De Morro ES A
18) Agulhão RR A 13 66) Carolina PI A 114) Macaba Miúdo PI K - 162) Dez Anos MT A
19) Agulhão RO A 67) Carolina Bico
Preto
MS A 115) Macapa PI B - 163) Doidão ES J
20) Agulhão RO K 68) Carolina Longo MS A 30 116) Maranhão PI B - 164) Escrevim PI J
21) Agulhinha AC I 14 69) Casado MA A 117) Maranhão Branco PI B - 165) Farroupilha RS
-22) Agulhinha Amarelo
MS I 70) Casado Ligeiro PI A 118) Maranhense PI B - 166) Grão de Ouro GO B
23) Agulhinha Anão RO A 15 71) Catetão MT - 31 119) Matão MG L - 167) Guapa RO A
24) Agulhinha do Paraguai
MT A 72) Catetinho MG G 120) Mato Grosso PI A - 168) Iguapé GO A
25) Agulhinha Vermelho
Brondani
et
al.
679
Table 1 (cont)
Group Common name State* Cluster Group Common name State* Cluster Group Common name State* Cluster Group Common name State* Cluster
4 26) Amarelão MS A 74) Cateto Amarelo PR H 122) Meruim Dourado CE B - 170) Lageado PI
-27) Amarelão 90 Dias MS A 75) Cateto Bico Preto SP A 123) Meruim II AC A - 171) Mangote RJ B
28) Amarelo 3 meses GO A 76) Cateto Seda SP H 33 124) Montanha AM A - 172) Mineiro AC A
29) Amarelão Bico Preto
AM A 16 77) Chatão AM A 125) Montanha Potrão MS A - 173) Miúdo Branco MA B
30) Amarelão Bico Preto 3 Meses
MT A 78) Chatão Vermelho AM A 34 126) Mucuim PI B - 174) Nanicão ES
-31) Amarelão Precoce SP A 79) Chatinho AL J 127) Muruim AM I - 175) Pacholinha RJ F
32) Amarelinho GO A 80) Chatinho Branco SE A 35 128) Neném MA F - 176) Paga Dívida PI L
33) Amarelo AM A 17 81) Chorinho MG A 129) Nenezinho
Branco
MA B - 177) Palha Murcha PI
-34) Amarelo Bico Preto
GO A 82) Chorinho
Americano
MG C 36 130) Prata CE B - 178) Patrão RO C
35) Amarelo Branco SC K 83) Chorinho Apículo
Escuro
MG C 131) Prata Ligeiro CE B - 179) Paulista AC A
36) Amarelo Precoce SP A 18 84) Come Cru RR A 132) Prata Roxa MG A - 180) Peludo GO A
5 37) Anão CE A 85) Come Cru PI A 133) Pratão MT C - 181) Pindorama GO A
38) Anão AL K 86) Come Cru Branco MA C 134) Pratão RO A - 182) Pingo de Ouro PI B
39) Anãozinho TO I 19 87) Cutião PI A 135) Pratão MT A - 183) Precoce BA
-6 40) Bico Ganga GO A 88) Cutião Vermelho MA A 136) Pratão 4 Meses AM A - 184) Preto RO A
41) Bico Preto AC A 20 89) Douradão GO A 137) Pratão Precoce GO A - 185) Rabo de Carneiro GO A
42) Bico Preto Cana Roxa
MS A 90) Douradinho AC - 138) Pratinha GO D - 186) Samambaia ES D
43) Bico Preto Roxo MA A 21 91) Ferrão Preto GO A 37 139) Santa América MT A - 187) Saquarema PI K
44) Bico Roxo BA J 92) Ferrão Preto
Precoce
SP A 140) Santa América GO A - 188) Serra Azul MG G
45) Bico Roxo Branco GO A 22 93) Ferrugem MT A 38 141) Vermelhão
Taiano
RR A - 189) Talo Roxo PB A
46) Bico Torto RS A 94) Ferrujão MS B 142) Vermelhinho PI D - 190) Tomba Morro MG A
7 47) Branco GO A 23 95) Goianinho MS A 143) Vermelhinho 3
Meses
MT A - 191) Toro PB E
48) Branco 3 Meses MG A 96) Goiano MA B 144) Vermelho AC A - 192) Venez Branco MG A
tiply and properly conserve these genetic resources. This will also help breeding programs to plan crosses to incorpo-rate this variability into the genetic background of elite rice lines, which in turn will generate new rice cultivars.
In our analysis of SSR variation we detected 176 al-leles in the 192 landrace accessions investigated, the num-ber of alleles per marker ranging from 6 (RM22) to 22 (OG61 and OG106), with an average of 14.7 alleles per lo-cus. The PIC varied from 0.33 (RM252) to 0.94 (OG106), with an average of 0.73 (Table 2). The number of alleles and PIC are higher than that reported in previous works (Xu
et al., 2004; Yuet al., 2003; Niet al., 2002; Coburnet al., 2002; Panaudet al., 1996). The higher number of alleles and PIC detected in the present work indicate that the Bra-zilian rice landraces are a good source of genetic variability to be explored in crosses with elite rice germplasm. We also detected 30 private or exclusives alleles in 23 of the acces-sions (Table 2). The molecular data were generally corre-lated with variation at the agro-morphological level in the crop plants and therefore provide good guidance on the dis-tribution of useful variation as well as on the existence of co-adapted gene complexes (Hawtinet al., 1997). Despite the fact that the SSR markers used in our study are consid-ered neutral (i.e., not functionally related to any trait) the genomic fingerprinting profile of each plant does not vary from one environment to another, reflecting the capacity of an individual plant or population to adapt (Virk et al., 1996). This direct association between the fingerprint of an accession and the phenotypic response to a target environ-ment is caused by linkage disequilibrium, which in rice is mainly due to autogamous reproduction (Ford-Lloydet al.,
1997). Another important aspect to consider is the differentiation of characters that are highly subject to natu-ral selection, such as tolerance to biotic and abiotic stresses occurring during the cultivation of rice landraces. In addi-tion, neutral markers can be used to establish the evolution-ary past of varietal groups and to account for pre-selection of the germplasm to be used in breeding programs (Glaszmannet al., 1996).
The use of DNA pools from five plants was very ef-fective at evaluating the allelic diversity of the rice acces-sions and the analysis of two pools per accession detected 16 traditional varieties which were heterogeneous for at least two SSR markers (Table 3). Then a second round of SSR analysis was performed to individually characterize the five individual plants present in one or two pools of each 16 accessions. The pool heterogeneity was more fre-quently related to the occurrence of homozygous plants for different alleles than to heterozygous plants (Table 3). The accessions Agulha, Japonês, Prata Roxa and Venez Branco showed the highest number of heterogeneous pools (Table 3). Pooling plants is a very important strategy for speeding up the genotyping of landraces, which due to their higher genetic variability requires the analysis of more individual plants for each accession to produce a more realistic evalu-ation of the variability within the germplasm of a particular acession.
The cluster analysis of 192 accessions produced an average Rogers-W distance coefficient of 0.77, and was used to establish a cut-off threshold to determine the larity groups of the dendrogram. This limit formed 13 simi-larity groups (A to M). Eleven accessions were not included
680 Genetic variability of rice landraces
Table 2- Chromosomal location (CL), number of alleles, polymorphism information content (PIC), probability of identity (PI) and private alleles detected with 12 simple sequence repeat (SSR) markers used for genotyping 192 rice landrace accessions.
Marker CL Alleles PI PIC Private Alleles*
RM9 1 17 0.089 0.82 Saquarema (1; 142 bp), Palha Murcha (1; 144 bp), IAC (0.13;130 bp), Brejeiro (0.5; 180 bp)
RM207 2 15 0.168 0.75 Japonês (0.32; 112 bp), Chatão (0.23; 132 bp), Cateto (0.08; 110 bp)
RM22 3 6 0.374 0.6 Meruim (0.08; 184 bp)
RM252 4 11 0.467 0.33 Precoce (1; 266 bp), Prata (0.09; 256 bp), Palha Murcha (1; 230 bp), Caiana Grande (0.5; 228 bp)
OG61 5 22 0.042 0.89 Farroupilha (1; 98 bp)
RM204 6 17 0.29 0.54 Nanicão (1; 126 bp), Lageado (1; 120 bp), Goiano (0.25; 134 bp), Agulha (0.04; 156 bp)
RM11 7 14 0.237 0.62 Venez Branco (0.2; 140 bp), Japonês (0.03; 154 bp), Casado (0.5; 134 bp)
RM223 8 10 0.106 0.82 Precoce (1; 170 bp), Japonês (0.05; 150 bp), Branco (0.2; 146 bp)
OG106 9 22 0.013 0.94
-RM304 10 16 0.062 0.86 Venez Branco (1; 130 bp), Carioca (0.2; 146 bp), Brejeiro (0.5; 120 bp)
RM229 11 9 0.121 0.79
-RM247 12 17 0.078 0.83 Nanicão (1; 144 bp), Chorinho (0.33; 170 bp), Amarelo (0.05; 150 bp), Agulha (0.08; 152 bp)
Total - 176 6.2 10-12
in similarity groups: Catetão (accession 71), Brejeiro (52), Douradinho (90), Branquinho (51), Canela de Ferro (60), Farroupilha (165), Japonês (106), Palha Murcha (177), Nanicão, (174) Lajeado (170), and Precoce (183) (Table 1). Group A was formed by 135, or 70% of analyzed acces-sions, and included representatives of 31 common name groups. Some common name groups containing few acces-sions clustered in the same similarity group: De Maio and De Abril (group J), Carolina (group A), Casado (group A), Cutião (group A), Ferrão Preto (group A), IR-8 (group K), Macabá (group B), Maranhão (group B), Montanha (group A), Santa América (group A) and Zebu (group A). Never-theless, in groups with a higher number of accessions, such as Meses, Agulha, Amarelo, among others, the accessions were distributed in different similarity groups (Table 1).
Six clusters were composed of identical accessions: 1) Cacho Grande (155), Dez Anos (162), Carolina (66) and Chatão (77); 2) Bico Roxo (45), Bico Torto (46) and Bran-co (47); 3) Guapa (167) and IAC 1246 (101); 4) Mineiro (172) and Montanha (124); 5) Paulista (179), Pindorama (181) and Pratão 4 Meses (136); and 6) Guaíra (97) and Guaíra Amarelo (98) (data not shown). The entire set of SSR markers used in this work produced a combined prob-ability of identity (PI) of 6.2x10⁻¹²(Table 2), which is the probability of having two individuals with the same geno-type in a group of accessions. The fact that the PI value is very low indicates that the accessions of the seven clusters cited above are identical despite their different common names, it being already known that the two Guaíra acces-sions (97 and 98) are identical. The most common case ob-served in our study was accessions with the same name that
were not genetically identical. This probably occurred for two reasons: a) When a farmer gives the name of the land-race to the germplasm collector, the farmer is influenced by the name used regionally for the accession, so although names can vary from county to county the germplasm can be the same or b) due to events operating independently or simultaneously,e.g.seed mixture, cross pollination, selec-tion and genetic drift caused by reduced sampling of seeds to be used in the next rice crop season. In this last case, oc-curring in specific environments, an original landrace or old variety released to different farmers, after years of suc-cessive cultivation, would generate populations with a ge-netic constitution different from the original genotype. This adaptation, i.e. the movement of a population towards a phenotype that best fits the population within a specific en-vironment, may select the best gene or gene combinations which can be explored by breeding programs.
We used Tochers optimization method to identify the most variable accessions present in the entire set of 192 ge-notypes and to appreciate the extent of genetic variability and select a starting point (i.e. accession, or accessions) within the collection for a breeding program. This test was conducted using the SSR marker genetic distance values of all pairwise combinations of the 192 genotypes. The final set of genotypes obtained by Tocher’s method yielded 14 accessions, with an average Rogers-W distance coefficient of 0.76, similar to the average Rogers-W distance coeffi-cient of 0.77, obtained when the 192 genotypes were ana-lyzed (Figure 1). However, we observed that of the 14 accessions, eight (3 Meses, De Morro, Douradão, Anão, Chatão, Branco, 90 Dias and Amarelo) had previously been
Brondaniet al. 681
Table 3- Rice landrace accessions that showed heterogeneous pooled DNA detected by simple sequence repeat (SSR) markers.
Accessions (accession number) Number of plants1 SSR marker
Agulha (12) 10 (2) RM 204*, RM 207, RM 223, RM 229, RM 247, RM 252, OG 61*
Agulhão (19) 5 RM 9, RM 207, RM 223, OG 106
Bico Preto (41) 10 RM 11, RM 223, RM 252, OG 61, OG 106
Chatinho (79) 10 (1) RM9, RM 207, RM229, RM 247*, RM 252
Chorinho (81) 10 (2) RM 247, OG 61*, OG 106*
Come Cru Branco (86) 9 RM 9, RM 11, OG 61, OG 106
De Maio (11) 10 RM 11, RM 207, RM 223, RM 252
Doidão (164) 10 (1) RM 207*, RM 223
Japonês (107) 10 (1) RM 11*, RM 207, RM 229, RM 247, RM 252, OG 61, OG 106
Japonês Claro (108) 8 RM 9, RM 11, RM 304, OG 106
Macaba Marenhense (113) 8 (2) RM 9, RM 11*, RM 22, RM 223*, OG 106*
Mato Grosso (120) 9 RM 22, RM 207, OG 61, OG 106
Meruim II (123) 10 RM 9, RM 11, RM 22, RM 223, RM 229
Prata Roxa (132) 8 (1) RM 207*, RM 229, RM 247, RM 252*, RM 304*, OG 61, OG 106*
Serra Azul (188) 9 RM 9, RM 11, RM 223
Venez Branco (192) 10 RM 11, RM 207, RM 229, RM 247, RM 252, OG 61, OG 106
1
classified in similarity Group A, two (Buriti Vermelho and Brejeiro) in Group E, one (Ligeiro) in group F, one (Mu-cuim) in group B, one (Cateto Amarelo) in group H and one (Japonês) had not been included in any similarity group (Figure 1).
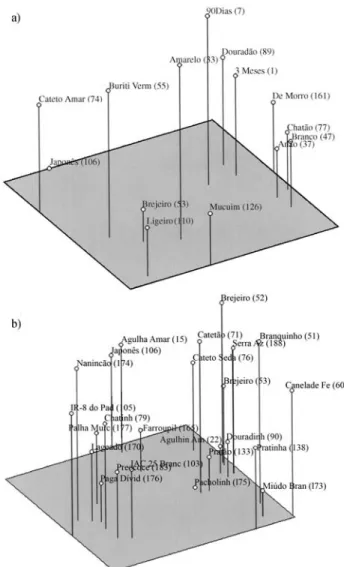
When we analyzed a set of genotypes (one represen-tative of each of 13 similarity groups plus the 11 ungrouped accessions) we obtained a Rogers-W distance coefficient average of 0.90, higher than the entire set of 192 and 14 ac-cessions from Tocher’s method (Figure 2). This result clearly shows that an efficient way to select genetically dis-tinct genotypes in a large collection of germplasm is to first analyze all accessions and then choose representative accessions from each cluster. In order to decide which
ac-cession should be chosen from each group, agronomic per-formance traits should be effective in selecting genotypes that will produce potentially even better results in breeding programs. All sets of accessions were well distributed spa-tially according to principal component analysis (Figure 3). In terms of genetic variability based on SSR marker geno-typing we recommended the 24 accessions (set of acces-sions representative of each similarity group plus the unclassified accessions) for use as genitors in crosses with the elite rice genotypes to increase the genetic variability available for selection, and also to increase the possibility of detecting transgressive segregation. However, for such variability results in effective genetic gain, further experi-ments, such as diallel crosses, should be carried out to de-termine the combining ability of the traditional varieties and to prove that the genetic variability found with SSR markers is effectively related to good field performance of lines derived from elite x traditional variety crosses.
682 Genetic variability of rice landraces
Figure 1- Dendrogram based on Rogers-W distance coefficient of a sub-set of 14 rice landraces.
Figure 2- Dendrogram based on Rogers-W distance coefficient of a sub-set of 24 rice landraces.
One of the implications of SSR analysis for landrace conservation is that the genotyping of landraces can detect differences that cannot be detected by traditional methods of morphological characterization used routinely in genebanks. At Embrapa Rice and Bean, 12 morphological descriptors, which are traits with high heritability, such as pilosity of the leaves, presence of awns, etc., are used for rice (Fonsecaet al., 1981). Another relevant aspect of geno-typing using molecular markers, particularly SSRs, is the ability of this methodology not only to analyze many acces-sions simultaneously but also to investigate individuals plants of a specific accession. The knowledge of within-accession variability is important for conservation pur-poses, because it is possible to determine the most geneti-cally variable accessions which would demand an additional effort of sampling a higher quantity of seeds in order to preserve this genetic variability and prevent ge-netic drift during routine periodic germplasm multiplica-tion. The analysis of individual plants of an accession is also relevant for breeding purposes, since homozygous plants can be selected and used as genitors in crosses with elite rice genotypes. The ex situ collection of Embrapa Genebank is preserving for the future the genetic variability of many landraces that are no longer cultivated by farmers. At the beginning of the 1970s the estimated number of rice varieties cultivated by Brazilian farmers was around 3,000 (Fonsecaet al., 1982). There are no estimates of the culti-vated varieties today but there is a consensus that the num-ber is much lower than that, following the falling trend in the number of small farmers who traditionally cultivate landraces. Due to the size of Brazil, there are regions that still need to be included in collection expeditions, in order to increase the Brazilian sampling coverage of such valu-able germplasm.
Acknowledgments
Tereza Cristina Oliveira Borba was the recipient of a scholarship from the Brazilian agency Conselho Nacional de Desenvolvimento Científico e Tecnológico (CNPq).
References
Bassam BJ, Caetano-Anolles G and Gresshoff PM (1991) Fast and sensitive silver staining of DNA in polyacrilamide gels. Anal Biochem 196:80-83.
Brondani C, Brondani RPV, Rangel PHN and Ferreira ME (2001) Development and mapping ofOryza glumaepatula-derived microsatellite markers in the interspecific cross O. glumaepatulaxO. sativa. Hereditas 134:59-71.
Brondani C, Rangel PHN, Brondani RPV and Ferreira ME (2002) QTL mapping and introgression of yield-related traits from Oryza glumaepatulato cultivated rice (Oryza sativa) using microsatellite markers. Theor Appl Genet 104:1192-1203. Burle MB, Fonseca JR, Alves RBN, Cordeiro CMT, Freire MS,
Melo LAMP, Rangel PHN and Silva HT (2001) Carac-terização de Germoplasma de Arroz de Acordo com o
Am-biente de Origem: Mapeamento em SIG. Série Documentos n. 63, Embrapa, Brasília, 51 pp.
Chen X, Temnykh S, Xu Y, Cho YG and McCouch SR (1997) De-velopment of a microsatellite framework map providing ge-nome-wide coverage in rice (Oryza sativaL.). Theor Appl Genet 95:553-567.
Coburn JR, Temnykh SV, Paul EM and McCouch SR (2002) De-sign and application of microsatellite marker panels for semiautomated genotyping of rice (Oryza sativaL.) Crop Sci 42:2092-2099.
Cruz CD (1997) Programa Genes: Aplicativo Computacional em Genética e Estatística. Editora UFV, Viçosa, 442 pp. Fonseca JR, Rangel PHN and Prabhu AS (1981) Características
botânicas e agronômicas de cultivares de arroz (Oryza sativa L.). Circular Técnica n. 14, Embrapa, Goiânia, 32 pp. Fonseca JR, Rangel PHN, Bedendo IP, Silveira PM, Guimarães
EP and Coradin L (1982) Características botânicas e agro-nômicas de cultivares e raças regionais de arroz (Oryza sativa L.) coletadas no Estado do Maranhão. Boletim de Pesquisa n. 1, Embrapa, Goiânia, 42 pp.
Ford-Lloyd BV, Jackson MT and Newbury HJ (1997) Molecular markers and the management of genetic resources in seed genebanks: A case study of rice. In: Callow JA, Ford-Lloyd BV and Newbury HJ (eds) Biotechnology and Plant Genetic Resources – Conservation and Use. CAB, Wallingford, pp 103-118.
Glaszmann JC, Mew T, Hibino H, Kim CK, Dios-Mew TIV, Cruz CMV, Notteghem JL and Bonman JM (1996) Molecular variation as a diverse source of disease resistance in culti-vated rice. Proceedings of the Third International Rice Ge-netics Symposium, Manila, Philippines, pp 460-465. Gilbert JE, Lewis RV, Wilkinson MJ and Caligari PDS (1999)
Developing an appropriate strategy to assess genetic vari-ability in plant germplasm collections. Theor Appl Genet 98:1125-1131.
Hawtin G, Iwanaga M and Hodgkin T (1997) Genetic resources in breeding for adaptation. In: Tigerstedt PMA (ed) Adaptation in Plant Breeding. Kluwer, New York, pp 277-288. Khush GS (1997) Origin, dispersal, cultivation and variation of
rice. Plant Mol Biol 35:25-34.
McCouch SR, Teytelman L, Xu Y, Lobos KB, Clare K, Walton M, Fu B, Maghirang R, Li Z, Xing Y, Zhang Q, Kono I, Yano M, Fjellstrom R, DeClerk G, Schneider D, Cartinhour S, Ware D and Stein L (2002) Development and mapping of 2240 new SSR markers for rice (Oryza sativaL.). DNA Re-search 9:199-207.
McCouch SR (2005) Diversifying selection in plant breeding. Plos Biol 2:1507-1512.
Ni J, Colowit PM and Mackill DJ (2002) Evaluation of genetic di-versity in rice subspecies using microsatellite markers. Crop Sci 42:601-607.
Oka HI (1991) Genetic diversity of wild and cultivated rice. In: Khush GS and Toenniessen GH (eds) Rice Biotechnology. IRRI, Los Baños, pp 55-81.
Olufowote J, Xu YX, Chen X, Park WD, Beachell HM, Dilday RH, Goto M and McCouch SR (1997) Comparative evalua-tion of within-cultivar variaevalua-tion of rice (Oryza sativaL.) us-ing microsatellite and RFLPs markers. Genome 40:370-378. Panaud O, Chen X and McCouch SR (1996) Development of microsatellite markers and characterization of simple
quence length polymorphism (SSLP) in rice (Oryza sativa L.). Genome 252:597-607.
Pereira JA (2002) Cultura do Arroz no Brasil – Subsídios para a sua História. Embrapa, Teresina, 226 pp.
Presciuttini S, Toni C, Tempestini E, Verdiani S, Casarino L, Spinetti I, De Stefano F, Domenici R and Bailey-Wilson JE (2002) Inferring relationships between pairs of individuals from locus heterozygosities. BMC Genetics 3:23.
Rafalski JA, Vogel JM, Morgante M, Powell W, Andre C and Tingey SV (1996) Generating and using DNA markers in plants. In: Birren B and Lai E (eds) Analysis of Non-Mam-malian Genomes – A Practical Guide. Academic Press, New York, pp 75-134.
Rangel PH, Guimarães EP and Neves PCF (1996) Base genética das cultivares de arroz (Oryza sativaL.) irrigado do Brasil. Pesq Agropec Bras 31:349-357.
Rolf FJ (1989) NTSYS-PC: Numerical Taxonomy and Multi-variate Analysis System. Exeter Publisher, New York, 126 pp.
Sefc KM, Steinkellner H, Wagner HW, Glössl J and Regner F (1997) Application of microsatellite markers to parentage studies in grapevine. Vitis 36:179-183.
Temnykh S, Park WD, Ayres N, Cartinhour S, Hauck N, Lipovich L, Cho YG, Ishii T and McCouch SR (2000) Mapping and genome organization of microsatellite sequences in rice (Oryza sativaL.). Theor Appl Genet 100:697-712.
Veteläinen M, Nissilä E, Tigerstedt PMA and Bothmer R (1997) Utilization of exotic germplasm in Nordic barley breeding and it consequences for adaptation. In: Tigerstedt PMA (ed) Adaptation in Plant Breeding. Kluwer, New York, pp 289-295.
Virk PS, Ford-Lloyd BV, Jackson MT, Pooni HS, Clemeno TP and Newbury HJ (1996) Predicting quantitative variation within rice germplasm using molecular markers. Heredity 76:296-304.
Xu Y, Beachell H and McCouch SR (2004) A marker-based ap-proach to broadening the genetic base of rice in the USA. Crop Sci 44:1947-1959.
Yu SB, Xu WJ, Vijayakumar CHM, Ali J, Fu BY, Xu JL, Jiang YZ, Marghirang R, Domingo J, Aquino C, Virmani SS and Li ZK (2003) Molecular diversity and multilocus organiza-tion of the parental lines used in the Internaorganiza-tional Rice Mo-lecular Breeding Program. Theor Appl Genet 108:131-140. Weir BS (1990) Genetic Data analysis. Sinauer Associates,
Sun-derland, 230 pp.
Wright S (1978) Evolution and the genetics of populations. v. 4. Variability Within and Among Natural Populations. Univer-sity of Chicago Press, Chicago, 360 pp.
Internet Resources
Lewis PO and Zaykin D (2000) Genetic Data Analysis: Computer Program for the Analysis of Allelic Data. Version 1.0 (d15) Available from http://alleyn.eeb.uconn.edu/gda/2000.
Associate Editor: Everaldo Gonçalves de Barros