Contributions of weather variables for specific adaptation of rubber tree
(
Hevea brasiliensis
Muell.- Arg) clones
P.M. Priyadarshan
Rubber Research Institute of India, Regional Station, Agartala, India.
Abstract
The specific adaptation of 15 rubber tree (Hevea brasiliensis) clones was assessed by analyzing yield during a normal year (1997-98) and a year (1998-99) in which the yield was exceptional. Differences in yield in response to changes in weather conditions over the years were evident with clones RRII 203, RRIM 703, PB 5/51 and PB 235 which all exhibited a negative trend with increasing wind velocity during 1997-98, these clones also exhibited a negative correlation with minimum temperature during 1998-99. The prominent yield differences across the years made selection based on both yield and stability inevitable through computing weather variables and environmental index as covariant. To determine the contribution of variable(s) to genotype-environment (GE) interactions, the GE interaction was partitioned into heterogeneity and residual GE interaction. Heterogeneity only for environmental index was highly significant (p = 0.01), meaning that stability or instability of clones was due to a linear effect of the environmental index. The non-significant values of heterogeneity for the weather variables revealed that none of these factors individually was sufficient to explain heterogeneity. A QBASIC computer program called STABLE was used to select simultaneously for yield and stability. Clones PB 235, RRII 118, RRII 203, RRIM 703 and RRIM 600 were stable over the years investigated.
Key words:rubber clones, weather variables, specific adaptation,Hevea, stability, environmental index.
Received: January 20, 2003; Accepted: August 25, 2003.
Introduction
The importance of using selection procedures to as-sess the specific adaptation of plants to moderate or mar-ginal conditions has been discussed by Ceccarelli (1994). Estimation of specific adaptation is normally based on ge-notype-environment (GE) interactions, although the parti-tioning of genotypic effects and phenotypic plasticity effects in response to changes in the environment is debat-able (Vega, 1996). Although yield is the primary attribute evaluated in agricultural GE interaction studies, it is not solely under genetic control, being modulated by geno-type-genotype (GG) and genotype-environment (GE) inter-actions as well as physiological and biochemical processes controlled by specific genes (Blum, 1988). In rubber tree (Hevea brasiliensis), these processes are even more com-plex because yield is based on latex production.
Tripura state in Northeast India (22-24° N, 91-92° E) is a non-traditional environment for rubber cultivation with sub-optimal conditions (Raoet al., 1993; Priyadarshanet al., 1998a; Priyadarshan, 2003), where H. brasiliensis
clones have different yields compared with traditional rub-ber-growing areas because of specific adaptation (Priyadarshanet al., 1998b). According to Priyadarshanet al. (2000), two yield regimes are prevalent in Tripura state, low-yielding Regime I that occurs from May to September (sub-optimal environment) and high-yielding Regime II that occurs from October to January (optimal environ-ment). This significant difference in yield is caused by the range of latitude and longitude covered by the state, which results in areas that are sub-optimal. It is possible to control the edaphic factors at will while the climatic attributes are uncontrollable but predictable. The responses of rubber trees to this type of environment can be assessed by mea-suring phenotypic attributes such as the girth of the tree and/or the yield of latex and analyzing resulting GE interac-tions. Such ontogenetic changes occur in response to changes in the seasons and weather that prevents important stages in the development of the plant coinciding with ad-verse environmental conditions (Robertset al., 1993). In Tripura state, selecting rubber clones that have specific ad-aptation traits is vital since the exceptional climate of Tripura also offers low- and high-yielding environments (Priyadarshanet al., 1998b). Ceccarelli (1994), states that genotypes exhibiting high yield-potential in otherwise
www.sbg.org.br
Send correspondence to P.M. Priyadarshan. Rubber Research In-stitute of India, Regional Station, 799 006, Agartala, India. E-mail: [email protected].
low-yielding environments should be preferred when se-lecting for specific adaptation.
Although GE interactions can be assessed by analyz-ing phenotypic stability, only very few papers have been published on how weather variables affect GE interactions in perennial crops. Deviet al. (1998) investigated the im-pact of weather variables on the rubber yield of a polyclonal rubber seedling population and concluded that both tem-perature and evaporation influenced yield. In another study, Priyadarshanet al.(2000) found that minimum tempera-ture, evaporation and wind velocities were negatively cor-related with dry rubber yield under the conditions found in Tripura state. They also found that the GE interactions that occurred were of the cross-over type. The major factors (covariants) that contribute to heterogeneity (non-additivity) in GE interactions can be determined using a BASIC program developed by Kang (1988). Kang (1993) developed a statistic called YSior yield-stability statistic to
simultaneously select for yield and stability. Kang and Magari (1995) wrote a QBASIC program that allows the calculation of the YSistatistic. The present study evaluated
the impact of weather variables (minimum temperature, wind velocity, evaporation) on the yield of rubber in Tripura during a normal year (1997-98) and an exception-ally high-yielding year (1998-99) in relation to changed macro-environmental attributes.
Material and Methods
The experiment was conducted at the Regional Re-search Farm of the Rubber ReRe-search Institute of India at Taranagar (Tripura State, North East India - 23°53’ N; 91°15’ E; 30 m above sea level (a.s.l.). For this research, yield data of dry rubber during a normal year (1997-98) and an exceptionally high-yielding year (1998-99) was used. Yielding period for rubber in Tripura is from May to Janu-ary. The trial involved 15 clones from different geographic origins (Table 1), which had been planted during 1979 in a completely randomized design using a 5 x 5 m spacing be-tween plants. Initially 40 trees per clone were planted that were multiplied by bud grafting. Latex was collected from each tree of each clone once a month, coagulated, squeezed through rollers to remove excess water, dried in a smoke house, weighed and mean dry rubber yield in grams per tree per tap (g tree-1 tap-1) calculated. Data on three weather variables (minimum temperature, wind velocity and evapo-ration) were collected each day using standard meteorolog-ical methods (Raoet al., 1993).
Analysis of variance and other statistical calculations were done using standard procedures (Snedecor and Cochran, 1980). Genotype-environment (GE) interaction was partitioned intoσi2components that were assigned to each genotype using Kang’s BASIC program (Kang, 1988). The σi2 is Shukla’s stability variance statistic
(Shukla, 1972). The program calculates stability variance (σi2) prior to and after the use of a covariant (si2) and analy-sis can be used to determine the major factor (covariant) that contributes to heterogeneity in the GE interactions. In this case, weather variables were used as covariants and an analysis was also made using environmental index (Xj – X.., where Xjis the mean yield of all clones in environment
jand X.. is the mean of all clones across all environments) as a default covariant to remove heterogeneity (non-additivity or a linear effect of a covariant) from the GE in-teraction (Kang and Gorman, 1989). The program STABLE was used to simultaneously select for yield and stability (Kang, 1993; Kang and Magari, 1995), which is based onσi2of Shukla (1972).
Results and Discussion
This investigation was conducted not only to compare the yield of clones during a year (1997-98) when the yield was normal and a year (1998-99) when the yield was excep-tionally high but also to gauge the stability of yield of the different clones. Since the edaphic factors (soil type, tex-ture, drainage etc.) remained the same during the two years, it is probable that the exceptional yield during 1989-99 was due to a favorable macro-environment (e.g., climatic condi-tions). An earlier study on the yielding trends of these clones established that minimum temperature, wind
veloc-Table 1- Details of the clones investigated.
Country/clone Parentage
Indian
RRII 5 Primary
RRII 105 Tjir 1 x Gl 1
RRII 118 Mil 3/2 x Hil 28
RRII 203 PB 86 x Mil 3/2
Malaysian
G l 1 Primary
PB 5/51 PB 56 x PB 24
PB 86 Primary
PB 235 PB 5/51 x PB S/ 78
RRIM 600 Tjir 1 x PB 86
RRIM 605 PB 49 x Tjir 1
RRIM 703 RRIM 600 x RRIM 500
Indonesian
GT 1 Primary
Sri Lankan
RRIC 52 Primary
RRIC 105 Tjir 1 x RRIC 52
Liberian
ity and evaporation were the key attributes contributing to fluctuations in rubber yield in Tripura (Priyadarshanet al., 2000). In any year, yields are lower during May to Septem-ber (Regime I) and higher during OctoSeptem-ber to January (Re-gime II), high yields being mainly due to the lower temperatures (23-26 °C) during the cooler winter months of October to January because lower temperatures stimulate prolonged latex flow, it having been established by Shuochang and Yagang (1990) that temperatures in the range of 18-24 °C are conducive to higher latex flow.
Effect of climatic variables on yield
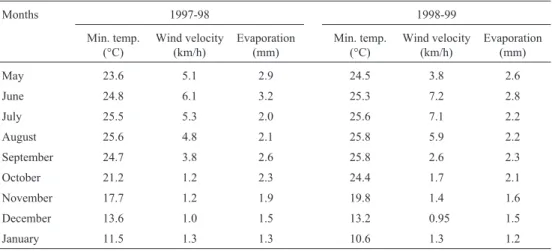
The monthly mean values of minimum temperature, wind velocity and evaporation are given in Table 2. A vari-ety of relationships was evident from the calculated corre-lations between yield and weather variables. For example, during 1997-98 none of the clones exhibited a correlation between yield and evaporation but almost all clones showed a significant negative correlation between yield and wind velocity (i.e., the higher the wind velocity, the lower the yield), with clones RRII 203, RRIM 703, PB 5/51 and PB 235 giving highly significant correlations (Table 3). When we examined the 1998-99 data, RRII 105, RRII 118, RRIM 605, RRIC 52, RRIC 105 and Gl 1 exhibited signifi-cant negative correlations between yield and minimum temperature,i.e., the lower the temperature the higher the yield. Although the relationship between yield and wind velocity was not as important as in 1997-98 (Table 4).
These differences in yield should be seen in the light of the effects that climatic variables have on the mi-cro-environment, the lower yields during 1997-98 probably being caused by the higher minimum temperature and stronger winds that reduced atmospheric vapor pressure and hence the higher turgour pressure, being directly pro-portional to the osmotic pressure of the laticifers that con-trol latex flow (Jacobet al., 1998). On the other hand, lower wind velocities during 1998-99 assisted in enhancing yield.
Simultaneous selection for yield and stability
The differences in yield over months and seasons mean that it is important to select cultivars based on both yield and stability (Figure 1), in other words stability of yield should be taken into consideration as well as high yield. In our trials, the year 1998-99 was exceptional in re-gard to yield, such high yields not having been recorded during the preceding 10 years.
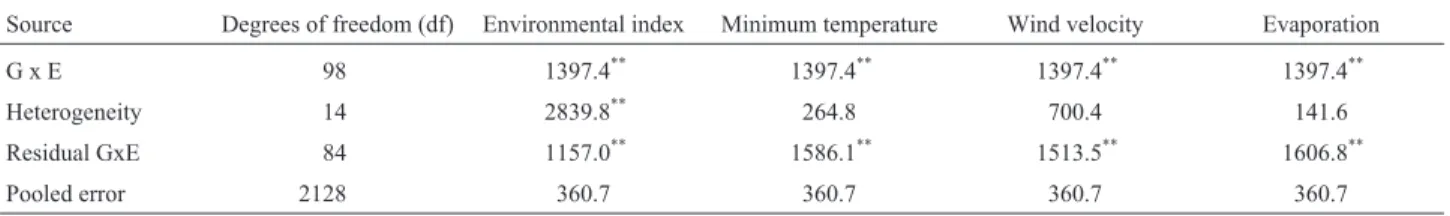
The weather variables and environmental index were used as covariants when analyzing the yield data to deter-mine the variable that contributed to heterogeneity in the GE interactions. The heterogeneity caused by environmen-tal index was highly significant (Tables 5 and 6), wind
Table 2- Monthly mean values of weather attributes
Months 1997-98 1998-99
Min. temp. (°C)
Wind velocity (km/h)
Evaporation (mm)
Min. temp. (°C)
Wind velocity (km/h)
Evaporation (mm)
May 23.6 5.1 2.9 24.5 3.8 2.6
June 24.8 6.1 3.2 25.3 7.2 2.8
July 25.5 5.3 2.0 25.6 7.1 2.2
August 25.6 4.8 2.1 25.8 5.9 2.2
September 24.7 3.8 2.6 25.8 2.6 2.3
October 21.2 1.2 2.3 24.4 1.7 2.1
November 17.7 1.2 1.9 19.8 1.4 1.6
December 13.6 1.0 1.5 13.2 0.95 1.5
January 11.5 1.3 1.3 10.6 1.3 1.2
Table 3- Yield in grams per tree per tap (g tree-1tap-1) correlated to
Minimum temperature, wind velocity evaporation during 1997-98.
Correlation coefficients
Clones Minimum temperature wind velocity evaporation
RRII 5 -0.216 -0.875** -0.106
RRII 105 -0.645 -0.908** -0.449
RRII 118 0.055# -0.767* -0.193
RRII203 -0.179 -0.938*** -0.273
RRIM 600 -0.485 -0.913** -0.268
RRIM 605 -0.897** -0.804* -0.568
RRIM 703 -0.644 -0.945*** -0.453
PB 5/51 -0.504 -0.975*** -0.432
PB 86 -0.751* -0.868** -0.618
PB 235 -0.152 -0.945*** -0.117
RRIC 52 -0.517 -0.888** -0.502
RRIC 105 -0.587 -0.899** -0.361
GT 1 -0.634 -0.900** -0.639
Gl 1 -0.903** -0.590 -0.700
HARBEL 1 -0.513 -0.898** -0.25
velocity and other climate variables causing only non-significant heterogeneity in GE interaction.
The yield stability statistic (YSi) can be used to select
clones that can adapt to normal and exceptional years (Ta-bles 7 and 8). While eight clones (RRII 118, RRII 203, RRIM 600, RRIM 703, PB 235, RRIC 52 and RRIC 105) were stable during the normal-yielding year, only seven
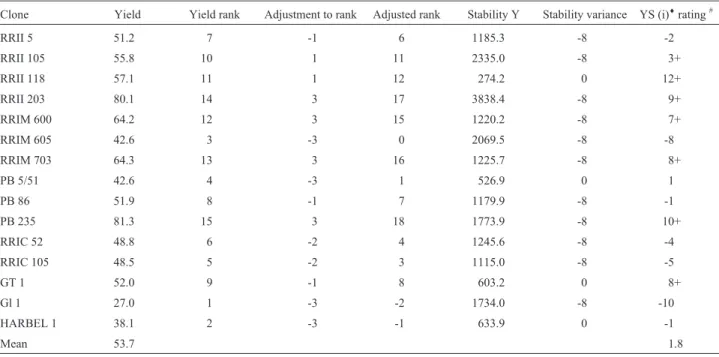
clones (RRII 105, RRII 118, RRII 203, RRIM 600, RRIM 703, PB 235 and GT 1) were stable during the excep-tional-yielding year. When the cultivars were ranked in or-der of yield (highest-yielding clones first) the rank-oror-der for 1998-99 was PB 235, RRII 203, RRIM 703, RRIM 600 and RRII 118, while the rank order (again starting with the highest-yielding clones) for 1997-98 was PB 235, RRII 203, RRII 118, RRIM 703 and RRIM 600, although these all gave lower yields than the highest-yielding clones for 1998-99. Calculation of yield-stability using the YSi
statis-Figure 1- Yield (environmental mean) over months during 1997-98 and 1998-99.
Table 4- Yield in grams per tree per tap (g tree-1tap-1) correlated to Minimum temperature, wind velocity evaporation during 1998-99.
Correlation coefficients
Clones Minimum temperature wind velocity evaporation
RRII 5 -0.412 -0.820** -0.520
RRII 105 -0.839** -0.696 -0.799*
RRII 118 -0.788* -0.811* -0.773*
RRII203 -0.029 -0.540 -0.290
RRIM 600 -0.671 -0.809* -0.566
RRIM 605 -0.893** -0.846** -0.765*
RRIM 703 -0.558 -0.890** -0.576
PB 5/51 -0.570 -0.833** -0.527
PB 86 -0.567 -0.814* -0.476
PB 235 -0.438 -0.683 -0.480
RRIC 52 -0.911** -0.695 -0.889**
RRIC 105 -0.915** -0.797* -0.864**
GT 1 -0.672 -0.749* -0.735*
Gl 1 -0.743* -0.798* -0.690
HARBEL 1 -0.669 -0.716* -0.749*
Significant at: *5%; **1%; 0.1%.
Table 5 -ANOVA showing heterogeneity removed from Gvs.E interaction via each listed 1997-98 environmental covariant using Kang’s program (1988).
Source Degrees of freedom (df) Environmental index Minimum temperature Wind velocity Evaporation
G x E 98 1572.1** 1572.1** 1572.1** 1572.1**
Heterogeneity 14 4126.2** 228.9 883.6 110.6
Residual GxE 84 1146.4** 1795.9** 1686.8** 1815.7**
Pooled error 2128 324.1 324.1 324.1 324.1
** Significant at p = 0.01.
Table 6- ANOVA showing heterogeneity removed from Gvs.E interaction via each listed 1998-99 environmental covariant using Kang’s program (1988).
Source Degrees of freedom (df) Environmental index Minimum temperature Wind velocity Evaporation
G x E 98 1397.4** 1397.4** 1397.4** 1397.4**
Heterogeneity 14 2839.8** 264.8 700.4 141.6
Residual GxE 84 1157.0** 1586.1** 1513.5** 1606.8**
Pooled error 2128 360.7 360.7 360.7 360.7
tic showed that clones PB 235, RRII 118, RRII 203, RRIM 703 and RRIM 600 were stable in yield during both the years (these cultivars can therefore be considered as show-ing adaptation under specific environments) while the same statistic showed that clones RRII 118 needed an excep-tional climate to produce a high yield.
Acknowledgments
The author thanks Dr. M.S. Kang (Louisiana State University, Baton Rouge, USA) for supplying the STABLE software and for valuable comments. Dr. D.H. Wallace (Emeritus Professor of Plant Breeding and
Table 7- Simultaneous selection for yield and stability during 1997-98 using Kang and Magari’s STABLE program (1995).
Clone Yield Yield rank Adjustment to rank Adjusted rank Stability Y Stability variance YS (i)♦ rating#
RRII 5 33.0 4 -2 2 1090.9 -8 -6
RRII 105 38.4 10 -1 9 2078.6 -8 1
RRII 118 58.1 13 3 16 3545.0 -8 8+
RRII 203 60.5 14 3 17 2073.8 -8 9+
RRIM 600 42.7 11 2 13 667.5 -4 9+
RRIM 605 33.4 6 -2 4 1517.6 -8 -4
RRIM 703 47.6 12 3 15 2863.1 -8 7+
PB 5/51 30.4 3 -3 0 290.3 0 0
PB 86 34.5 7 -2 5 687.4 -4 1
PB 235 63.1 15 3 18 3267.8 -8 10+
RRIC 52 35.8 8 -2 6 566.6 0 6+
RRIC 105 37.9 9 -1 8 490.1 0 8+
GT 1 33.4 5 -2 3 639.8 0 3+
Gl 1 15.7 1 -3 -2 2898.3 -8 -10
HARBEL 1 25.0 2 -3 -1 904.2 -8 -9
Mean 39.3 2.2
LSD (p = 0.05)+ = 3.3. Key: + = selected genotype;#-4, -8σ2iat p = 0.05 or 0.1; 0 = non-significant;♦selected genotypes must have a value more than the
mean YSivalue.
Table 8- Simultaneous selection for yield and stability during 1998-99 using Kang and Magari’s STABLE program (1995).
Clone Yield Yield rank Adjustment to rank Adjusted rank Stability Y Stability variance YS (i)♦ rating#
RRII 5 51.2 7 -1 6 1185.3 -8 -2
RRII 105 55.8 10 1 11 2335.0 -8 3+
RRII 118 57.1 11 1 12 274.2 0 12+
RRII 203 80.1 14 3 17 3838.4 -8 9+
RRIM 600 64.2 12 3 15 1220.2 -8 7+
RRIM 605 42.6 3 -3 0 2069.5 -8 -8
RRIM 703 64.3 13 3 16 1225.7 -8 8+
PB 5/51 42.6 4 -3 1 526.9 0 1
PB 86 51.9 8 -1 7 1179.9 -8 -1
PB 235 81.3 15 3 18 1773.9 -8 10+
RRIC 52 48.8 6 -2 4 1245.6 -8 -4
RRIC 105 48.5 5 -2 3 1115.0 -8 -5
GT 1 52.0 9 -1 8 603.2 0 8+
Gl 1 27.0 1 -3 -2 1734.0 -8 -10
HARBEL 1 38.1 2 -3 -1 633.9 0 -1
Mean 53.7 1.8
LSD (p = 0.05) = 3.4. Key: + = selected genotype;#-4, -8σ2iat p = 0.05 or 0.1; 0 = non-significant ;♦selected genotypes must have a value more than the
Biometry, Cornell University Ithaca, USA) also provided useful criticism and comments. The facilities provided by Dr. N.M. Mathew (Director, Rubber Research Institute of India) are gratefully acknowledged.
References
Blum, A (1988) Plant breeding for stress environments. CRC Press Inc, Florida.
Ceccarelli, S (1994) Specific adaptation and breeding for mar-ginal conditions. Euphytica 77:205-219.
Devi TS, Nair RB, Kothandaraman R and Sethuraj MR (1998) Im-pact of weather parameters on seasonal and inter-year varia-tions in yield of rubber. In: Mathew, NM and Jacob, KC (eds) Developments in Plantation Crops Research, New Delhi: Allied Publishers, pp 170-174.
Jacob JL, Prevot JC, Lacote R, Gohet E, Clement A, Gallois R, Joet T, Pujade-Renaud V and D’Auzac J (1998) The biologi-cal mechanisms controllingHevea brasiliensisrubber yield. Plantations, Recherche, Developpement. Jan-Feb, pp 14-16. Kang MS (1988) Interactive BASIC program for calculating
sta-bility-variance parameters. Agron J 80:153.
Kang MS (1993) Simultaneous selection for yield and stability in crop performance trials: Consequences for growers. Agron J 85:754-757.
Kang MS and Gorman DP (1989) Genotype x environment inter-action in maize. Agron J 81:662-664.
Kang MS and Magari R (1995) STABLE: A basic program for calculating stability and yield-stability statistic. Agron J 87:276-277.
Priyadarshan PM (2003) BreedingHevea brasiliensisfor environ-mental constraints. Advances in Agronomy 79:351-400. Priyadarshan PM, Vinod KK, Rajeswari MR, Pothen J,
Sudhdaowmyalatha MK, Sasikumar S, Raj S and Sethuraj MR (1998a) BreedingHevea brasiliensisin Tripura (NE
In-dia): I. Performance of a few stress tolerant clones in the early phase. In: Mathew NM and Jacob KC(eds) Develop-ments in Plantation Crops Research. New Delhi: Allied pub-lishers, pp 63-68.
Priyadarshan PM, Sowmyalatha MKS, Sasikumar S, Varghese YA and Dey SK (1998b) Relative performance of sixHevea brasiliensisclones during two yielding regimes in Tripura. Indian Journal of Natural Rubber Research 11(1&2):67-72. Priyadarshan PM, Sowmyalatha MKS, Sasikumar S, Varghese YA and Dey SK (2000) Evaluation of Hevea brasiliensis
clones for yielding trends in Tripura. Indian Journal of Natu-ral Rubber Research 13:56-63.
Rao GG, Rao PS, Rajagopal R, Devakumar AS, Vijayakumar KR and Sethuraj MR (1990) Influence of soil, plant and meteo-rological factors on water relations and yield in Hevea brasiliensis. International Journal of Biometeorology, 34:175-180.
Rao PS, Jayaratnam K and Sethuraj MR (1993) An index to assess areas hydrothermally suitable for rubber cultivation. Indian Journal of Natural Rubber Research 6:80-91.
Roberts E, Summerfield R, Ellis R, and Qi A (1993) Adaptation of flowering in crops to climate. Outlook Agri 22:105-110. Shuogang A and Yagang G (1990) Extrapolation of the high yield
physiological regulation of Hevea brasiliensis in Xishuangbanna. Proc. IRRDB Symp. on Physiology and Exploitation of Hevea brasiliensis, pp 83-92. Kunming, China, 1990.
Snedecor, CW and Cochran WG (1980) Statistical methods. The Iowa State University Press.
Shukla GK (1972) Some statistical aspects of partitioning geno-type-environmental components of variability. Heredity 29:237-245.
Vega PM (1996) Plant genetic adaptedness to climatic and edaphic environment. Euphytica 92:27-38.