An evaluation of quality of life and its determinants
among people living with HIV/AIDS from
Southern Brazil
Uma avaliação da qualidade de vida e seus
determinantes nas pessoas vivendo com
HIV/AIDS no Sul do Brasil
Evaluación de la calidad de vida y sus determinantes
en las personas que viven con VIH/SIDA en el
sur de Brasil
1 Programa de Pós-graduação em Saúde e Comportamento, Universidade Católica de Pelotas, Pelotas, Brasil. 2 Serviço de Atendimento Especializado em DST/AIDS, Universidade Federal de Pelotas, Pelotas, Brasil. Correspondence S. M. K. Passos
Programa de Pós-graduação em Saúde e Comportamento, Universidade Católica de Pelotas.
Rua General José de San Martin 1355, Pelotas, RS 96083-490, Brasil. [email protected]
Susane Müller Klug Passos 1,2 Luciano Dias de Mattos Souza 1
Abstract
This cross-sectional study evaluated the quality of life and its associated factors among people living with HIV/AIDS at a regional reference center for the treatment of HIV/AIDS in south-ern Brazil. WHOQOL-HIV Bref, ASSIST 2.0, HAD Scale, and a questionnaire were used to assess 625 participants on quality of life, clinical and sociodemographic characteristics, drug use, de-pression and anxiety. Multivariate analysis was performed through linear regression. The lowest results for quality of life were associated with be-ing female, age (< 47 years), low education lev-els, low socioeconomic class, unemployment, not having a stable relationship, signs of anxiety and depression, abuse or addiction of psychoactive substances, lack of perceived social support, nev-er taking antiretroviral medication, lipodystro-phy, comorbidities, HIV related hospitalizations and a CD4+ cell count less than 350. Psychoso-cial factors should be included in the physical and clinical evaluation given their strong asso-ciation with quality of life domains.
Quality of Life; HIV; Acquired Inmunodeficiency Syndrome
Resumo
Este estudo transversal avaliou a qualidade de vida e seus fatores associados em pessoas viven-do com HIV/AIDS em um centro de referência re-gional para o tratamento desta enfermidade no Sul do Brasil. WHOQOL-HIV Bref, a ASSIST 2.0, HAD Escala e um questionário foram utilizados para avaliar 625 participantes sobre a qualida-de qualida-de vida, características clínicas e socioqualida-demo- sociodemo-gráficas, uso de drogas, depressão e ansiedade. A análise multivariada foi realizada por regressão linear. Pior qualidade de vida foi associada com sexo feminino, idade (< 47 anos), baixa escolari-dade, baixa classe socioeconômica, desemprego, não ter um relacionamento estável, um indi-cativo de ansiedade e depressão, abuso ou de-pendência de substâncias psicoativas, falta de apoio social percebido, nunca tomar a medica-ção antirretroviral, lipodistrofia, comorbidades, internações relacionadas ao HIV e contagem de células CD4+ < 350. Fatores psicossociais devem ser incluídos na avaliação física e clínica, dada a sua forte associação com os domínios de qua-lidade de vida.
Introduction
With medical progress, diseases once considered to be lethal have become treatable and the symp-toms can be controlled, thereby increasing life expectancy 1. HIV infection is no longer a threat of eminent death but is instead a chronic condi-tion associated with a higher life expectancy 2. However the social stigma and side effects of medication, such as lipodystrophy, interfere with the well-being of patients 3.Therefore, it has
be-come particularly important to assess how peo-ple living with HIV/AIDS are living longer 1.
There is a growing concern about quality of life among people living with HIV/AIDS 4,5,6.
Quality of life refers to health status when tak-ing into consideration multiple dimensions in-cluding social, psychological, physical and func-tional well-being. The World Health Organization (WHO) defines quality of life as “individuals’ per-ception of their position in life in the context of the culture and value systems in which they live and in relation to their goals, expectations, standards and concerns” 7 (p. 1403).
The literature reported no consensus on the several associations that have been made be-tween the illness and quality of life. For instance, women living with HIV/AIDS have a worse qual-ity of life than men 8,9,10,11,12,13. However, one study has reported no differences in quality of life with regard to gender 14 and another has shown
better quality of life among women 15. It is im-portant to take into account the various cultural issues involving gender in the different regions where these studies were performed, a fact that may in some way have influenced the results. Studies that have used a representative sample and conducted multivariate statistical analysis of the subjects are important in efforts to solve these inconsistencies, but they are also scarce. Accordingly, the objective of the present study is to assess quality of life and to identify factors as-sociated with quality of life among adult patients who attended an HIV/AIDS treatment referral center in the south of Brazil.
Methods
A cross-sectional study of the 690 people living with HIV/AIDS attending the Special Assistance Service for HIV/AIDS in Pelotas, Rio Grande do Sul State, Brazil (SAS-Pelotas), from December 2011 to June 2012 was carried out. It is important to point out that the SAS-Pelotas is the center that provides medical attention and antiretrovi-ral medication to people living with HIV/AIDS in the city of Pelotas and the surrounding area.
Ethical approval for the study was obtained from the Ethics Research Committees at the Catholic University of Pelotas (UCPel) and the Federal University of Pelotas (UFPel).
Inclusion criteria for participation in the study were: being 18 years old or older and hav-ing a record of HIV infection. Males and females responded to interview. Exclusion criteria were: presenting a clinical or cognitive condition that prevented a clear understanding of the research instruments, as in the case of a patient with a se-vere hearing impediment or under the effect of a psychoactive substance such as alcohol, or limi-tations in being able to respond to the question-naire unaccompanied, as in the case of prisoners with a police escort. The interviews were con-ducted by five interviewers, who received prior training from the authors.
The World Health Organization Quality of Life Instrument, brief version, specific to people living with HIV/AIDS (WHOQOL-HIV Bref) was adapted and used to conduct an interview, given that other studies had reported difficulties faced by patients in understanding, thereby requiring frequent assistance when the questionnaire was self-administered 16. In addition, no significant differences were found in the results when the two methods (structured interviews vs. self-ad-ministered) were compared 17.
A pilot study was conducted among 40 par-ticipants and the sample size was calculated us-ing mean differences for each of the outcomes proposed by the quality of life instrument with each independent variable to ensure the reliabil-ity of the data. The largest sample size required was 572 participants for a confidence level of 95%. Considering a percentage of refusals and to control for confounding factors of 20%, the final required sample size was 688 participants.
Instruments
The survey instrument consisted of an interview that assessed socio-demographic and clinical is-sues.
• Socio-demographicinterview
(part-nership for a year or more), children and religios-ity (prays, attends mass, church or some other place of worship at least once a month).
• Clinicalinterview
We gathered information regarding the means of infection (through sexual intercourse, expo-sure to hazardous biological material, drug use, blood transfusion, vertical transmission or does not know), time since diagnosis (how long the subject has known that they are living with HIV), antiretroviral medication (never or at least once), lipodystrophy (self-perception of changes in face, nape of neck, arms, chest/breasts, abdo-men, buttocks and/or legs after the beginning of antiretroviral therapy: none, thinner or more swollen), comorbidities (self-reported diagno-sis of hypertension, diabetes, cardiopathy, dys-lipidemia, tuberculosis, hepatitis, chronic kid-ney disease, chronic lung disease, cancer) and HIV related hospitalizations (which referred to whether the subject had ever been hospitalized as a result of complications related to HIV infec-tion). A question was also included regarding the individual’s feelings about any type of social support they received related to the HIV infec-tion, irrespective of the source of support: family, friends, health care or other (yes or no).
Data on the clinical stage of infection, CD4+ cell count (CD4+) and viral load, based on the most recent result over the previous six months, was retrieved from the medical charts at SAS-Pelotas. Patients were categorized by clinical stage as asymptomatic, symptomatic and AIDS, according to the Centers for Disease Control and Prevention (CDC-2008) 18 and the Brazilian Min-istry of Health 19 guidelines used at the time of the data collection. CD4+ and viral load cutoff points were also considered in accordance with the HIV/AIDS guidelines at the time of data col-lection 20,21. Undetectable viral load was defined as less than 50 viral copies/mL RNA.
The participants’ use of psychoactive sub-stances was assessed with the Alcohol Smok-ing and Substance Involvement ScreenSmok-ing Test (ASSIST 2.0) which was adapted and validated for the Brazilian population 22. This is a structured questionnaire with eight questions about the use of psychoactive substance (alcohol, tobacco, marijuana, cocaine/crack, stimulants, sedatives/ hypnotics, inhalants, hallucinogens, opiates and others). Each response corresponds to a score ranging from 0 to 4, and the total sum can vary from 0 to 20. A score ranging from 0 to 3 is in-dicative of occasional use, from 4 to 15 indicates abuse and 16 or more indicates addiction. The variables related to abuse and dependence on
alcohol, tobacco and illicit drugs were dichoto-mous (yes or no): occasional use/never (score ranging 0-3) or abuse/addiction (score ≥ 4).
The Hospital Anxiety and Depression Scale (HAD) was used to assess anxiety and depres-sion 23.The scale consists of 14 multiple-choice questions divided into two sub-scales: depres-sion and anxiety. Each scale has seven items and the overall score ranges from 0 to 21. The cutoff point was 8/9. Two dichotomous variables were created, based on the cutoff point for signs of anxiety and depression, yes or no.
• Instrumentforassessingqualityoflife
The quality of life assessment was performed us-ing the WHOQOL-HIV Bref 24. The instrument is based on the WHOQOL-Bref, the shorter form of the WHOQOL-100 25 and is used on a large scale
in several countries 10,13,14,26 including Brazil 10. The WHOQOL-HIV Bref provides a profile of quality of life with scores ranging from 4 (poorest quality of life) to 20 (best quality of life) across six domains: physical, psychological, independence level, social relationships, environment and spir-ituality/religiousness/personal beliefs.
death and dying (for example: how much do you worry about death?).
Statistical analysis
After the application and coding of the instru-ments, data entry was performed using Epi Info 6.04 software (Centers for Disease Control and Prevention, Atlanta, USA). Double data entry was performed to ensure greater accuracy and reduce the potential for human error. The sta-tistical analysis of the data was performed using SPSS 13.0 software (SPSS Inc., Chicago, USA). An analysis of statistical significance was performed to verify the differences in mean quality of life in relation to the independent variables under study, using the t test for dichotomous variables and ANOVA for ordinal and nominal variables. A multivariate analysis was performed using lin-ear regression, adjusting for socio-demographic and clinical variables in relation to the domains of the WHOQOL-HIV Bref. This was performed following a multilevel hierarchic model for each domain of quality of life. Those associations with a p-value ≤ 0.2 in t test or ANOVA test were in-cluded in each model.
Results
Of the 690 patients who were invited to partici-pate in the study, 625 agreed to participartici-pate and completed the questionnaire in a private inter-view. There were 57 refusals, with a lack of time given as the main reason for refusal. We excluded data from eight participants due to the exclusion criteria. The sociodemographic and clinical char-acteristics of the sample are presented in Table 1 and Table 2. In regard to gender and ethnicity, 51.8% were female and 70.1% were white. The mean age of the participants was 42 years (± 11.46), ranging from 18 to 79 years old, and the mean years of school attendance was 6.96 years (± 4.06). Most patients had children (75.7%), be-longed to socioeconomic class C (59.8%) and re-ported following a religion (76.6%). Only 37.4% of participants were employed. Just over half of the participants (52%) reported a partnership lasting at least one year. 34 different therapeutic approaches were identified; the most frequent was the combination of Efavirenz + Zidovudine + Lamivudine (31.8%). Among the reported bodily changes, the most commonly observed after the initiation of antiretroviral therapy were excess fat deposition in the abdomen (29.2%), leg atrophy (20.9%) and facial lipoatrophy (15.2%). Hyper-tension and dyslipidemia were the most fre-quent comorbidities reported (23.5% and 23.1%,
Table 1
Sociodemographic characteristics of people living with HIV/ AIDS attending the Special Assistance Services for HIV/AIDS in Pelotas, Rio Grande do Sul State, Brazil (SAS-Pelotas), from December 2011 to June 2012 (N = 625).
n %
Gender
Male 301 48.2
Female 324 51.8
Skin color
White 438 70.1
Non-white 187 29.9
Age (years)
≤ 35 197 31.5
36-46 204 32.6
≥ 47 224 35.8
Education (years) *
8 or less (primary school) 441 70.1 9-12 (secondary school) 122 19.6 13 and above (college) 61 9.8 Employment **
No 391 62.6
Yes 234 37.4
Socioeconomic status*,***
Class D and E 115 18.6
Class C 369 59.8
Class A and B 133 21.6 Partnership #
No 300 48.0
Yes 325 52.0
Children
No 152 24.3
Yes 473 75.7
Religion ##
No 146 23.4
Yes 479 76.6
Total 625 100.0
* Variable with missing value; ** Has a current paid job;
*** Socioeconomic status according to the Associação Brasileira de Empresas de Pesquisa (Critério de classificação econômica Brasil. http://www.abep.org, accessed on 12/ Aug/2012);
# For a period of one year or more;
## Prays, attends mass, church or some other place of
worship at least once a month.
Table 2
Clinical characteristics of people living with HIV/AIDS attending the Special Assistance Services for HIV/AIDS in Pelotas, Rio Grande do Sul State, Brazil (SAS-Pelotas), from December 2011 to June 2012 (N = 625).
n %
Means of infection
Sexual intercourse 478 76.5
Other * 62 9.9
Do not know 85 13.6
Time since diagnosis (months) **
< 13 86 13.8
≥ 13 535 86.2
Antiretroviral medication **
Never 91 18.1
At least once 413 81.9
Lipodystrophy **,***
No 186 30.2
Yes 429 69.8
Comorbidities**,#
No 271 43.9
Yes 347 56.1
HIV related hospitalizations **
No 442 70.8
Yes 182 29.2
Clinical stage of infection **
Asymptomatic 96 15.4
Symptomatic 17 2.7
AIDS 511 81.9
T-CD4+ cell count **
≤ 350 158 36.1
> 350 280 63.9
Viral load **,##
Undetectable ## 271 63.0
Detectable 159 37.0
Signs of anxiety **
No 328 53.1
Yes 290 46.9
Signs of depression **
No 405 65.6
Yes 212 34.4
Tobacco **
Occasional use/Never 335 54.4
Abuse/Addiction 281 45.6
Alcohol **
Occasional use/Never 408 67.3
Abuse/Addiction 198 32.7
Other substances **,##
Occasional use/Never 503 84.3
Abuse/Addiction 94 15.7
Social support **,§
No 111 17.8
Yes 513 82.2
Total 625 100.0
* Other means of infection: drug use, blood transfusion, exposure to blood or other biological material, vertical transmission; ** Variable with missing value;
*** Self-perception of changes in: face, nape of neck, arms, chest/breasts, abdomen, buttocks and/or legs after starting antiretroviral therapy;
# Self-reported diagnosis of hypertension, diabetes, cardiopathy, dyslipidemia, tuberculosis, hepatitis, chronic kidney disease, chronic lung disease, cancer;
## < 50 viral copies/mL RNA;
Table 3
Mean differences among quality of life domains of people living with HIV/AIDS attending the Special Assistance Service for HIV/AIDS in Pelotas, Rio Grande do Sul State, Brazil (SAS-Pelotas), from December 2011 to June 2012 (N = 625).
Physical domain Psychological domain Independence level domain Social relationships domain Environmental domain Spirituality/Religiousness/ Personal beliefs domain Mean (SD) p-value Mean (SD) p-value Mean (SD) p-value Mean (SD) p-value Mean (SD) p-value Mean (SD) p-value Gender * Male 14.44 (3.60) 0.028 14.85 (2.72) 0.000 13.27 (3.49) 0.584 15.16 (3.40) 0.634 14.05 (2.74) 0.053 15.62 (3.66) 0.000 Female 13.81 (3.56) 13.69 (3.24) 13.11 (3.31) 15.03 (3.22) 13.63 (2.66) 14.54 (3.77) Skin color *
White 14.09 (3.62) 0.825 14.18 (3.08) 0.418 13.14 (3.49) 0.567 15.02 (3.34) 0.379 13.94 (2.68) 0.161 15.24 (3.76) 0.078 Non-white 14.16 (3.54) 14.40 (3.00) 13.30 (3.17) 15.27 (3.24) 13.60 (2.76) 14.66 (3.71) Age (years) **
≤ 35 14.05 (3.61) 0.061 13.98 (3.21) 0.004 13.59 (3.44) 0.768 14.91 (3.48) 0.022 13.72 (2.96) 0.070 14.19 (3.98) 0.000
36-46 13.55 (3.62) 13.86 (2.91) 12.50 (3.44) 14.69 (3.43) 13.56 (2.44) 14.98 (3.63)
≥ 47 14.67 (3.49) 14.82 (2.96) 13.45 (3.23) 15.62 (2.97) 14.18 (2.68) 15.91 (3.48) Education (years) **
≤ 8 13.86
(3.58) 0.002 14.00 (3.13) 0.000 12.75 (3.33) 0.000 14.94 (3.33) 0.054 13.46 (2.69) 0.000 14.89 (3.89) 0.023 9-12 14.36 (3.73) 14.45 (2.67) 13.88 (3.48) 15.28 (3.27) 14.43 (2.58) 15.15 (3.53)
≥ 13 15.38 (3.06) 15.53 (2.87) 14.98 (2.90) 15.77 (3.18) 15.36 (2.31) 16.11 (2.97) Employment ** Unemployed 13.64 (3.53) 0.000 13.80 (3.07) 0.000 12.49 (3.36) 0.000 14.61 (3.40) 0.000 13.48 (2.63) 0.000 14.84 (3.79) 0.056 Employed 14.89 (3.57) 14.98 (2.89) 14.34 (3.13) 15.89 (2.99) 14.41 (2.74) 15.43 (3.67) Socioeconomic
status **,***
Classes A and B 15.18 (3.33) 15.44 (2.67) 14.50 (3.41) 16.12 (3.02) 15.51 (2.28) 16.02 (3.25) Class C 14.25
(3.53) 0.000 14.18 (3.05) 0.000 13.15 (3.25) 0.000 15.05 (3.32) 0.000 13.70 (2.59) 0.000 14.93 (3.90) 0.001
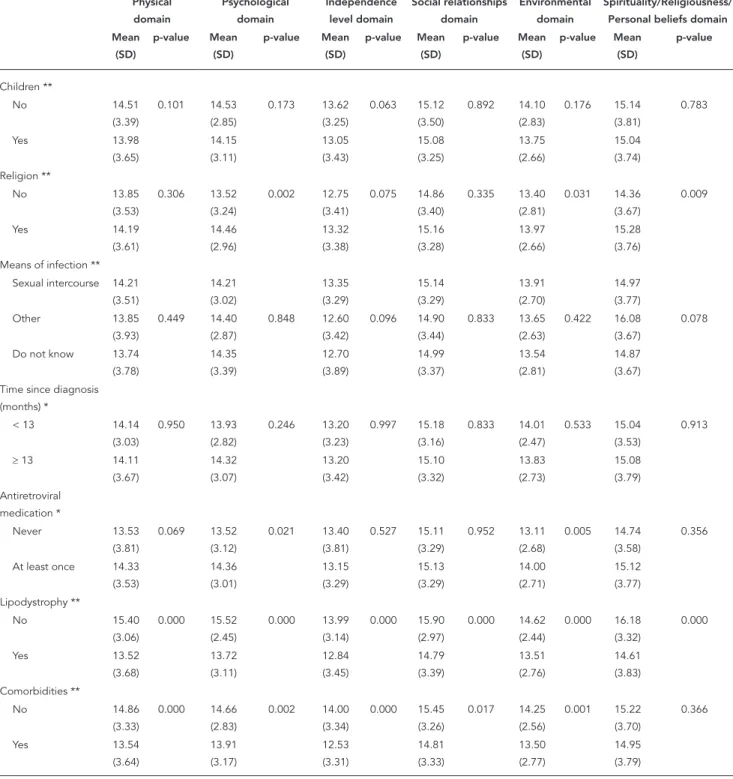
Table 3 (continued) Physical domain Psychological domain Independence level domain Social relationships domain Environmental domain Spirituality/Religiousness/ Personal beliefs domain Mean (SD) p-value Mean (SD) p-value Mean (SD) p-value Mean (SD) p-value Mean (SD) p-value Mean (SD) p-value Children ** No 14.51 (3.39) 0.101 14.53 (2.85) 0.173 13.62 (3.25) 0.063 15.12 (3.50) 0.892 14.10 (2.83) 0.176 15.14 (3.81) 0.783
Yes 13.98
(3.65) 14.15 (3.11) 13.05 (3.43) 15.08 (3.25) 13.75 (2.66) 15.04 (3.74) Religion ** No 13.85 (3.53) 0.306 13.52 (3.24) 0.002 12.75 (3.41) 0.075 14.86 (3.40) 0.335 13.40 (2.81) 0.031 14.36 (3.67) 0.009 Yes 14.19 (3.61) 14.46 (2.96) 13.32 (3.38) 15.16 (3.28) 13.97 (2.66) 15.28 (3.76) Means of infection **
Sexual intercourse 14.21 (3.51) 14.21 (3.02) 13.35 (3.29) 15.14 (3.29) 13.91 (2.70) 14.97 (3.77) Other 13.85 (3.93) 0.449 14.40 (2.87) 0.848 12.60 (3.42) 0.096 14.90 (3.44) 0.833 13.65 (2.63) 0.422 16.08 (3.67) 0.078
Do not know 13.74 (3.78) 14.35 (3.39) 12.70 (3.89) 14.99 (3.37) 13.54 (2.81) 14.87 (3.67) Time since diagnosis
(months) *
< 13 14.14 (3.03) 0.950 13.93 (2.82) 0.246 13.20 (3.23) 0.997 15.18 (3.16) 0.833 14.01 (2.47) 0.533 15.04 (3.53) 0.913
≥ 13 14.11 (3.67) 14.32 (3.07) 13.20 (3.42) 15.10 (3.32) 13.83 (2.73) 15.08 (3.79) Antiretroviral medication * Never 13.53 (3.81) 0.069 13.52 (3.12) 0.021 13.40 (3.81) 0.527 15.11 (3.29) 0.952 13.11 (2.68) 0.005 14.74 (3.58) 0.356
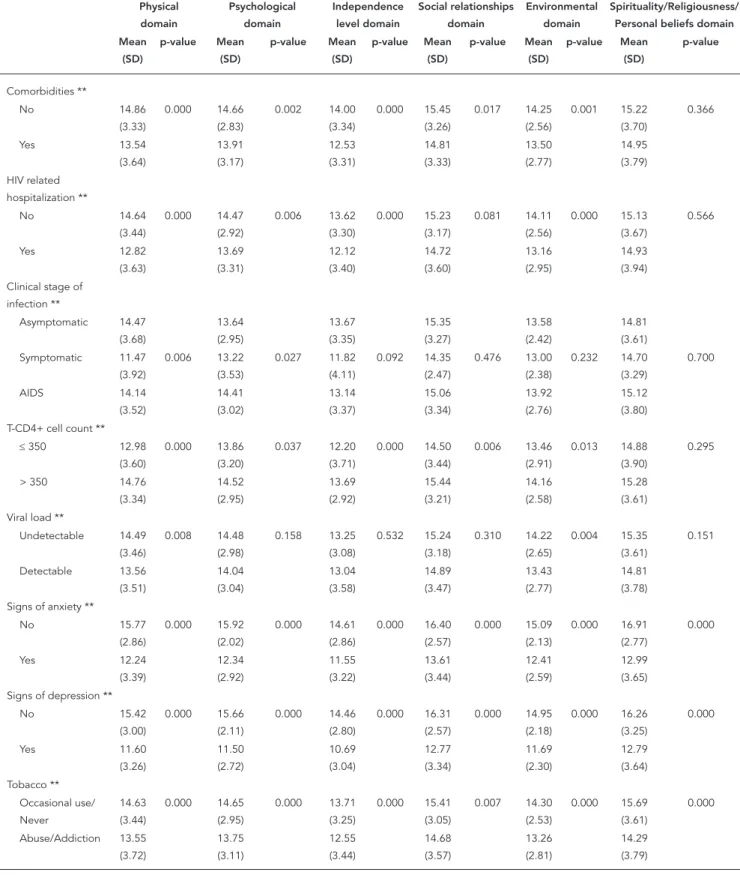
Table 3 (continued) Physical domain Psychological domain Independence level domain Social relationships domain Environmental domain Spirituality/Religiousness/ Personal beliefs domain Mean (SD) p-value Mean (SD) p-value Mean (SD) p-value Mean (SD) p-value Mean (SD) p-value Mean (SD) p-value Comorbidities ** No 14.86 (3.33) 0.000 14.66 (2.83) 0.002 14.00 (3.34) 0.000 15.45 (3.26) 0.017 14.25 (2.56) 0.001 15.22 (3.70) 0.366 Yes 13.54 (3.64) 13.91 (3.17) 12.53 (3.31) 14.81 (3.33) 13.50 (2.77) 14.95 (3.79) HIV related hospitalization ** No 14.64 (3.44) 0.000 14.47 (2.92) 0.006 13.62 (3.30) 0.000 15.23 (3.17) 0.081 14.11 (2.56) 0.000 15.13 (3.67) 0.566
Yes 12.82
(3.63) 13.69 (3.31) 12.12 (3.40) 14.72 (3.60) 13.16 (2.95) 14.93 (3.94) Clinical stage of
infection **
Asymptomatic 14.47 (3.68) 13.64 (2.95) 13.67 (3.35) 15.35 (3.27) 13.58 (2.42) 14.81 (3.61) Symptomatic 11.47
(3.92) 0.006 13.22 (3.53) 0.027 11.82 (4.11) 0.092 14.35 (2.47) 0.476 13.00 (2.38) 0.232 14.70 (3.29) 0.700 AIDS 14.14 (3.52) 14.41 (3.02) 13.14 (3.37) 15.06 (3.34) 13.92 (2.76) 15.12 (3.80) T-CD4+ cell count **
≤ 350 12.98 (3.60) 0.000 13.86 (3.20) 0.037 12.20 (3.71) 0.000 14.50 (3.44) 0.006 13.46 (2.91) 0.013 14.88 (3.90) 0.295
> 350 14.76 (3.34) 14.52 (2.95) 13.69 (2.92) 15.44 (3.21) 14.16 (2.58) 15.28 (3.61) Viral load **
Undetectable 14.49 (3.46) 0.008 14.48 (2.98) 0.158 13.25 (3.08) 0.532 15.24 (3.18) 0.310 14.22 (2.65) 0.004 15.35 (3.61) 0.151
Detectable 13.56 (3.51) 14.04 (3.04) 13.04 (3.58) 14.89 (3.47) 13.43 (2.77) 14.81 (3.78) Signs of anxiety **
No 15.77 (2.86) 0.000 15.92 (2.02) 0.000 14.61 (2.86) 0.000 16.40 (2.57) 0.000 15.09 (2.13) 0.000 16.91 (2.77) 0.000 Yes 12.24 (3.39) 12.34 (2.92) 11.55 (3.22) 13.61 (3.44) 12.41 (2.59) 12.99 (3.65) Signs of depression **
No 15.42
Table 3 (continued)
Physical domain
Psychological domain
Independence level domain
Social relationships domain
Environmental domain
Spirituality/Religiousness/ Personal beliefs domain Mean
(SD)
p-value Mean (SD)
p-value Mean (SD)
p-value Mean (SD)
p-value Mean (SD)
p-value Mean (SD)
p-value
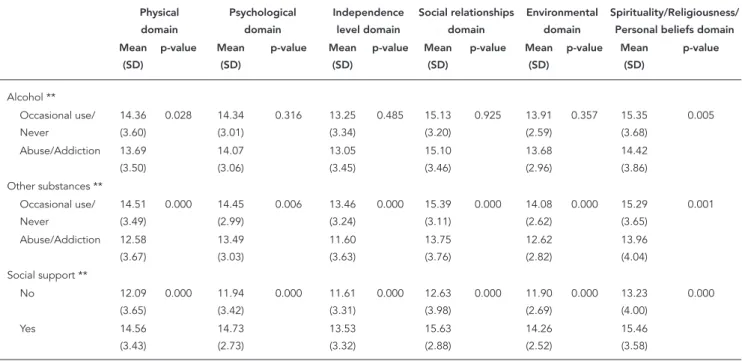
Alcohol ** Occasional use/ Never
14.36 (3.60)
0.028 14.34 (3.01)
0.316 13.25 (3.34)
0.485 15.13 (3.20)
0.925 13.91 (2.59)
0.357 15.35 (3.68)
0.005
Abuse/Addiction 13.69 (3.50)
14.07 (3.06)
13.05 (3.45)
15.10 (3.46)
13.68 (2.96)
14.42 (3.86) Other substances **
Occasional use/ Never
14.51 (3.49)
0.000 14.45 (2.99)
0.006 13.46 (3.24)
0.000 15.39 (3.11)
0.000 14.08 (2.62)
0.000 15.29 (3.65)
0.001
Abuse/Addiction 12.58 (3.67)
13.49 (3.03)
11.60 (3.63)
13.75 (3.76)
12.62 (2.82)
13.96 (4.04) Social support **
No 12.09
(3.65)
0.000 11.94 (3.42)
0.000 11.61 (3.31)
0.000 12.63 (3.98)
0.000 11.90 (2.69)
0.000 13.23 (4.00)
0.000
Yes 14.56
(3.43)
14.73 (2.73)
13.53 (3.32)
15.63 (2.88)
14.26 (2.52)
15.46 (3.58)
SD: standard deviation. * t test;
** ANOVA;
*** Socioeconomic status according to the Associação Brasileira de Empresas de Pesquisa (Critério de classificação econômica Brasil. http://www.abep.org, accessed on 12/Aug/2012);
After the adjusted analysis the following fac-tors were independently associated with quality of life scores in the physical, psychological and independence level domains: gender, age, edu-cation, employment status, socioeconomic sta-tus, signs of anxiety, signs of depression, abuse or addiction to other psychoactive substances, social support, HIV related hospitalizations, co-morbidities, lipodystrophy and CD4+ (Table 4).
Age, gender, employment, socioeconomic status, partnership, signs of anxiety, signs of depression, social support, abuse or addiction to other psychoactive substances, antiretrovi-ral medication and HIV related hospitalizations were independently associated with quality of life scores in the social relationships, environ-ment and spirituality/religiousness/personal be-liefs domains (Table 5).
Discussion
This study demonstrated the importance of so-ciodemographic variables to quality of life for people living with HIV/AIDS. Female patients
had lower scores in the psychological and spiri-tual domains, with almost a point of difference in both. Similar results were found by Pereira & Canavarro 13, using WHOQOL-HIV Bref. The lowest scores for quality of life in this group may be related to cultural, educational and socioeco-nomic differences between genders 10. Many women still live in a situation of economic and emotional dependence on their partner and face difficulties in the relationship, such as negotiat-ing condom use durnegotiat-ing sexual intercourse 10.
Table 4
Adjusted analysis of quality of life for people living with HIV/AIDS attending the Special Assistance Service for HIV/AIDS in Pelotas, Rio Grande do Sul State, Brazil (SAS-Pelotas), from December 2011 to June 2012 (N = 625), according to physical, psychological and independence level domains.
Physical Psychological Independence level
r 95%CI p-value r 95%CI p-value r 95%CI p-value
Gender -0.20 -0.78; 0.39 0.512 -0.90 -1.37; -0.43 0.000 - -
-Skin color - - -
-Age 0.50 0.16; 0.83 0.004 0.54 0.26; 0.82 0.000 - -
-Education 0.08 -0.41; 0.56 0.760 0.23 -0.16; 0.63 0.240 0.58 0.15; 1.02 0.009 Employment 0.97 0.40; 1.55 0.001 0.86 0.37; 1.34 0.001 1.44 0.90; 1.99 0.000 Socioeconomic status 1.18 0.74; 1.63 0.000 0.92 0.54; 1.30 0.000 0.72 0.26; 1.18 0.002 Partnership 0.19 -0.39; 0.76 0.522 0.45 -0.03; 0.92 0.064 0.40 -0.13; 0.92 0.137
Children -0.54 -1.20; 0.11 0.103 -0.14 -0.74; 0.46 0.652 -0.35 -0.97; 0.28 0.276
Religion - - - 0.22 -0.19; 0.63 0.288 -0.10 -0.62; 0.41 0.699
Route of infection - - - -0.07 -0.38; 0.24 0.671
Indicative of anxiety -2.01 -2.58; -1.44 0.000 -1.82 -2.23; -1.42 0.000 -1.47 -1.98; -0.95 0.000 Indicative of depression -2.15 -2.76; -1.53 0.000 -2.61 -3.05; -2.17 0.000 -2.45 -3.02; -1.89 0.000
Tobacco 0.04 -0.49; 0.57 0.878 0.06 -0.29; 0.42 0.722 -0.22 -0.68; 0.24 0.356
Alcohol -0.32 -0.84; 0.20 0.224 - - -
-Other substances -0.88 -1.56; -0.20 0.011 0.05 -0.46; 0.57 0.842 -0.95 -1.56; -0.34 0.002 Social support 0.96 0.30; 1.62 0.005 1.24 0.77; 1.71 0.000 0.46 -0.15; 1.07 0.138
Time since diagnosis - - -
-Antiretroviral medication 0.91 -0.08; 1.90 0.071 0.41 -0.09; 0.92 0.110 - -
-Lipodystrophy -0.79 -1.48; -0.10 0.026 -0.57 -0.99; -0.15 0.009 -0.55 -1.33; -0.32 0.046 Comorbidities -0.79 -1.43; -0.15 0.016 -0.15 -0.63; 0.33 0.542 -0.82 -1.33; -0.32 0.002 HIV related hospitalizations -1.40 -2.11; -0.69 0.000 -0.34 -0.75; 0.07 0.106 -0.58 -1.14; -0.01 0.047 Clinical stage of infection -0.50 -1.00; 0.01 0.056 0.05 -0.31; 0.41 0.778 -0.16 -0.53; 0.21 0.399 T-CD4+ cell count 0.76 0.05; 1.48 0.037 0.07 -0.50; 0.64 0.818 0.56 0.02; 1.09 0.041
Viral load -0.06 -0.83; 0.72 0.880 0.32 -0.23; 0.86 0.257 - -
-95%CI: 95% confidence interval.
immunosenescence process 27, contributing to a poorer quality of life in older people, this ef-fect may not be valid for all domains of quality of life and be influenced by socio-cultural aspects. In particular, the spirituality domain points to a gradual increase in quality of life scores with ad-vancing age. The results of the present study may be partly explained by Silva et al. 28 who reported that older people are less anxious about future events, including death and dying and suffer less of an impact of AIDS in their intimacy.
Not having a stable relationship was associ-ated with poorer quality of life in the social re-lationships and environment domains, which is consistent with other results reported in the literature 9,14. Long-term partnership provides better social support 29, and, in addition, the need to disclose HIV status to a single person, the partner, reduces one of the biggest anxieties of seropositive individuals 14.
Table 5
Adjusted analysis of quality of life for people living with HIV/AIDS attending the Special Assistance Service for HIV/AIDS in Pelotas, Rio Grande do Sul State, Brazil (SAS-Pelotas), from December 2011 to June 2012 (N = 625), according to social relationships, environmental and spirituality/religiousness/personal beliefs domains.
Social relationships Environmental Spirituality/Religiousness/Personal Beliefs
r 95%CI p-value r 95%CI p-value r 95%CI p-value
Gender - - - -0.11 -0.53; 0.31 0.615 -0.89 -1.47; -0.31 0.003
Skin color - - - 0.05 -0.39; 0.50 0.811 -0.20 -0.85; 0.45 0.544 Age 0.52 0.21; 0.83 0.001 0.45 0.20; 0.70 0.000 0.91 0.56; 1.26 0.000 Education 0.04 -0.39; 0.48 0.855 0.34 -0.01; 0.69 0.055 0.27 -0.22; 0.76 0.286 Employment 1.06 0.53; 1.59 0.000 0.48 0.06; 0.90 0.026 0.40 -0.20; 1.01 0.194 Socioeconomic status 0.72 0.31; 1.14 0.001 1.27 0.91; 1.63 0.000 0.74 0.27; 1.20 0.002
Partnership 0.75 0.23; 1.27 0.005 0.45 0.03; 0.87 0.034 - -
-Children - - - -0.33 -0.82; 0.17 0.196 - -
-Religion - - - 0.02 -0.38; 0.42 0.929 -0.11 -0.73; 0.52 0.740
Route of infection - - - 0.15 -0.21; 0.51 0.414
Indicative of anxiety -1.27 -1.79; -0.75 0.000 -1.25 -1.65; -0.86 0.000 -2.66 -3.28; -2.04 0.000
Indicative of depression -2.11 -2.67; -1.55 0.000 -1.94 -2.37; -1.51 0.000 -1.42 -2.08; -0.76 0.000 Tobacco 0.22 -0.25; 0.68 0.358 -0.11 -0.47; 0.25 0.543 -0.37 -0.92; 0.17 0.177
Alcohol - - - -0.46 -1.02; 0.11 0.113
Other substances -0.60 -1.21; 0.02 0.057 -0.57 -1.05; -0.10 0.018 -0.18 -0.96; 0.60 0.643 Social support 1.65 1.05; 2.25 0.000 0.94 0.48; 1.40 0.000 1.12 0.42; 1.83 0.002
Time since diagnosis - - -
-Antiretroviral medication - - - 0.62 0.11; 1.12 0.018 - - -Lipodystrophy -0.09 -0.66; 0.48 0.748 -0.19 -0.62; 0.24 0.387 -0.53 -1.10; 0.05 0.071 Comorbidities -0.14 -0.69; 0.41 0.618 -0.11 -0.51; 0.29 0.583 - - -HIV related
hospitalizations
0.22 -0.36; 0.80 0.450 -0.44 -0.87; -0.02 0.041 - -
-Clinical stage of infection - - -
-T-CD4+ cell count 0.26 -0.28; 0.80 0.338 -0.15 -0.68; 0.37 0.571 - - -Viral load - - - -0.09 -0.64; 0.46 0.741 0.004 -0.60; 0.69 0.893
95%CI: 95% confidence interval.
The literature shows a trend of considering the existence of a stable relationship as a likely source of social support for people living with HIV/AIDS 30. Due to the inclusion of questions about social support and marital status in our in-strument our results showed differences between partnership and social support in the impact of quality of life, with a potential positive effect for social support regardless of maintaining a stable relationship.
Participants with low education levels with up to eight years of schooling, had lower quality of life scores in all domains, with the lowest score at the independence level domain, which as-sesses ability to work and daily activities, among other issues. Belak et al. 14 and Gaspar et al. 10
also found that higher education promotes bet-ter quality of life. Higher educational level often provides financial benefits and is directly related
to employment and monthly income 10. People who have higher education possibly are more in-tegrated in society and may have a better social network of family and friends 31.
Low socioeconomic status was directly relat-ed to lower scores in all domains, which persistrelat-ed after the adjustment for other sociodemograph-ic factors. A similar result was found by Zimpel & Fleck 8, using the WHOQOL-HIV instrument and the same socioeconomic classification as our study, and Gaspar et al. 10, using
WHOQOL-HIV Bref. Both studies evaluated quality of life in Brazilian populations. Personal income is partly determined by prior educational qualification and professional status, and these factors are as-sociated with better quality of life 32. Moreover, income is a factor directly related to the condi-tions of health and functional capacity of the in-dividual, and there is a relationship between low income and impaired health status 33.
Tostes et al. 34 had already written that the presence of mental symptoms is one of the fac-tors that limit quality of life in people living with HIV/AIDS. Souza Junior et al. 35 found that de-pression and anxiety were more frequent in sero-positive patients than in the general population. In the present study, signs of depression and anx-iety were related to lower scores in all domains, even after controlling for other variables. Among all variables, the lowest scores were attributed to participants with signs of depression in the independence level domain. Other authors 13,36 found negative correlations between the pres-ence of depressive symptoms and anxiety with quality of life. Reis et al. 37 highlighted that
psy-chopathological symptoms negatively affect quality of life and adherence to antiretroviral treatment. Moreover, the literature reports that increased levels of stress and depression acceler-ate the deterioration of the immune system and disease progression 38.
When we evaluated the data on drug use, we did not find associations with tobacco or alco-hol abuse or dependence, however addiction to other psychoactive substances was indepen-dently associated with lower scores in the physi-cal, the independence level and the environment domains. The literature presents contradictory results 31,36,39,40 most likely due to the different classifications of the types of substances and dif-ferent assessment instruments 41,42, thereby
lim-iting comparisons between results. People who are addicted to any type of drug, legal or illegal, live with many health risks such as imprison-ment, and this may interfere with health care 32.
Subjects with comorbidities and those who had a history of HIV related hospitalizations have lower quality of life scores in the environmental (hospitalizations), physical and independence level domains (hospitalizations and comorbidi-ties). The presence of other symptoms and the use of a larger number of medication, with
great-er potential for side effects, may contribute to this result 30,43, creating a sense of dependency, affecting daily lives and limiting personal physi-cal capacities.
The antiretroviral therapy that is currently available is able to significantly change the mor-bidity and mortality associated with HIV/AIDS 44.
In our sample, we found an independent rela-tionship only with the environment domain, with the worst scores among participants who have never used the medication. It seems that patients feel more comfortable and secure while taking it, regaining a sense of well-being and hope for the future 36. Nevertheless, several side effects have been strongly linked with antiretro-viral therapy. Among them, lipodystrophy is one that is particularly worrying, because it is respon-sible for changes in body shape. Patients perceive these changes as visible marks that identify them as having HIV, which can impact their psycho-social well-being and self-esteem, affect daily activities, and adherence to treatment 45. In this study, participants who reported body changes after the initiation of antiretroviral therapy had significantly worse scores in the physical, psy-chological and independence level domains in the adjusted analysis.
Concerning the CD4+ count, we found an dependent relationship with the physical and in-dependence level domains, with the worst scores among participants with CD4+ cells ≤ 350. The quality of life studies with people living with HIV/ AIDS used different cutoff points for CD4+, most likely in accordance with the current guidelines at the time the study was conducted. Nevertheless all studies show that the lower the CD4+ count, the poorer the quality of life 30,40. It is within rea-son to think that patients with low CD4+ counts experience a negative effect on their quality of life because they are more prone to disease symp-toms, opportunistic infections and are likely to use more medication 26,30.
It is important to highlight that only the most recent test result of CD4+ within the last six months preceding the interview was used for our analysis. Therefore, it is possible that the associa-tion between the CD4+ count and the quality of life refer to different time periods, as the assess-ment tool used (WHOQOL-HIV Bref) focuses on the past two weeks.
use. ASSIST, a screening tool that has been vali-dated and adapted for the Brazilian population, was used to measure this variable. In relation to the clinical stage of infection, the HIV/AIDS guidelines in force at the time of data collection were followed. However, the categorization used was notified at some time during the infection, which cannot take into account the current clini-cal stage of the participant. The sample selection must be considered when interpreting our find-ings. Samples selected from the university ref-erence services, as in our study, tend to recruit people in better living conditions and health, and may consequently overestimate quality of life scores. One can expect lower scores for excluded populations and services with fewer resources
11. As the SAS-Pelotas is the only treatment and medication dispensation center for people living with HIV/AIDS in the city, it is unlikely that this factor has significantly influenced our results.
It was observed that some clinical and socio-demographic characteristics were independently associated with poorer quality of life in different domains. It is important to emphasize that the co-occurrence of these factors may accentuate the poorer results found for quality of life.
Conclusions
Quality of life in this sample of people living with HIV/AIDS was influenced by factors beyond the physical and biological domains and was related directly to economic and social issues. Thus, an interdisciplinary assessment of this population
is needed. Socio-demographic and lifestyle data should be considered in physical and clinical as-sessments given its strong association with the domains of quality of life in people living with HIV/AIDS.
Based on these results, we suggest that health care policies for this population should include programs that promote: (a) access to education; (b) reintegration into the labor market; and (c) other actions that aid financial independence. Employment, beyond its purpose as a source of funding, helps to minimize the stress related to HIV infection, provides opportunities for social-ization and serves to improve quality of life.
In addition, the present study emphasizes the importance of social and emotional support in the context of HIV infection. Regardless of the source of this support, it is possible that these patients face the disease with less psychologi-cal distress and greater adherence to follow-up programs. The identification and effective man-agement of psychopathological symptoms and abuse of or dependence on illicit drugs are essen-tial in people living with HIV/AIDS due to their significant impact on quality of life. It is strongly recommended that instruments that are easy to apply for this purpose should be included in the clinical interview.
Resumen
Este estudio transversal evaluó la calidad de vida y sus factores asociados en personas que viven con el VIH/ SIDA, en un centro de referencia regional para el tra-tamiento del VIH/SIDA en el sur de Brasil. Se utilizó WHOQOL-BREF VIH, ASSIST 2.0, HAD Scale, y se aplicó un cuestionario para evaluar a 625 participantes sobre calidad de vida, características clínicas y sociodemo-gráficas, uso de drogas, depresión y ansiedad. El aná-lisis multivariado se realizó mediante regresión lineal. Una peor calidad de vida se asoció con el sexo femeni-no, una edad (< 47 años), bajo nivel de educación, nivel socioeconómico bajo, desempleo, no tener una relación estable, indicativo de ansiedad y depresión, abuso o dependencia de sustancias psicoactivas, falta de apoyo social percibido, nunca tomar medicación antirretro-viral, lipodistrofia, comorbilidades, hospitalizaciones relacionadas con el VIH y un recuento de CD4+ < 350 células. Los factores psicosociales deben ser incluidos en la evaluación física y clínica, debido a su fuerte asocia-ción con los dominios de calidad de vida.
Calidad de Vida; VIH; Síndrome de Inmunodeficiencia Adquirida
Contributors
S. M. K. Passos and L. D. M. Souza contributed to the conception and design of the study, the acquisition, analysis, and interpretation of data; they participated in the drafting of the article and revised it critically for im-portant intellectual content and approved the version to be published. Both authors agreed to be accountable for all aspects of the study in ensuring that questions re-lated to the accuracy or integrity of any part of the study are appropriately investigated and resolved.
Acknowledgments
We thank the Catholic University of Pelotas (UCPel) for their financial support.
References
1. Panzini RG, Rocha NS, Bandeira DR, Fleck MPA. Qualidade de vida e espiritualidade. Rev Psiq Clín 2007; 34:105-15.
2. Chiasson MA, Berenson L, Li W, Schwartz S, Singh T, Forlenza S, et al. Declining HIV/AIDS mortal-ity in New York Cmortal-ity. J Acquir Immune Defic Syndr 1999; 21:59-64.
3. Palella Jr. FJ, Delaney KM, Moorman AC, Loveless MO, Fuhrer J, Satten GA, et al. Declining morbidity and mortality among patients with advanced hu-man immunodeficiency virus infection. N Engl J Med 1998; 338:853-60.
4. Geocze L, Mucci S, De Marco MA, Nogueira-Mar-tins LA, Citero VA. Qualidade de vida e adesão ao tratamento antirretroviral de pacientes portadores de HIV. Rev Saúde Pública 2010; 44:743-9.
5. O’Connell K, Skevington S, Saxena S; WHOQOL HIV Group. Preliminary development of the World Health Organization’s Quality of Life HIV instru-ment (WHOQOL-HIV): analysis of the pilot ver-sion. Soc Sci Med 2003; 57:1259-75.
6. Jelsma J, Maclean E, Hughes J, Tinise X, Darder M. An investigation into the health-related quality of life of individuals living with HIV who are receiving HAART. AIDS Care 2005; 17:579-88.
7. The World Health Organization Quality of Life as-sessment (WHOQOL): position paper from the World Health Organization. Soc Sci Med 1995; 41:1403-9.
8. Zimpel RR, Fleck MPA. Quality of life in HIV-pos-itive Brazilians: application and validation of the WHOQOL-HIV, Brazilian version. AIDS Care 2007; 19:923-30.
9. Razera F, Ferreira J, Bonamigo RR. Factors associ-ated with health-relassoci-ated quality of life in HIV-in-fected Brazilians. Int J STD AIDS 2008; 19:519-23. 10. Gaspar J, Reis RK, Pereira FMV, Neves LAS,
Cas-trighini CC, Gir E. Quality of life in women with HIV/AIDS in a municipality in the state of São Pau-lo. Rev Esc Enferm USP 2011; 45:230-6.
11. Santos ECM, França Júnior I, Lopes F. Qualidade de vida de pessoas vivendo com HIV/AIDS em São Paulo. Rev Saúde Pública 2007; 41:64-71.
12. Nojomi M, Anbary K, Ranjbar M. Health-related quality of life in patients with HIV/AIDS. Arch Iran Med 2008; 11:608-12.
13. Pereira M, Canavarro MC. Gender and age differ-ences in quality of life and the impact of psycho-pathological symptoms among HIV-infected pa-tients. AIDS Behav 2011; 15:1857-69.
14. Belak Kovacević S, Vurusić T, Duvancić K, Macek M. Quality of life of HIV-infected persons in Croa-tia. Coll Antropol 2006; 30:79-84.
15. Fatiregun AA, Mofolorunsho KC, Osagbemi KG. Quality of life of people living with HIV/AIDS in Kogi state, Nigeria. Benin J Postgrad Med 2009; 11:21-7.
17. Puhan MA, Ahuja A, Van Natta ML, Ackatz LE, Meinert C; Studies of Ocular Complications of AIDS Research Group. Interviewer versus self-ad-ministered health related quality of life question-naires – does it matter? Health Qual Life Outcomes 2011; 9:30.
18. Schneider E, Whitmore S, Glynn KM, Dominguez K, Mitsch A, McKenna MT, et al. Revised surveil-lance case definitions for HIV infection among adults, adolescents, and children aged < 18 months and for HIV infection and AIDS among children aged 18 months to < 13 years: United States, 2008. MMWR Recomm Rep 2008; 57(RR-10):1-12. 19. Programa Nacional de DST e AIDS, Secretaria de
Vigilância em Saúde, Ministério da Saúde. Crité-rios de definição de casos de AIDS em adultos e crianças. Brasília: Ministério da Saúde; 2004. 20Programa Nacional de DST e AIDS, Secretaria de
Vigilância em Saúde, Ministério da Saúde. Reco-mendações para terapia anti-retroviral em adultos infectados pelo HIV. Brasília: Ministério da Saúde; 2008.
21. Department of Health and Human Services. Guidelines for the use of antiretroviral agents in HIV-1- infected adults and adolescents. http:// aidsinfo.nih.gov/guidelines (accessed on 12/ Aug/2012).
22. Henrique IFS, De Micheli D, Lacerda RB, Lacer-da LA, Formigoni MLOS. ValiLacer-dação Lacer-da versão bra-sileira do teste de triagem do envolvimento com álcool, cigarro e outras substâncias (ASSIST). Rev Assoc Med Bras 2004; 50:199-206.
23. Botega NJ, Bio MC, Zomignani MA, Garcia Júnior C, Pereira WAB. Transtornos do humor em enfer-maria de clínica médica e validação de escala de medida (HAD) de ansiedade e depressão. Rev Saú-de Pública 1995; 29:355-63.
24. World Health Organization. WHOQOL-HIV Bref. http://www.who.int/iris/handle/10665/77775 (ac-cessed on 12/Aug/2012).
25. World Health Organization. WHOQOL-HIV. http:// www.who.int/iris/handle/10665/77776#sthash. rxmDH1vA.dpuf (accessed on 12/Aug/2012). 26. Chandra PS, Gandhi C, Satishchandra P, Kamat A,
Desai A, Ravi V, et al. Quality of life in HIV subtypes C infection among asymptomatic subjects and its association with CD4 counts and viral loads: a study from South India. Qual Life Res 2006; 15:1597-605.
27. Deeks SG. HIV infection, inflammation, immu-nosenescence and aging. Annu Rev Med 2011; 62:141-55.
28. Silva J, Saldanha AAW, Azevedo RLW. Variáveis de impacto na qualidade de vida de pessoas acima de 50 anos HIV+. Psicol Reflex Crít 2010; 23:56-63. 29. Seidl EMF, Zannon CMLC, Tróccoli BT. Pessoas
vivendo com HIV/AIDS: enfrentamento, suporte social e qualidade de vida. Psicol Reflex Crít 2005; 18:188-95.
30. Ferreira BE, Oliveira IM, Paniago AMM. Qualidade de vida de portadores de HIV/AIDS e sua relação com linfócitos CD4+, carga viral e tempo de diag-nóstico. Rev Bras Epidemiol 2012; 15:75-84.
31. Van Vu T, Larsson M, Pharris A, Diedrichs B, Nguy-en HP, NguyNguy-en CTK, et al. Peer support and im-proved quality of life among persons living with HIV on antiretroviral treatment: a randomised controlled trial from north-eastern Vietnam. Health Qual Life Outcomes 2012; 10:53.
32. Martikainen P, Adda J, Ferrie JE, Smith GD, Mar-mot M. Effects of income and wealth on GHQ de-pression and poor self-rated health in white collar women and men in the Whitehall II study. J Epide-miol Community Health 2003; 57:718-23.
33. Fonseca MG, Bastos FI, Derrico M, Andrade CLT, Travassos C, Szwarcwald CL. AIDS e grau de es-colaridade no Brasil: evolução temporal de 1986 a 1996. Cad Saúde Pública 2000; 16 Suppl 1:S77-87. 34. Tostes MA, Chalub M, Botega NJ. The quality of life
of HIV-infected women is associated with psychi-atric morbidity. AIDS Care 2004; 16:177-86. 35. Souza Junior PRB, Szwarcwald CL, Castilho EA.
Self-rated health by HIV-infected individuals undergoing antiretroviral therapy in Brazil. Cad Saúde Pública 2011; 27 Suppl 1:S56-66.
36. Zimpel RR. Qualidade de vida, depressão e ansie-dade em brasileiros HIV-positivos [Dissertação de Mestrado]. Porto Alegre: Faculdade de Medicina, Universidade Federal do Rio Grande do Sul; 2003. 37. Reis AC, Lencastre L, Guerra MP, Remor E. Relação
entre sintomatologia psicopatológica, adesão ao tratamento e qualidade de vida na infecção HIV e AIDS. Psicol Reflex Crít 2010; 23:419-29.
38. Leserman J. Role of depression, stress and trauma in HIV disease progression. Psychosom Med 2008; 70:539-45.
39. Korthuis PT, Zephyrin LC, Fleishman JA, Saha S, Josephs JS, McGroth MM, et al. Health-related quality of life in HIV-infected patients: the role of substance use. AIDS Patient Care STDS 2008; 22:859-67.
40. Tran BX. Quality of life outcomes of antiretroviral treatment for HIV/AIDS patients in Vietnam. PLoS One 2012; 7:e41062.
41. Nahvi S, Cooperman NA. Review: the need for smoking cessation among HIV-positive smokers. AIDS Educ Prev 2009; 21:14-27.
42. Patel N, Talwar A, Reichert VC, Brady T, Jain M, Ka-plan MH. Tobacco and HIV. Clin Occup Environ Med 2006; 5:193-207.
43. Cardona-Arias J, Peláez-Vanegas L, López-Salda-rriaga J, Duque-Molina M, Leal-Álvarez O. Calidad de vida relacionada con la salud en adultos con VIH/Sida, Medellín, Colombia, 2009. Biomédica (Bogotá); 31:532-44.
44. Oguntibeju OO. Quality of life of people living with HIV and AIDS and antiretroviral therapy. HIV AIDS (Auckl) 2012; 4:117-24.
45. Fernandes APM, Sanches RS, Mill J, Lucy D, Palha PF, Dalri MCB. Síndrome da lipodistrofia associa-da com a terapia anti-retroviral em portadores do HIV: considerações para os aspectos psicossociais. Rev Lationam Enferm 2007; 15:1041-5.
Submitted on 16/Jan/2014