Ayse Gozde TURK(a) Metin SABUNCU(b) Mubin ULUSOY(a)
(a) Ege University, Faculty of Dentistry,
Department of Prosthodontics, Izmir, Turkey.
(b) Dokuz Eylül University, Department of Electrical
and Electronics Engineering, Izmir, Turkey.
Evaluation of adaptation of ceramic
inlays using optical coherence
tomography and replica technique
Abstract: Optical coherence tomography (OCT) has generally been used as a nondestructive technique to evaluate integrities of composite restorations. We investigated marginal and internal adaptations of ceramic inlay restorations with OCT and compared them to results with the silicone replica technique. Round-shaped class I cavities
were prepared on 16 human maxillary irst premolar teeth. Ceramic
inlays were fabricated. Silicone replicas from inlays were obtained and sectioned to measure marginal and internal adaptations with a stereomicroscope (Leica Dfc 295, Bensheim, Germany). Inlays were cemented on respective teeth. Marginal and internal adaptations were then measured with the OCT system (Thorlabs, New Jersey, USA) in 200- μm intervals. Replica and OCT measurements were compared with independent samples t-tests. A paired t-test was used to evaluate the marginal and internal adaptations of each group (p < 0.05). Marginal and internal adaptations were 100.97 ± 31.36 and 113.94 ± 39.75 μm, respectively, using the replica technique and 28.97 ± 17.86 and 97.87 ± 21.83 μm, respectively, using OCT. The differences between
the techniques were signiicant (p = 0.00 and p = 0.01, respectively).
On evaluation within the groups, internal adaptation values were
found to be signiicantly higher than the marginal adaptation values for the replica technique (p = 0.00) and OCT (p = 0.00). Therefore, the
replica and OCT techniques showed different results, with higher values of marginal and internal adaptation found with the replica technique. Marginal and internal adaptation values of ceramic inlays, whether measured by replica or OCT techniques, were within clinically acceptable limits.
Keywords: Inlays; Replica Techniques; Tomography, Optical Coherence.
Introduction
All-ceramic materials have been used to restore teeth with highly esthetic demands and to achieve wear-resistant restorations, especially in posterior regions.1 They have been approved for the treatment of inlay
cavities, achieving a high survival rate and good esthetic result.2,3,4 Ceramic
inlays are advantageous, allowing for improved marginal adaptation. This is achieved due to the similarity of thermal expansion between the ceramic material and the tooth substance and the small amount of Declaration of Interests: The authors
certify that they have no commercial or associative interest that represents a conflict of interest in connection with the manuscript.
Corresponding Author:
Ayse Gozde Turk E-mail: [email protected]
https://doi.org/10.1590/1807-3107BOR-2018.vol32.0005
Submitted: Aug 24, 2017
shrinkage occurring through the polymerization of the composite luting cement.5,6,7 Besides these
advantages, marginal discoloration, postoperative sensitivity, and recurrent caries remain problems associated with adaptation properties of ceramic inlay restorations.5 Currently, lithium disilicate glass
ceramics have been used for inlay restorations, either processed with heat-pressed or computer-aided design–computer-aided manufacturing techniques.8
Regardless of the fabrication technique, marginal and internal adaptations are important factors that determine the longevity of restorations. Marginal adaptation has a substantial impact on longevity, since it prevents secondary caries and microleakage9
On the other hand, internal adaptation, illed with
a uniform luting cement layer, plays a crucial role in the durability of the restorations. Poorly adapted restorations cause a greater problem for posterior teeth, since the primary support is the weaker cement rather than the stronger tooth structure.10
Marginal and internal adaptations of ceramic inlay restorations have been evaluated by many studies using destructive techniques, such as sectioning samples into slices and then measuring with a stereomicroscope,11,12,13 and nondestructive techniques,
such as silicone replica with stereomicroscopy,14,15
resin replica with scanning electron microscopy (SEM),16 and micro-computed tomography (CT).9,10
Currently, nondestructive measurement techniques for evaluating adaptations of restorations are becoming increasingly common.9,10,16,17,18 Among nondestructive
techniques, the replica technique has been used as a reliable and valid noninvasive method to determine the adaptation of crowns or veneers to the tooth structure in in vivo and in vitro studies.14,15,19,20,21,22,23,24,25,26
Another nondestructive technique, optical coherence tomography (OCT), has been used to evaluate marginal
or internal it of restorations.17,18 OCT provides
high-resolution cross-sectional images based on the principle of the optical interferometer, which uses a
near infrared relected light that passes well through
biological structures and materials.27,28,29,30,31,32 OCT can
provide structure details and has been conirmed as
a proven technique in a clinical setting.30 In dentistry,
OCT has been mostly used to evaluate sealing performances of composite, amalgam restorations
or adhesives.17,18,27-29,33,34,35,36,37,38 However, according
to our knowledge, few studies exist in the literature related to the investigation of the adaptation of ceramic restorations to tooth structures using OCT. We quantitatively evaluated the marginal and internal adaptations of ceramic inlay restorations using OCT and compared the results with those of the silicone replica technique. Thus, the objectives of the study were to compare the OCT and replica techniques to
assess marginal and internal it and to investigate
the marginal and internal adaptation of ceramic inlays. The hypotheses of the study were as follows:
(1) there were no signiicant differences between the
adaptation values of the OCT and replica technique, and (2) marginal and internal adaptation of ceramic inlays had similar values.
Methodology
For the study, we selected 16 extracted human
maxillary irst premolar teeth free of caries, cracks,
and restorations. The number of inlays for each group was determined by a power calculation as 16 to detect a difference of 20 μm with a power of 80% and an error probability of 0.05. The same 16 teeth and inlays were analyzed via the replica and OCT
techniques (n = 16 per technique). Ethical approval
was obtained from the Research Ethics Committee of Ege University Medical Faculty (14-12.1/12). The teeth were stored in a saline solution for 30 days. Roots were embedded in plastic cylinders 3 mm away from the cervical lines using a self-curing acrylic resin. The orientations of the teeth long axes were obtained perpendicular to the surface of the plastic cylinders using a parallelometer (Degussa F1; DeguDent, Hanau, Germany). Tubercles were removed by trimming to
obtain a lat occlusal surface. Round class I occlusal
a polyvinyl siloxane impression material (Afinis
Precious; Coltane, Whaledent, Switzerland) with customized stock trays after the cavities were rinsed and air-dried. The teeth were then kept in water at room temperature.
Stone casts were prepared using Type IV dental die stone (GC Fujirock EP; GC Europe, Leuven, Belgium) according to the manufacturer’s instructions. One working cast and one master cast were acquired for each inlay. Cavity surfaces were lined with a die spacer (Rem-e-die; Ivoclar Vivadent, Schaan, Liechtenstein; approximately 10 μm) at 0.5 mm from the marginal areas. A full-contour inlay wax up was made for each stone die. Wax patterns were invested in a phosphate-bonded investment material (IPS Press Vest Speed; Ivoclar Vivadent). The pressing process was performed according to the manufacturer’s instructions using a pressable lithium disilicate glass-ceramic (IPS e.max Press; Ivoclar Vivadent) in a press furnace EP 600 (Ivoclar Vivadent) at 915°C. The inlays were devested and cleaned. The devested inlays were glazed with IPS e.max Ceram Glaze Liquid (Ivoclar Vivadent) in a Programat P200 furnace (Ivoclar Vivadent) at 770°C.
All 16 inlay restorations fabricated were itted on
their respective master dies. Minimal adjustments
on the internal surfaces were performed using a blunt diamond bur with low speed after marking with a silicone-disclosing medium (Fit Checker, GC
Europe). Internal surfaces were sandblasted (50 μm
alumina, 2 bar, 5 s). One expert dental technician fabricated the inlays.
Replica measurements
The inlays were inspected on their corresponding
teeth. Each inlay cavity was illed with a light-body
silicone (Elite HD Light Body Fast Setting; Zhermack, Rovigo, Italy) using the manufacturer’s dispenser. Then, the inlays were placed on the respective teeth with a constant load of 50 N using a universal testing machine (Shimadzu Corporation, Tokyo, Japan). After the light-body silicone material set, the
inlays with silicone ilms (replicas) were removed
from the teeth. The replicas were stabilized with a heavy-body silicone material (Elite HD, Zhermack) using the manufacturer’s dispenser. The inlays were removed from the silicones after the heavy-body silicone had set. The replicas with heavy-body silicone were cut into four equal segments with a razor blade buccolingually and mesiodistally. A light optical microscope (Leica Dfc 295; Leica Microsystems,
Bensheim, Germany) at a 40x magniication and the
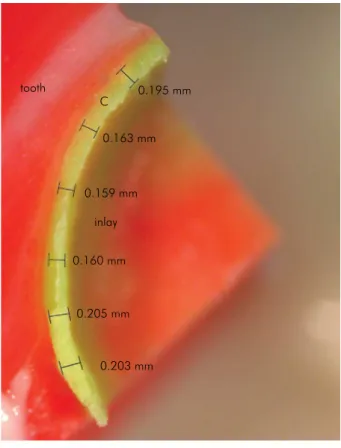
software (Leica Application Suite; Leica Microsystems) were used to measure the adaptation values. Marginal adaptations were measured at six points (Figure 2). Internal adaptations were measured at three points from axial walls and three points from the pulpal
loor of the replicas (Figure 3). Perpendicular distances
from the inlays to the teeth were used. A total of 72 points were measured per replica. Equidistant points to each other, dividing the measurement area into approximately equal segments, were used to standardize measurements among all specimens. Each measurement was repeated three times and the mean values were used. One investigator performed the measurements.
Cementation procedure
The teeth were cleaned with luoride-free pumice
before cementation using a polishing brush. Inlays were cemented with an adhesive luting system (Variolink N, Ivoclar Vivadent) according to the manufacturer’s Figure 1. A representative view of cavity dimensions of round
shaped Class I cavity: a = 1.5 mm occlusal dept, r = radius of the cavity.
a{
instructions as follows. Adherent surfaces of the teeth were etched with 37% phosphoric acid (30 s for enamel that remained at the occlusal surfaces, 15 s for dentine), rinsed with water, and then gently air-dried to remove excess water, leaving the cavity visibly wet.1,11 Teeth
surfaces were conditioned with Syntac Primer for 15s, air-dried, Syntac Adhesive for 10s, air-dried, and then Heliobond (Ivoclar Vivadent) was applied, air-thinned but not lightcured, respectively according to the manufacturer’s instructions (Variolink N, Ivoclar). The intaglio surfaces of the inlays were
etched with 4.9% hydroluoric acid (IPS Ceramic
Etching gel; Ivoclar Vivadent) for 20 s and were rinsed with water for 60 s, then air-dried. A silane coupling agent (Monobond S; Ivoclar Vivadent) was used for 60s, air-dried and then bonding agent (Heliobond, Ivoclar Vivadent) was applied, air-thinned, but not cured. Base and catalyst (1:1) of dual polymerizing resin cement (Lot: W36476, Variolink N, Ivoclar Vivadent) were mixed and applied in the cavities. Inlays were seated into the cavities with a constant load of 50 N in a universal testing machine (Shimadzu) to standardize the cementation procedures. Excess cement was removed and glycerin gel (Liquid Strip; Ivoclar Vivadent) was applied at the margins and then light-cured (Elipar S10; 3M ESPE, St Paul, MN, USA) for 40 s. Finishing was performed with finishing diamonds and polishing disks (SofLex Pop-on; 3M ESPE).
OCT measurements
OCT measurements of marginal adaptations of ceramic inlays were performed as described in a previous study using the Thorlabs OCT system,18
which took spectral domain OCT images with 930-nm wavelengths.39 The 100-nm-broad diode allowed for
low speckle noise imaging. The A-scan line rate was 1.2 kHz and the B-scan frame rate was 512 line/frame. Resolution of the OCT images in depth and lateral scan
were 7 μm and 8 μm, respectively. The imaging depth
was approximately 1.7 mm and the measurements had a signal-to-noise ratio (SNR) of 83 dB. OCT
spectrum was optimized on the B-scan to apply ine
adjustments. The tooth was placed in the reference arm so that the probe and beam oriented 90° with respect to the tooth occlusal surface. The infrared Figure 2. A representative stereomicroscopic image of the
replica: six points were used to measure marginal adaptation of the inlay (C, cement line).
0.195 mm
0.163 mm
inlay tooth
0.159 mm
0.160 mm
0.205 mm
0.203 mm C
Figure 3. Measurement of internal adaptation: three points were used from axial walls and three points from the pulpal floor of the replicas (C, cement line).
0.113 mm
0.133 mm
0.141 mm
0.136 mm inlay C tooth
beam irst hit the tooth from the occlusal surface and
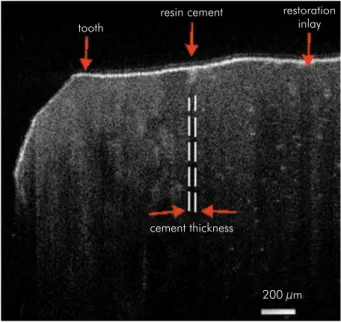
scanned over the entire marginal adaptation area (tooth-resin cement-inlay) in 200-μm intervals. The table on which the tooth was placed was adjustable with a micrometer screw to achieve a smooth and precise 200-μm incremental shift between successive measurements. Using the ruler tool on the image processing software, the marginal adaptation was measured and recorded during each scan (Figure 4). These data were then averaged to estimate the mean marginal adaptation values.
Internal adaptation measurements were performed by moving the teeth closer to the probe to scan a deeper internal region.37 The light beam from the OCT
source was projected onto the tooth from the occlusal area as previously for marginal measurements. Backscattered light that carried information about the internal adaptation (Figure 5) was saved and then examined in the Fourier domain by applying a
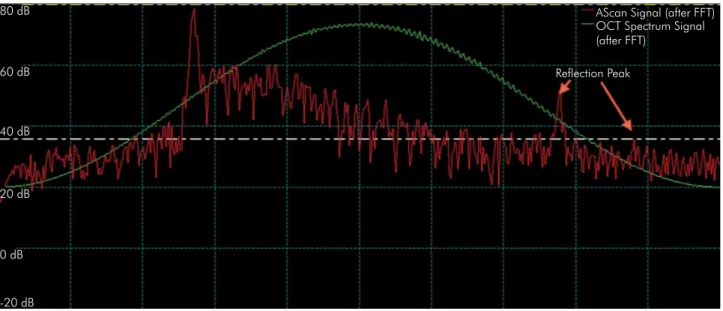
Fourier Transform (FT; Figure 6). Since light relected
from different sample depths produces interference patterns with the different frequency components, the FT data gave information about light scattered from the inlay, resin cement, and tooth. A strong back
relection due to an abrupt refractive index change resulted in the irst peak in the depth proile when the
light beam encountered ceramic inlay after air. The signal sees no peaks as it travels through a medium in which there are no large indexes of refractive changes.34 The signal level, therefore, will rise again
when light arrives at the resin cement interface. At the end of the resin cement there will be another slight peak. The magnitude of the peak becomes smaller as the light intensity is reduced as it travels into the sample. The optical path length between these two peaks corresponded to the optical path length of the resin cement. To convert the optical path length to the actual thickness, the optical path length should be divided to the refractive index of the luting cement, which is approximately 1.5 at the measured wavelength.35,36 This procedure resulted in
an accurate quantitative measurement of the internal adaptation. The conversion of optical path length to thickness is explained in the literature.40
Statistical analysis
Replica and OCT measurements of marginal and internal adaptation values of inlays were statistically evaluated with SPSS 13.0 (SPSS, Chicago, IL, USA). The Levene test was used to check the normality of the variances, and the independent samples t-test was used to compare the adaptation values between
Figure 4. A representative of optical coherence tomographic scan with transversal view of a tooth after inlay cementation. The marginal adaptation was measured from cement thickness.
tooth
resin cement
cement thickness
200 μm restoration
inlay
Figure 5. A representative transversal view of internal adaptation of ceramic inlay was measured through optical scan of internal resin cement.
tooth
resin cement
the replica and OCT groups. The paired t-test was used to evaluate marginal and internal adaptations of each group.
Results
Mean marginal and internal adaptation values of the ceramic inlays that were measured using the replica and OCT techniques are presented in the
Table 1. There were signiicant differences between the measurement techniques. Marginal (t = 41.32, F = 3.102, p = 0.00) and internal (t = 2.57, F = 6.57, p = 0.01) adaptation values were higher for replica
than for OCT measurements. When marginal and internal adaptation values were evaluated within
the groups, there were signiicant differences for replica (t = 3.34, p = 0.00) and OCT (t = 25.88, p = 0.00)
groups. Internal adaptation values were higher than the marginal adaptation values.
Discussion
According to our results, marginal and internal adaptation values with OCT were lower than those
with the replica technique. Thus, the irst hypothesis
was rejected. Marginal and internal adaptations of
ceramic inlays were 28.97 and 97.87 μm, respectively, with OCT and 100.97 and 113.94 μm, respectively, with
the replica technique. When marginal and internal adaptation values were evaluated within the groups,
signiicant differences were found between both
techniques. Internal adaptation values were higher than the marginal adaptation values. Thus, the second hypothesis was also rejected. Marginal adaptation value found by OCT technique showed better results than replica technique in this study. OCT systems have the advantage of real time and direct evaluation Figure 6. Fourier transform data of backscattered light from the inlay, resin cement, and tooth. A strong back reflection due to an abrupt refractive index change results in the first peak in the depth profile when the light beam encounters ceramic inlay after air. The signal sees no peaks as it travels through a medium in which there are no large indexes of refractive changes. Therefore, the signal level will rise again when light arrives at the resin cement interface. At the end of the resin cement, there will be another slight peak. The optical path length between these two peaks corresponds to the optical path length of the resin cement.
-20 dB 20 dB 40 dB 60 dB 80 dB
Reflection Peak
AScan Signal (after FFT) OCT Spectrum Signal (after FFT)
0 dB
Table 1. Mean marginal and internal adaptation values (μm) of inlays according to measurement techniques (n = 16).
Groups Mean Standart deviation p- value
Marginal
Replica 100.97a 31.36
0.00*
OCT 28.97c 17.86
Internal
Replica 113.94b 39.75
0.01*
OCT 97.87d 21.83
of the structures.36 However, the replica technique
indirectly represents the cement ilm thickness14 and
had some limitations and inherent errors, such as
identiication of restoration margins and inishing
lines.20,21 In addition, the defects on the replica or in
the cutting process could affect evaluation of the ilm
thickness.22,23 Higher adaptation values of ceramic
inlays measured using the replica technique in our study could have arisen due to the aforementioned factors related to the indirect evaluation. The OCT technique seemed to give more reliable information about the adaptation of inlays because of direct evaluation. It is important to assess restorations non-invasively especially in clinical conditions. The replica technique and OCT are reliable, reproducible, and noninvasive techniques used to determine in vivo and in vitro adaptation of restorations to tooth surface without causing damage.14,18,20,23,33,35 Thus in
this study replica and OCT techniques were used. Previous studies had proved the facility of OCT to investigate adaptation of restorations without cutting the specimens.27,33 OCT is a device that is capable of
obtaining precise tomographic images of the tissue without any invasion and can give fast data of the complete cavity and the restoration.29 In addition,
with development of intraoral probe, the OCT has been used for chair side evaluation.28 This approach
allows the clinician to evaluate a single image with the purpose of diagnosis secondary caries adjacent to restorations and the restoration-tooth structure interface due to the optical differences.28
Va r ious st udies have repor ted ma rg i n a l adaptation values of ceramic inlays ranging from 43 to 199 μm.12,13,14,15 Higher marginal adaptation
values are related to increased exposure of the luting cement to the oral environment, leading to an increased risk of plaque retention, caries, pulp pathology, and microcracks at the marginal edges of the restorative material or of the tooth structure.26
An acceptable marginal adaptation value in clinical conditions for ceramic restorations was reported to be < 120 μm to avoid wear of the luting cement.19
Thus, the marginal adaptation values of our study were within clinically acceptable limits. The internal adaptation, revealed by the thickness of the cement layer, is another key factor for long-term stability
of all-ceramic restorations. Although an adequate internal adaptation of a restoration is considered a
signiicant factor for longevity, optimum values for
internal adaptations have not been determined.26 Like
marginal adaptation measurement techniques, internal adaptations of restorations have been measured using destructive and nondestructive techniques. Among nondestructive techniques, OCT has been used previously to evaluate the internal adaptations of composite restorations.18,33,35 Internal adaptations of
metal-ceramic and all-ceramic veneers were evaluated in a previous study,38 but to our knowledge, internal
adaptation of ceramic inlays has not been evaluated in the literature. In our study, OCT was used to measure the internal adaptation values of ceramic inlays. Since the imaging depth of the OCT system used in our study was 1.7 mm, class I cavities that were 1.5 mm deep were prepared to evaluate internal adaptations. In several studies, internal adaptation values for ceramic inlays were reported to be 67–227 μm and internal adaptation values were higher than those of the marginal adaptations.14,26 Similar to these
results, internal adaptation values were higher than the marginal adaptation values with the replica and OCT techniques in our study. This could be related
to die spacer thickness or inishing techniques, such
as damage from the glass particles used to remove investment material from the inlays and using burs for adaptation procedures of inlays to teeth.
Measurement techniques of adaptations of restorations should be reliable, reproducible, and standardized. Most techniques for assessing marginal integrity of restorations, such as sectioning the samples and penetrating liquids, were destructive techniques that should be performed in vitro only.38
Nondestructive techniques, such as radiographs, CT, nuclear magnetic resonance, the replica technique, and OCT, have been used in vivo. Radiography and CT are invasive techniques for patients and have limited detection capacities.38 In our study, silicone replicas
were evaluated with the optical microscopes that are often used in studies.20,23 Measuring three-dimensional
(3D) replicas with computerized techniques24,25 and
micro-CT9,10 that allows high-resolution measurement
reported as applicable methods for the marginal and internal adaptation evaluation.25 In addition, one
study reported that marginal adaptation could not be measured by 3D since margins represent a line.24
Thus, two-dimensional analysis of replicas with an optical microscope seemed to be a proper technique.
The OCT system has been previously compared with other techniques, such as optical microscopy, SEM, confocal laser scanning microscopy, and acoustic emission techniques.31,32,35 According to these reports,
OCT provided similar results compared with other techniques. In addition, OCT was reported to have better visualization than SEM and optical microscopy.31
In our study, OCT showed lower adaptation values than the replica technique, with both values being within clinically acceptable limits. This could be
related to the different lowing characteristics of the
measured surfaces: light-body silicone for replica technique and luting cement for OCT.
OCT systems have the advantage of real-time evaluation of the structures. These systems have a wide range of wavelengths that produce interference images of structures.36 The OCT systems that have ≥1260 nm wavelengths penetrate more into tissue.18
These OCT systems were used in studies to evaluate
the whole image of the ixed partial denture as well
as qualitatively evaluate root canal or periodontal pocket.30,38 Marginal and internal adaptations were
evaluated in previous studies with lower wavelengths either qualitatively or quantitatively to obtain in-depth images.18,27,36 Similar to previous studies, in our
study, the OCT system with 930 nm wavelengths was used to quantitatively evaluate marginal and internal adaptations of ceramic inlays. Further studies should be performed to evaluate internal or marginal adaptations of restorations using OCT systems in vivo, since they could be used in clinical conditions for controlling adaptations of restorations by quantifying few micrometers gaps or diagnosing secondary caries under restorations non-invasively.
Conclusion
Within the limitations of this in vitro study, our results showed that the replica and OCT techniques had different marginal and internal adaptation values, with higher values of marginal and internal adaptation associated with the replica technique. Although OCT demonstrated lower results, all adaptation values were within clinically acceptable limits. The OCT system could be used to quantitatively evaluate adaptation of ceramic inlay restorations noninvasively.
1. Santos MJ, Freitas MC, Azevedo LM, Santos GC Jr, Navarro MF, Francischone CE et al. Clinical evaluation of ceramic inlays and onlays fabricated with two systems: 12-year follow-up. Clin Oral Investig. 2016 Sep;20(7):1683-90. https://doi.org/10.1007/s00784-015-1669-z
2. Holberg C, Winterhalder P, Wichelhaus A, Hickel R, Huth K. Fracture risk of lithium-disilicate ceramic inlays: a finite element analysis. Dent Mater. 2013 Dec;29(12):1244-50. https://doi.org/10.1016/j.dental.2013.09.012
3. Krämer N, Taschner M, Lohbauer U, Petschelt A,
Frankenberger R. Totally bonded ceramic inlays and onlays after eight years. J Adhes Dent. 2008 Aug;10(4):307-14. 4. Frankenberger R, Taschner M, Garcia-Godoy F, Petschelt A,
Krämer N. Leucite-reinforced glass ceramic inlays and onlays after 12 years. J Adhes Dent. 2008 Oct;10(5):393-8. 5. Uludag B, Yucedag E, Sahin V. Microleakage of inlay ceramic
systems luted with self-adhesive resin cements. J Adhes Dent. 2014 Dec;16(6):523-9.
6. Bott B, Hannig M. Effect of different luting materials on the marginal adaptation of Class I ceramic inlay restorations in vitro. Dent Mater. 2003 Jun;19(4):264-9. https://doi.org/10.1016/S0109-5641(02)00038-6 7. Uludag B, Ozturk O, Ozturk AN. Microleakage of ceramic
inlays luted with different resin cements and dentin adhesives. J Prosthet Dent. 2009 Oct;102(4):235-41. https://doi.org/10.1016/S0022-3913(09)60161-X 8. Trindade FZ, Valandro LF, Jager N, Bottino MA, Kleverlaan
CJ. Elastic properties of lithium disilicate versus feldspathic inlays: effect on the bonding by 3D finite element analysis. J Prosthodont. 2016 Oct. https://doi.org/10.1111/jopr.12550 9. Uzgur R, Ercan E, Uzgur Z, Çolak H, Yalçın M, Özcan M.
Cement thickness of inlay restorations made of lithium disilicate, polymer-infiltrated ceramic and nano-ceramic CAD/CAM materials evaluated using 3D X-ray micro-computed tomography. J Prosthodont. 2016 Aug. https://doi.org/10.1111/jopr.12521
10. Alajaji NK, Bardwell D, Finkelman M, Ali A. Micro-CT evaluation of ceramic inlays: comparison of the marginal and internal fit of five and three axis CAM systems with a heat press technique. J Esthet Restor Dent. 2017 Feb;29(1):49-58. https://doi.org/10.1111/jerd.12271
11. Keshvad A, Hooshmand T, Asefzadeh F, Khalilinejad F, Alihemmati M, Van Noort R. Marginal gap, internal fit, and fracture load of leucite-reinforced ceramic inlays fabricated by CEREC inLab and hot-pressed techniques. J Prosthodont. 2011 Oct;20(7):535-40. https://doi.org/10.1111/j.1532-849X.2011.00745.x PMID:21806704
12. Thordrup M, Isidor F, Hörsted-Bindslev P. Comparison of marginal fit and microleakage of ceramic and composite inlays: an in vitro study. J Dent. 1994 Jun;22(3):147-53. https://doi.org/10.1016/0300-5712(94)90198-8PMID:8027457 13. Audenino G, Bresciano ME, Bassi F, Carossa S. In vitro
evaluation of fit of adhesively luted ceramic inlays. Int J Prosthodont. 1999 Jul-Aug;12(4):342-7. PMID:10635204 14. Karakaya S, Sengun A, Ozer F. Evaluation of internal
adaptation in ceramic and composite resin inlays by silicon replica technique. J Oral Rehabil. 2005 Jun;32(6):448-53. https://doi.org/10.1111/j.1365-2842.2005.01443.x 15. Molin M, Karlsson S. The fit of gold inlays and
three ceramic inlay systems. A clinical and in vitro study. Acta Odontol Scand. 1993 Aug;51(4):201-6. https://doi.org/10.3109/00016359309040568 16. Ender A, Bienz S, Mörmann W, Mehl A, Attin T,
Stawarczyk B. Marginal adaptation, fracture load and macroscopic failure mode of adhesively luted PMMA-based CAD/CAM inlays. Dent Mater. 2016 Feb;32(2):e22-9. https://doi.org/10.1016/j.dental.2015.11.009 17. Han SH, Sadr A, Tagami J, Park SH. Non-destructive
evaluation of an internal adaptation of resin composite restoration with swept-source optical coherence tomography and micro-CT. Dent Mater. 2016 Jan;32(1):e1-7.
https://doi.org/10.1016/j.dental.2015.10.009 18. Türk AG, Sabuncu M, Ünal S, Önal B, Ulusoy M.
Comparison of the marginal adaptation of direct and indirect composite inlay restorations with optical coherence tomography. J Appl Oral Sci. 2016 Jul-Aug;24(4):383-90. https://doi.org/10.1590/1678-775720160012
19. McLean JW, Fraunhofer JA. The estimation of cement film thickness by an in vivo technique. Br Dent J. 1971 Aug;131(3):107-11. https://doi.org/10.1038/sj.bdj.4802708 20. Falk A, Steyern PV, Fransson H, Thorén MM. Reliability
of the impression replica technique. Int J Prosthodont. 2015 Mar-Apr;28(2):179-80. https://doi.org/10.11607/ijp.4132 21. Gemalmaz D, Kükrer D. In vivo and in vitro
evaluation of marginal fit of class II ceromer inlays. J Oral Rehabil. 2006 Jun;33(6):436-42. https://doi.org/10.1111/j.1365-2842.2005.01562.x 22. Quante K, Ludwig K, Kern M. Marginal and internal fit
of metal-ceramic crowns fabricated with a new laser
melting technology. Dent Mater. 2008 Oct;24(10):1311-5. https://doi.org/10.1016/j.dental.2008.02.011PMID:18384869 23. Laurent M, Scheer P, Dejou J, Laborde G. Clinical evaluation
of the marginal fit of cast crowns—validation of the silicone replica method. J Oral Rehabil. 2008 Feb;35(2):116-22. https://doi.org/10.1111/j.1365-2842.2003.01203.x 24. Kim KB, Kim JH, Kim WC, Kim HY, Kim JH. Evaluation
of the marginal and internal gap of metal-ceramic crown fabricated with a selective laser sintering technology: two- and three-dimensional replica techniques. J Adv Prosthodont. 2013 May;5(2):179-86. https://doi.org/10.4047/jap.2013.5.2.179
25. Park JY, Bae SY, Lee JJ, Kim JH, Kim HY, Kim WC. Evaluation of the marginal and internal gaps of three different dental prostheses: comparison of the silicone replica technique and three-dimensional superimposition analysis. J Adv Prosthodont. 2017 Jun;9(3):159-69. https://doi.org/10.4047/jap.2017.9.3.159
26. Guess PC, Vagkopoulou T, Zhang Y, Wolkewitz M, Strub JR. Marginal and internal fit of heat pressed versus CAD/CAM fabricated all-ceramic onlays after exposure to thermo-mechanical fatigue. J Dent. 2014 Feb;42(2):199-209. https://doi.org/10.1016/j.jdent.2013.10.002 27. Turkistani A, Sadr A, Shimada Y, Nikaido T, Sumi Y,
Tagami J. Sealing performance of resin cements before and after thermal cycling: evaluation by optical coherence tomography. Dent Mater. 2014 Sep;30(9):993-1004. https://doi.org/10.1016/j.dental.2014.05.010 28. Lenton P, Rudney J, Chen R, Fok A, Aparicio C, Jones
RS. Imaging in vivo secondary caries and ex vivo dental biofilms using cross-polarization optical coherence tomography. Dent Mater. 2012 Jul;28(7):792-800. https://doi.org/10.1016/j.dental.2012.04.004
29. Minamino T, Mine A, Omiya K, Matsumoto M, Nakatani H, Iwashita T et al. Nondestructive observation of teeth post core space using optical coherence tomography: a pilot study. J Biomed Opt. 2014 Apr;19(4):046004. https://doi.org/10.1117/1.JBO.19.4.046004 30. Kim SH, Kang SR, Park HJ, Kim JM, Yi WJ, Kim TI.
Improved accuracy in periodontal pocket depth measurement using optical coherence tomography. J Periodontal Implant Sci. 2017 Feb;47(1):13-9. https://doi.org/10.5051/jpis.2017.47.1.13
31. Matheus TC, Kauffman CM, Braz AK, Mota CC, Gomes AS. Fracture process characterization of fiber-reinforced dental composites evaluated by optical coherence tomography, SEM and optical microscopy. Braz Dent J. 2010;21(5):420-7. https://doi.org/10.1590/S0103-64402010000500008 32. Lin CL, Kuo WC, Chang YH, Yu JJ, Lin YC.
33. Bakhsh TA, Sadr A, Shimada Y, Mandurah MM, Hariri I, Alsayed EZ et al. Concurrent evaluation of composite internal adaptation and bond strength in a class-I cavity. J Dent. 2013 Jan;41(1):60-70. https://doi.org/10.1016/j.jdent.2012.10.003 34. Melo LS, Araujo RE, Freitas AZ, Zezell D, Vieira
ND, Girkin J et al. Evaluation of enamel dental restoration interface by optical coherence tomography. J Biomed Opt. 2005 Nov-Dec;10(6):064027. https://doi.org/10.1117/1.2141617
35. Makishi P, Shimada Y, Sadr A, Tagami J, Sumi Y. Non-destructive 3D imaging of composite restorations using optical coherence tomography: marginal adaptation of self-etch adhesives. J Dent. 2011 Apr;39(4):316-25. https://doi.org/10.1016/j.jdent.2011.01.011
36. Monteiro GQ, Montes MA, Gomes AS, Mota CC, Campello SL, Freitas AZ. Marginal analysis of resin composite restorative systems using optical coherence tomography. Dent Mater. 2011 Dec;27(12):e213-23. https://doi.org/10.1016/j.dental.2011.08.400
37. Braz AK, Kyotoku BB, Braz R, Gomes AS. Evaluation of crack propagation in dental composites by optical coherence tomography. Dent Mater. 2009 Jan;25(1):74-9. https://doi.org/10.1016/j.dental.2008.04.011
38. Sinescu C, Negrutiu ML, Todea C, Balabuc C, Filip L, Rominu R et al. Quality assessment of dental treatments using en-face optical coherence tomography. J Biomed Opt. 2008 Sep-Oct;13(5):054065.
https://doi.org/10.1117/1.2992593 39. Yilmazlar I, Sabuncu M. Speckle noise
reduction based on induced mode hopping in a semiconductor laser diode by drive current modulation. Opt Laser Technol. 2015 Oct;73:19-22. https://doi.org/10.1016/j.optlastec.2015.04.014 40. Sabuncu M, Akdoğan M. Utilizing optical coherence