Amanda C. Simões da Silva* Technologycal Institute of Aeronautics São José dos Campos – Brazil [email protected]
Mischel Carmen N. Belderrain Technologycal Institute of Aeronautics São José dos Campos – Brazil [email protected]
Francisco Carlos M. Pantoja Institute of Aeronautics and Space São José dos Campos – Brazil [email protected]
* author for correspondence
Prioritization of R&D projects in
the aerospace sector: AHP method
with ratings
Abstract: The prioritization of R&D projects in the Aerospace Sector is considered a complex problem because it involves qualitative and quantitative issues that are frequently conlicting. This paper aimed to apply the AHP (Analytic Hierarchy Process) method with ratings to select projects of R&D in a Brazilian aerospace institution, Department of Science and Aerospace Technology (DCTA). The results showed that using ratings is appropriate when there is a great quantity of projects, since it reduces the judgments required to the decision maker.
Keywords: Prioritization of Research and Development Projects (R&D), AHP, Ratings.
INTRODUCTION
Nowadays, most of organizations have been facing
dificulties regarding the evaluation of projects prioritization. These dificulties are due to the complexity
of the problems analyzed before a decision making.
In literature, the selection of R&D projects is considered a complex problem because it involves qualitative and quantitative issues that are frequently conlicting. It also presents risks and uncertainties, as well as the necessity
of balancing important factors, interdependence between
projects and a great number of feasible portfolios
(Ghasemzadeh and Archer, 2000).
In order to deal with the complexity of decision making problems with many criteria, some methods to support it can be used. These methods aim to clarify the decision-making process, assisting and guiding the decision maker (or makers) regarding structure, evaluation
and alternatives of the problem (Gomes, Gomes and Almeida, 2006).
This work aimed to apply the Analytic Hierarchy Process (AHP) method with ratingsto selectaerospace
R&D projects of a sector in a Brazilian aerospace
organization. Using ratings means categorizing
previously defined criteria and/or subcriteria in order to classify alternatives. This procedure is suitable when there are many projects, since this procedure reduces the number of judgment required to the decision
maker.
As an example, we describe the application exercise of
the Department of Science and Aerospace Technology
(DCTA), São José dos Campos, São Paulo, Brazil.
This work is presented as follows: irst, we describe the prioritization of R&D projects and the Analytic Hierarchy Process (AHP) method with ratings; next, we explain the application of the proposed method to select projects of R&D aerospace; inally, we present the inal considerations.
THEORETICAL REFERENCE
Prioritization of R&D projects
According to Weisz (2006), R&D projects are risky and require long-term investments.
Selecting the best R&D projects means to choose projects whose responsible organization will support them inancially.
According to Meade and Presley (2002), the selection
of R&D projects is frequently based on inancial criteria such as Net Present Value (NPV) and Internal Rate of Return (IRR). Despite the importance of such criteria, the authors claim that once the decisions must be strategically considered, other criteria must be taken into account, even though it is dificult to quantify.
The R&D selection and prioritization is performed in a decision-making environment depicted by multicriteria that allow the use of Multiple-Criteria Decision-Making methods (MCDM), including the Analytic Hierarchy Process (AHP) method using ratings.
Received: 08/10/10 Accepted: 26/10/10
Silva, A. C. S. et al.
Analytic Hierarchy Process using ratings
Developed by Thomas L. Saaty in 1980, the AHP is one of
the irst methods developed in an environment of discrete multicriteria decision. The AHP method divides the problem
into hierarchic levels, which makes its comprehension and
evaluation easier and clearly determines a global action for each alternative by the value synthesis of the decision makers, prioritizing or classifying them after inalizing the method.
According to Saaty (2008), to make a decision in an
structured way and generate priorities, we need to decompose the decision into the following steps: 1) deine the problem and determine the kind of knowledge sought, 2) structure
the decision hierarchy starting from the top with the goal of
the decision, and of the objectives from a broad perspective, through the intermediate levels (criteria on which subsequent elements depend) to the lowest level (which usually is a set of the alternatives), 3) construct a set of pairwise comparison matrices. Each element in upper levels is used to compare
the elements of the immediately lower level with respect to
it and, 4) use of priorities obtained from the comparisons to weigh the priorities in the immediately lower level. This must
be performed for each element. Then for each element in the
lower level, the weighed values are added and the overall or global priority is obtained. Continue this process of weighing and adding until the inal priorities of the alternatives in the
bottom levels are obtained. The AHP method will not be
detailed. For further details see Saaty (1980).
Step 1: Deine the problem and determine the kind of knowledge sought
In this step the goal of the decision process is decided, the
criteria and subcriteria are identiied based on the decision maker’s values and beliefs, as well as the alternatives of
decision to solve the problem.
Step 2: Structure the decision hierarchy
The hierarchy structure is build aiming at the top decision,
followed by intermediate levels (the criteria on which the posterior elements depend) to the inferior level (which is
usually a set of alternatives). Based on a representation of a decision problem in a hierarchic structure, the decision maker builds the pairwise matrix of the elements.
Step 3: Construct a set of pairwise comparison matrices
Pairwise comparison matrices are built from results between elements, considering the Saaty Fundamental
Scale (Saaty, 1980). Each element in the upper level is used to compare the elements of an immediate inferior
level with respect to the former. That is, the alternatives
are compared with respect to the subcriteria, the subcriteria are compared with respect to the criteria and
these criteria are compared with respect to the global
objective.
In this step, the veriication of the pair comparison judgments consistency is also made.
Step 4: Use the priorities obtained from the comparisons to weigh the priorities in the immediately lower level
The last step refers to the obtainment of elements priorities (called eigenvector or priority vectors) to
generate the inal values of the alternative priorities.
The local priorities obtained from the comparisons
are used to ponder the priorities of the immediately lower level for each element. Thus, pondered values
are added for each element in lower levels, and the total or global priority is obtained. The total priorities
of the alternatives are found by multiplying their local
priorities by the global alternatives of all criteria and
respective subcriteria, resulting in the addition of the results to all alternatives. Therefore, we obtain the
priority ranking of alternatives and also of the criteria
and subcriteria.
Ratings (absolute measurement)
Duarte Júnior (2005) deines ratings as a set of
intensity levels (or categories) that serves as a base to
evaluate the performance of the alternatives in terms of each criterion and/or subcriterion. The categories that form the ratings must be clearly deined, in the less ambiguous way as possible, to adequately describe the criterion/subcriteria. The rating is considered suitable
as the decision makers consider it an appropriate tool
to evaluate alternatives.
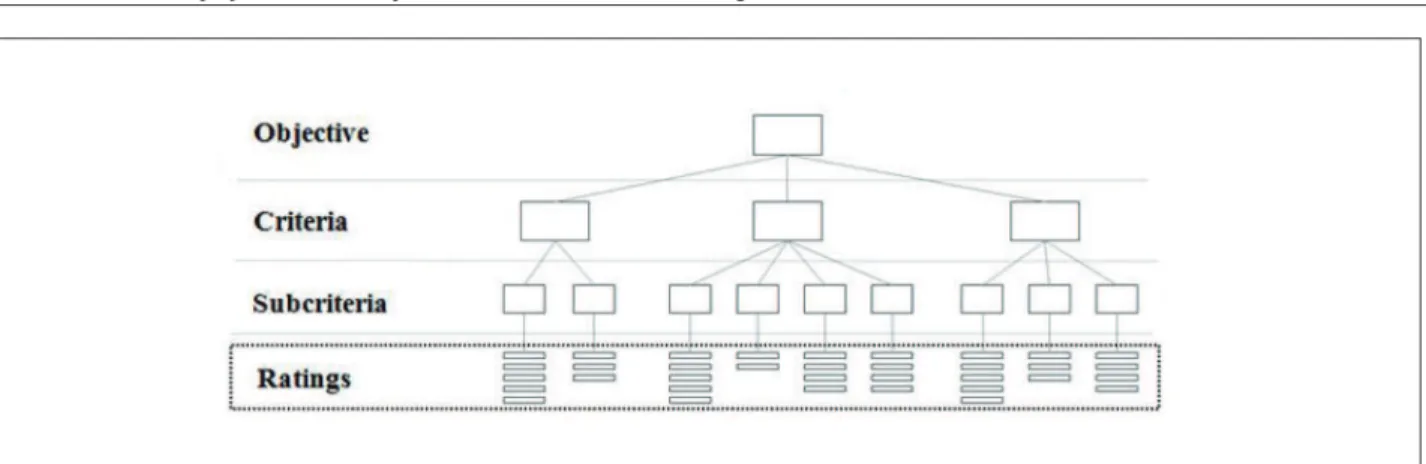
Figure 1 shows the hierarchy structure from the rating mode. The hierarchy begins with the global objective. The
criteria are at the second level. The categories associated
to the subcriteria are at the last level.
The structure with ratings differs from the traditional AHP (relative measurement), because in the last level the alternatives are not found. The evaluation is performed by intensity levels (categories) attributed to each subcriteria related to each alternative, instead of evaluating the
Prioritization of R&D projects in the aerospace sector: AHP method with ratings
To establish the relative importance of these categories (obtaining priority vectors), the specialist’s (or specialists’)
values/opinions are incorporated to the rating system.
Duarte Júnior (2005) presents proposals to obtain numerical values of ratings (priority vectors) such as
pairwise comparison process of AHP method. In this proposal, the rating pairwise comparisons are performed
to deine the priorities of each criterion (or subcriterion).
Saaty (1987, 2006, 2008) suggests that when working with
ratings the priority vectors obtained are idealised, that is,
the best category receives the value 1 and the others must be proportionally smaller. The synthesis of results, that is, the alternatives of inal priorities are found by adding the values referring to the multiplication between the
properties of each category and the global priorities of the
criteria/subcriteria in these categories.
The main advantage of using ratings is to decrease the number of comparisons necessary when there are a large number of alternatives. Besides, when using absolute measurement (ratings), it does not matter how many new alternatives are introduced, or old ones are excluded because there is no inversion of the alternatives ranking.
The software Expert Choice and SuperDecisions include, besides the traditional AHP, the AHP with ratings (absolute measurement). In this paper, a brief description of AHP with ratings is presented and the application exercise used the software SuperDecisions, developed by Creative Decisions Foundation.
AHP APPLICATION WITH RATINGS: SELECT
PROJECTS OF R&D AEROSPACE (DCTA)
The application of the AHP method in this paper is based
on the study case of Lima and Damiani, 2010.
Step 1: Deine the problem and determine the kind of knowledge sought
Lima and Damiani (2010) present a proposal of problem
structuring to prioritize the aerospace R&D projects. The authors reported that the goal of this proposal was to suggest an analytical structure that could enable a R&D institution acting in the aerospace sector to identify and structure their own decision criteria in relation to the selection process of R&D processes, with a wide range
of possibilities.
The study case of Lima and Damiani (2010) has been
performed in the Department of Science and Aerospace
Technology (DCTA). This organization, founded in 1953, focus the progress of technical-scientiic activities related to the aerospace education, research and development that
are interesting to the Ministry of Defense.
As R&D projects prioritization is a complex decision-making problem, the authors preferred structuring the problem through a tool of cognitive maps, employing the constructivist paradigm of decision support.
Therefore, the purpose of this work was to select aerospace R&D projects, in association with the organization strategies. This paper is based on the problem structuring
of Lima and Damiani (2010). The MCDM method chosen
for this evaluation is the AHP using ratings. The decision
maker is the same as Lima and Damiani (2010).
The criteria are: Potential to generate Innovation (PI),
Technological Maturity (TM), Duality (D), Operational Alignment (OA), Means Availability (MA), Risk Response (RR), and Opportune Attendance (OpA). The MA criterion presents the subcriteria: Finance Resources (FR), Human Capacitation (HC), and Infrastructure (IS). More details and further explanation of the criteria and subcriteria are found in Lima and Damiani (2010).
Silva, A. C. S. et al.
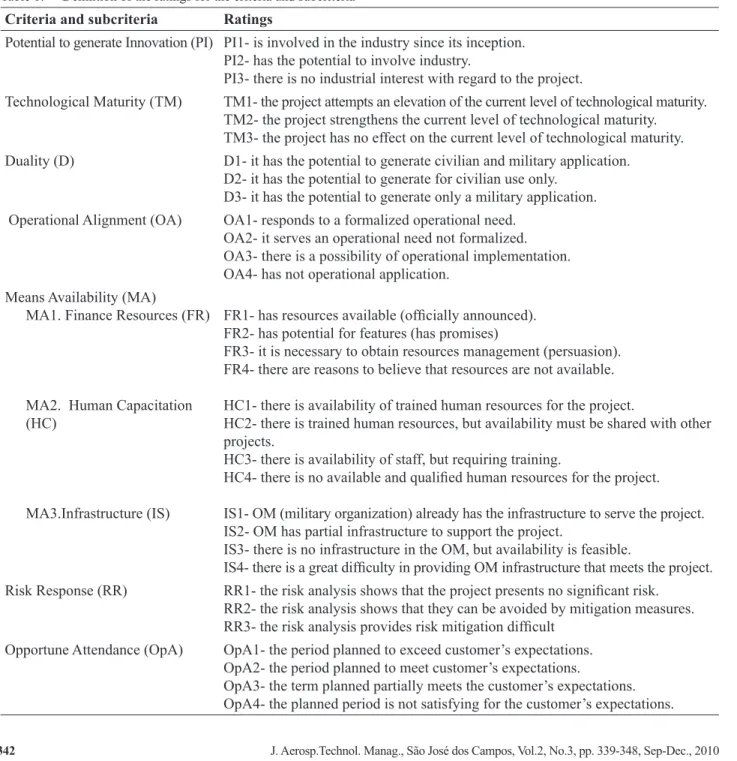
All criteria and subcriteria were considered independent, as the AHP method indicates. The deinition of the ratings for problem criteria and subcriteria follows Table 1.
The alternatives selected by the organization are ive big R&D projects named: Project A, Project B, Project C, Project D and Project E. Three of these projects are real projects of the institution.
Step 2: Structure the decision hierarchy
Figure 2 presents the hierarchy structure for the problem of aerospace R&D projects selection. The irst hierarchic
level is the global objective: “prioritize projects”. On the
second level, the main aspects that the decision maker has to
consider when performing the prioritization of R&D projects are Strategic Alignment (SA) and Realization Potential (RP). On the third level, the criteria and, on the fourth level, the subcriteria. In the last level, the categories (Table 1) that describe the associated criteria and subcriteria are found.
According to the decision maker, this hierarchy is used to evaluate small and big projects. The AS aspects are more important when bigger projects are evaluated.
After the problem is formulated, and the hierarchy is built and validated, the judgment process is started when the
Criteria and subcriteria Ratings
Potential to generate Innovation (PI) PI1- is involved in the industry since its inception.
PI2- has the potential to involve industry.
PI3- there is no industrial interest with regard to the project.
Technological Maturity (TM) TM1- the project attempts an elevation of the current level of technological maturity. TM2- the project strengthens the current level of technological maturity.
TM3- the project has no effect on the current level of technological maturity. Duality (D) D1- it has the potential to generate civilian and military application.
D2- it has the potential to generate for civilian use only.
D3- it has the potential to generate only a military application.
Operational Alignment (OA) OA1- responds to a formalized operational need. OA2- it serves an operational need not formalized. OA3- there is a possibility of operational implementation. OA4- has not operational application.
Means Availability (MA)
MA1. Finance Resources (FR)
MA2. Human Capacitation
(HC)
MA3.Infrastructure (IS)
FR1- has resources available (oficially announced). FR2- has potential for features (has promises)
FR3- it is necessary to obtain resources management (persuasion). FR4- there are reasons to believe that resources are not available.
HC1- there is availability of trained human resources for the project.
HC2- there is trained human resources, but availability must be shared with other projects.
HC3- there is availability of staff, but requiring training.
HC4- there is no available and qualiied human resources for the project.
IS1- OM (military organization) already has the infrastructure to serve the project. IS2- OM has partial infrastructure to support the project.
IS3- there is no infrastructure in the OM, but availability is feasible.
IS4- there is a great dificulty in providing OM infrastructure that meets the project. Risk Response (RR) RR1- the risk analysis shows that the project presents no signiicant risk.
RR2- the risk analysis shows that they can be avoided by mitigation measures. RR3- the risk analysis provides risk mitigation dificult
Opportune Attendance (OpA) OpA1- the period planned to exceed customer’s expectations. OpA2- the period planned to meet customer’s expectations.
OpA3- the term planned partially meets the customer’s expectations. OpA4- the planned period is not satisfying for the customer’s expectations.
decision makers express their preferences through the pairwise comparison matrices of the criteria/subcriteria
and ratings.
Step 3: Construct a set of pairwise comparison matrices
In this step, the decision matrix is formed in order to obtain the values of importance of the criteria, subcriteria and ratings. These values attribution is based on Saaty’s Fundamental Scale (Saaty, 1980). For each decision, the Consistency Ratio (CR) is calculated.
The priorities of each category are determined by using
the pairwise comparison process of AHP method.
The decision matrices are shown as follows. Table
2 presents decision matrices of judgments of the
main aspects that the decision maker considers
when prioritizing the R&D projects in relation to the objective.
Table 3 presents the decision matrix of judgments between
the criteria with respect to and SA aspect.
Table 4 presents the decision matrix of judgments between the criteria with respect to RP aspect.
Table 5 presents the decision matrix of judgments between the subcriteria with respect to and Means Availability
(MA).
In order to obtain the numerical values of ratings, a comparison matrix between the rating intensity levels was built. Through this matrix, the relative importance among levels of intensity was found, calculating the
Figure 2: Hierarchy structure for the problem.
Objective SA RP Priorities
SA 1 3/2 0.6
CR=0.0
RP 2/3 1 0.4
Table 2: Decision matrix of judgments of the main aspects
with respect to the objective
Table 3: Decision matrix of judgments of the criteria with
respect to the SA aspect
SA PI TM D OA Priorities
PI 1 1 3 3 0.367
CR=0.0039
TM 1 4 3 0.396
D 1 1 0.114
OA 1 0.122
RP MA RR OpA Priorities
MA 1 4 3/2 0.532
CR=0.0089
RR 1 1/2 0.146
OpA 1 0.322
Table 4: Decision matrix of judgments for criteria with respect to the RP aspect.
MA FR HC IS Priorities
FR 1 1 1 0.337
CR=0.0904
HC 1 3 0.457
IS 1 0.207
Table 5: Decision matrix of judgments for the subcriteria with
self-vector that represents the “performance” for each
intensity level.
The rating numerical values for the criteria and subcriteria are presented in tables. These ratings must be idealised before the alternative inal priorities calculation.
Table 6 presents a decision matrix of comparisons for the
rating levels of intensity with respect to the Potential of Generating Innovation (PI).
Table 7 presents a decision matrix of comparisons for the
ratings levels of intensity with respect to the criteria of
Technological Maturity (TM).
Table 8 presents a decision matrix of comparisons for the
rating levels of intensity with respect to the criteria of
Duality (D).
Table 9 presents a decision matrix of comparisons for the
rating levels of intensity with respect to the criteria of
Operational Alignment (OA).
PI PI1 PI2 PI3 Priorities Idealised priorities
PI1 1 3 7 0.659 1.000
PI2 1 4 0.263 0.399
PI3 1 0.079 0.119
Table 6: Decision matrix of comparisons for the rating levels
of intensity with respect to the Potential of generating
Innovation (PI) (CR=0.0311)
TM TM1 TM2 TM3 Priorities Idealised
priorities
TM1 1 3 5 0.627 1.000
TM2 1 4 0.280 0.446
TM3 1 0.094 0.149
Table 7: Decision matrix of comparisons for the rating
levels of intensity with respect to the criteria of
Technological Maturity (TM) (CR=0.0824)
D D1 D2 D3 Priorities Idealised priorities
D1 1 1 2 0.413 1.000
D2 1 1 0.327 0.794
D3 1 0.260 0.630
Table 8: Decision matrix of comparisons for the rating levels of intensity with respect to the criteria of Duality (D) (CR=0.0516)
OA OA1 OA2 OA3 OA4 Priorities Idealised priorities
OA1 1 1 2 7 0.412 1.000
OA2 1 1 3 0.282 0.684
OA3 1 3 0.231 0.562
OA4 1 0.075 0.181
Table 9: Decision matrix of comparisons for the rating levels of intensity with respect to the criteria of Operational Alignment (OA) (CR=0.0290)
FR FR1 FR2 FR3 FR4 Priorities Idealised priorities
FR1 1 2 4 7 0.536 1.000
FR2 1 1 3 0.215 0.401
FR3 1 3 0.181 0.339
FR4 1 0.068 0.128
Table 10: Decision matrix of comparisons for the ratings levels of intensity with respect to the subcriteria of Finance Resources (FR) (CR=0.0188)
HC HC1 HC2 HC3 HC4 Priorities Idealised priorities
HC1 1 3 4 7 0.542 1.000
HC2 1 3 5 0.269 0.496
HC3 1 4 0.137 0.252
HC4 1 0.052 0.096
Table 11: Decision matrix of comparisons for the rating levels of intensity with respect to the subcriteria of Human Capacitation (HC) (CR=0.0638)
Table 10 presents a decision matrix of comparisons for the rating levels of intensity with respect to the subcriteria of Finance Resources (FR).
Table 11 presents a decision matrix of comparisons for the ratings levels of intensity with respect to the subcriteria of Human Capacitation (HC).
Table 12 presents a decision matrix of comparisons for the rating levels of intensity with respect to the subcriteria of Infrastructure (IS).
Table 13 presents a decision matrix of comparisons for
the rating levels of intensity with respect to the criteria of
OpA OpA1 OpA2 OpA3 OpA4 Priorities Idealised priorities
OpA1 1 1 4 7 0.444 1.000
OpA2 1 2 3 0.338 0.761
OpA3 1 4 0.162 0.365
OpA4 1 0.055 0.125
Table 14: Decision matrix of comparisons for the ratings levels of intensity with respect to the criteria of Opportune Attendance (OpA) (CR=0.0354)
Table 14 presents a decision matrix of comparisons for
the rating levels of intensity with respect to the criteria of
Opportune Attendance (OpA).
The judgment consistency was made through pairwise matrices. All the presented CR (Consistency Ratio) less than 10% (or 0,1) indicate the judgment coherence of the
decision makers.
Step 4: Use the priorities obtained from the comparisons to weigh the priorities in the level immediately below
Based on the vectors generated by the method, the local priorities of the criteria and subcriteria were obtained.
Figure 3 presents the global priorities of the criteria and subcriteria (in parentheses) and the numerical values of the ratings (idealised) for criteria and subcriteria.
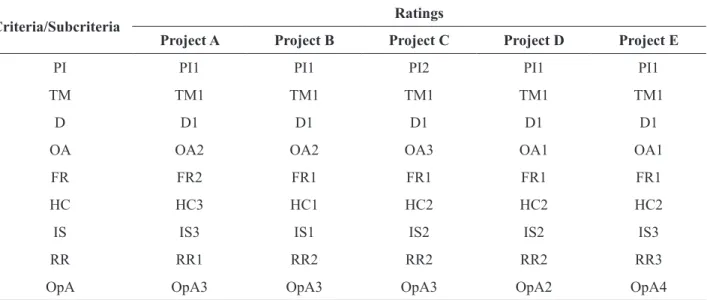
Table 15 presents the classiication of alternatives (projects) in the criteria and subcriteria ratings corresponding to the
categories (Fig. 3).
Figure 3: Global priorities and idealised ratings of criteria/subcriteria. IE IE1 IE2 IE3 IE4 Priorities Idealised
priorities
IE1 1 2 3 9 0.507 1.000
IE2 1 2 4 0.280 0.552
IE3 1 3 0.157 0.310
IE4 1 0.055 0.108
Table 12: Decision matrix of comparisons for the rating levels of intensity with respect to the subcriteria of Infrastructure (IS) (CR=0.0030)
RR RR1 RR2 RR3 Priorities Idealised priorities
RR1 1 2 7 0.592 1.000
RR2 1 5 0.333 0.563
RR3 1 0.075 0.127
Graphic Ratings alternatives Total Ideal Normal Ranking
Project A 0.7492 0.8562 0.1916 4
Project B 0.8694 0.9937 0.2224 2
Project C 0.6593 0.7535 0.1686 5
Project D 0.8749 1.0000 0.2238 1
Project E 0.7569 0.8651 0.1936 3 Table 17: Ranking of the alternatives
Criteria/Subcriteria Ratings
Project A Project B Project C Project D Project E
PI PI1 PI1 PI2 PI1 PI1
TM TM1 TM1 TM1 TM1 TM1
D D1 D1 D1 D1 D1
OA OA2 OA2 OA3 OA1 OA1
FR FR2 FR1 FR1 FR1 FR1
HC HC3 HC1 HC2 HC2 HC2
IS IS3 IS1 IS2 IS2 IS3
RR RR1 RR2 RR2 RR2 RR3
OpA OpA3 OpA3 OpA3 OpA2 OpA4
Table 15: Classiication of the alternatives in ratings
Alternatives (0.220)PI (0.238)TM (0.069)D (0.073)OA (0.072)FR (0.097)HC (0.044)IS (0.058)RR (0.129)OpA Total Final Priorities
Project A 1.000 1.000 1.000 0.684 0.401 0.252 0.310 1.000 0.365 0.749 0.192
Project B 1.000 1.000 1.000 0.684 1.000 1.000 1.000 0.563 0.365 0.869 0.222
Project C 0.399 1.000 1.000 0.562 1.000 0.496 0.552 0.563 0.365 0.659 0.169
Project D 1.000 1.000 1.000 1.000 1.000 0.496 0.552 0.563 0.761 0.875 0.224
Project E 1.000 1.000 1.000 1.000 1.000 0.496 0.310 0.127 0.125 0.757 0.194
Table 16: Final priorities of the alternatives
Table 16 presents a inal punctuation for each Project. It is calculated by adding the products between the global priorities of the criteria and subcriteria and the ratings values for each alternative, thus obtaining the “Totals” column which normalized presents the inal punctuation (“Final priorities”). For example, for Project A, we have:
Totals_Project_A = (0.220 x 1.000) + (0.238 x 1.000) + (0.069 x 1.000) + (0.073 x 0.684) + (0.072 x 0.401) + (0.097x 0.252) + (0.044 x 0.310) + (0.058 x 1.000) + (0.129 x 0.365) = 0.749
Table 17 presents the inal priorities (in graphics) for the alternatives. The columns “Total” and “Normal” are equivalent to the total and inal priorities of Table 16, respectively. The column “Ideal” is obtained by dividing all elements of “Total” by its highest value.
In this case, the best evaluated project is Project D, followed by Project B, Project E, Project A and Project C.
they have similar evaluations. Moreover, it is worth noting that the use of AHP method does not allow analyzing the portfolio projects with respect to resource constraints. In this case, one would have to use a hybrid methodology, such as AHP method and
integer programming.
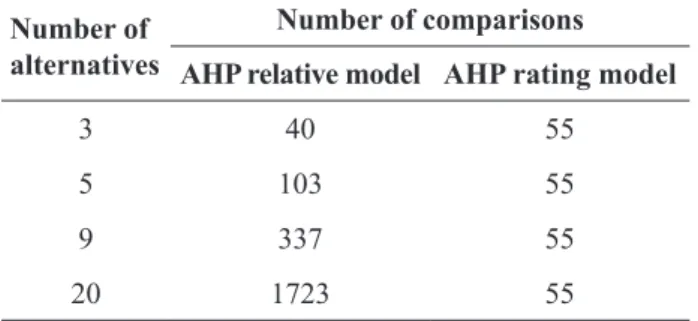
For this problem, 55 comparisons were performed, as shown in Table 18.
been structured before, with ratings deined by Lima and
Damiani (2010).
However, there are many ways to evaluate and select projects for the problem. Thus, the parts involved must
decide and adapt the best method to the problem decision,
in agreement with its speciic requirements.
For further studies, the implementation of procedures, ratings and BOCR (beneits, opportunities, cost and risks) in the AHP method is suggested.
ACKNOWLEDGMENTS
The authors thank Conselho Nacional de Desenvolvimento Cientíico e Tecnológico (CNPq) for the inancial support.
REFERENCES
Duarte Júnior, A.M., 2005, “Gestão de riscos para fundos de investimentos”, Prentice Hall, São Paulo, pp.
141-155.
Ghasemzadeh, F., Archer, N.P., 2000, “Project portfolio selection through decision support”, Decision Support Systems, Vol. 29, pp. 73-88. doi:
10.1016/S0167-9236(00)00065-8.
Gomes, L.F.A.M, Gomes, C.F.S. and Almeida, A.T., 2006,
“Tomada de decisão gerencial: enfoque multicritério”, São Paulo, Atlas.
Lima, A.S., Damiani, J.H.S., 2010, “Proposta de método para modelagem de critérios de priorização de projetos de pesquisa e desenvolvimento aeroespaciais”, In: Marins, F.A.S.; Pereira, M.S.; Belderrain, M.C.N.; Urbina, L.M.S. (Org.), Métodos de tomada de decisão com múltiplos critérios: aplicações na indústria aeroespacial. 1 ed. São Paulo: Edgard Blucher Ltda., Vol. 1, pp. 77-107.
Meade L.M., Presley, A. 2002, “R&D project selection using the analytic network process. IEEE Transactions on Engineering Management”, Vol. 49, No 1, pp. 55-66. doi:
10.1109/17.985748.
Saaty, R.W., 2003, “Decision making in complex. The
analytic hierarchy process for decision making and the analytic network process for decision making with
dependence and feedback” [Superdecisions Tutorial].
Saaty, T.L., 2008, “Decision making with the analytic hierarchy process”, International Journal of Services
Sciences, Vol. 1, No 1, pp. 83-97.
Number of alternatives
Number of comparisons AHP relative model AHP rating model
3 40 55
5 103 55
9 337 55
20 1723 55
Table 18: Comparative study between AHP relative model and
AHP rating model
However, in comparison with the AHP relative model,
as the alternative number increases, the number of
comparisons increases considerably, while in AHP rating model, it remains the same.
It is known that, depending on the complexity of the problem, the use of AHP ratings model is advantageous, because it can signiicantly reduce time and effort in the
decision-making process.
FINAL CONSIDERATIONS
The aim of this paper was to present a proposal of project selection and prioritization, through Multiple-Criteria
Decision-Making methods (MCDM), AHP with ratings.
The use of this procedure enables the reduction of judgment numbers required to decision maker when the alternatives are numerous. Besides, it enables the insertion and removal of alternatives without inverting the ranking during the decision-making process.
The problem hierarchy in this paper considers “aspects” in the irst level rather than criteria as we see in most applications. The reason for using “aspects” is a better perception and evaluation by the decision maker.
These characteristics are advantageous once they allow the representation of a complex problem of projects
selection and prioritization. The application of the method
Saaty, T.L., 2006, “Rank from comparisons and from ratings in the analytic hierarchy/netwok processes”, European Journal of Operational Research, Vol. 168, No
2, pp. 557-570. doi: 10.1016/j.ejor.2004.04.032.
Saaty, T.L., 1987, “Concepts, theory and techniques: Rank generation, preservation and reversal in the analytic hierarchy process”, Vol. 18, Decision Sciences.
Saaty, T.L., 1980, “The analytic hierarchy process”,
McGraw-Hill, New York.