ISSN 0104-6632 Printed in Brazil
www.abeq.org.br/bjche
Vol. 28, No. 01, pp. 73 - 79, January - March, 2011
Brazilian Journal
of Chemical
Engineering
TREATMENT OF WELDING ELECTRODE
MANUFACTURING PLANT WASTEWATER USING
COAGULATION/FLOCCULATION-NANOFILTRATION AS A HYBRID PROCESS
H. A. Golestani
1*, M. Mousavi
2and M. Borghei
31
Department of Energy and Environment, Islamic Azad University, Science & Research Branch, Tehran, Iran. E-mail: [email protected]
2
Department of Chemical Engineering, Faculty of Engineering, Ferdowsi University of Mashhad, Mashhad, Iran. 3Department of Chemical, and Petroleum Engineering, Sharif University of Technology, Tehran, Iran.
(Submitted: July 29, 2010 ; Revised: October 11, 2010 ; Accepted: October 11, 2010)
Abstract - High water consumption and water scarcity make industrial wastewater reuse necessary, especially in those industries characterized by polluted effluents such as welding electrode manufacturingindustries. The present paper investigates the coupling of coagulation-flocculation withnanofiltration (NF) to recycle water and reuse it in the process. First, the effect of different concentrations of a mixture of alum (Al2(SO4)3.18H2O)
and ferric chloride (FeCl3) on the pretreatment process was closely studied. Then the NF process was applied
for complementary treatment. The NF results show that, by increasing both flow rate and transmembrane pressure (TMP), permeate flux is increased. The NF results also show that the COD value decreases below 2 mg/l, TDS rejection approaches 82%, turbidity decreases below 1 NTU and the hardness is lower than the factory constraint (100 mg/l as CaCO3), allowing the reuse of the treated wastewater in the process.
Keywords:Nanofiltration; Wastewater treatment; Welding electrode; Coagulation-flocculation.
INTRODUCTION
The decrease in natural water resources and population growth are inciting authorities to encourage the reuse of wastewater in industries. Thus, in developed and developing countries, the reuse of wastewater is undergoing fast expansion toward optimum consumption of water and reduction of environmental pollution (Avula et al. 2009; Lu et al. 2009).
The increase in water preparing costs and the obligation to respect the standards of wastewater disposal compel manufacturers to rethink residual waters in industries such as welding electrode manufacturing, electroplating and textile industries (Boricha and Murthy 2009). Residual water can be considered to be an important water resource, especially for the high water consumers in industry (Bes-Piá et al., 2009). Water is used in significant
quantities in welding electrode manufacturing plants
and the wastewater produced contains suspended
particle, organic matter, and high dissolved solids; therefore, it must be treated before being discharged into environment or being reused.
In industrial wastewater treatment, NF is a more attractive process because it operates at a lower pressure (about half the pressure required for a reverse osmosis system) but maintains the same flux, resulting in lower energy costs and investment savings on a lower pressure pump and piping (Amar et al., 2009; García-Figueruelo et al., 2009). The effectiveness of the separation process depends on many factors including the type and surface charge characteristics of the membrane used, module configuration, mode of operation, operating pressure, temperature, feed pH, feed flow rate, feed concentration and percentage of product recovery (Benítez et al., 2009; Boricha and Murthy, 2009; Lau and Ismail, 2009). A pilot study of the nanofiltration process has been reported for the treatment and recycling of a spent final rinse in previous works (He et al., 2009; Tansel et al., 2009; Zhang et al., 2009); but there is not any reported work where a nanofiltraton membrane system is used specifically for treating wastewater resulting from manufacture of welding electrodes. So this paper presents the application of NF process following coagulation-flocculation for the treatment of the wastewater. The study also establishes the optimum transmembrane pressure (TMP) and flow rate for a special NF membrane.
MATERIALS AND METHODS
Sampling
A welding electrode manufacturing unit was selected for sampling the wastewaters. Different types of electrodes are produced in this industrial unit and the type of the covering materials of the electrode rods varies depending on their application. Based on the type of the product and the raw materials used, the
properties of the discharged wastewater change; therefore, a suitable wastewater sample had to be prepared for the experiments. To provide a homogenized mixture of the different types of wastewater, in accordance with the monthly production schedule, the sampling of wastewater from the end line was done twice per day. After removal of coarse suspending particles, the collected samples were stored in a suitable tank to separate fine particles capable of undergoing sedimentation. This wastewater, which represents the average properties of the raw wastewater produced in this industrial unit, was reserved for later experimentations.
Analysis of the Raw Wastewater
The raw wastewater from the previous step was analyzed to determine its chemical and physical properties. The results are shown in Table 1.
Nanofiltration Pilot Plant
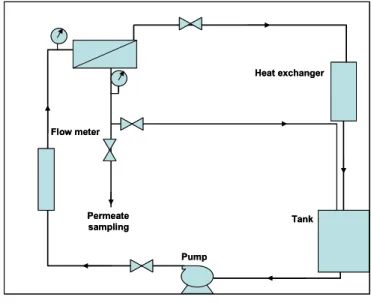
The nanofiltration pilot consists of a membrane cell, heat exchanger, booster pump, feed reservoir, pressure gauge, flow meter and regulating valve as assembled in Fig. 1. The pump is connected with a belt to an electric motor and the flow rate can be varied by changing the pump rotation using belt-wheels with various diameters.
The membrane module is a flat-sheet type having an effective membrane surface area of 98.5 cm2. The trade name of the membrane is UTC-70UB and it is made by Toray Company. This membrane consists of three layers: a) 0.3 µm polyamide as dense layer, b) 45 µm polysulfone as support layer, and c) a 100 µm polyester layer as the base layer. The molecular weight cut off (MWCO) is 200 Dalton.
Tank Heat exchanger
Permeate sampling
Pump Flow meter
Tank Heat exchanger
Permeate sampling
Pump Flow meter
RESULTS AND DISCUSSION
Coagulation and Flocculation
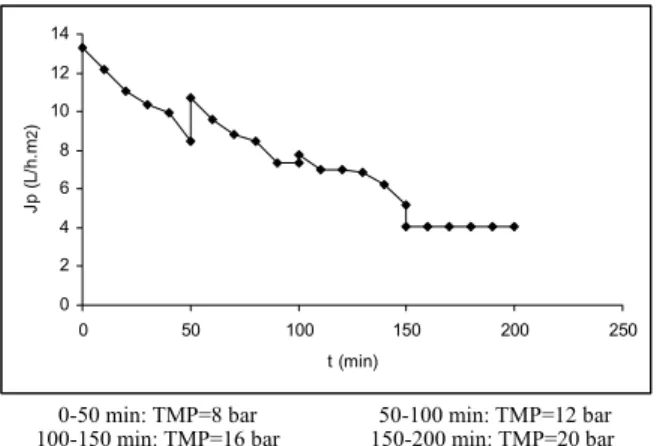
As shown in the second column of Table 1, turbidity and total solids (TS) of the raw wastewater are high. It is predictable that nanofiltration treatment for this wastewater is impossible without any pretreatment. So, to find the effects of the wastewater on membrane performance, the raw wastewater was passed through the cross flow module in the nanofiltration pilot with different TMP; the results are shown in Fig. 2.
0 2 4 6 8 10 12 14
0 50 100 150 200 250
t (min)
J
p
(
L
/h
.m
2
)
0-50 min: TMP=8 bar 50-100 min: TMP=12 bar 100-150 min: TMP=16 bar 150-200 min: TMP=20 bar
Figure 2: Permeate flux reduction in terms of time for TMP of 8, 12, 16, and 20 bar
The operation was performed in a batch constant concentration mode, where the retentate was recirculated to the feed tank. The TMP was varied between 8-20 bar and the operating temperature was kept constant at 25°C.
As shown in Fig. 2, cake layer formation and fouling phenomena occurred rapidly because of the high turbidity and TS of the raw wastewater. After each increase in TMP, permeate flux (Jp) sharply increased and then reduced with time. The necessity of pretreatment was clearly obvious; therefore, the coagulation-flocculation process was selected as a pretreatment process for the raw wastewater before nanofiltration.
Coagulation-flocculation was done in three steps: rapid mixing at 10 g (300 rpm) for one minute, gentle mixing at 1g (100 rpm) for 15 minutes, and sedimentation for 240 minutes. Three levels of gentle mixing (30, 75,100 rpm) were examined and the rate of precipitation for 100 rpm was the fastest. This is because the blades of the stirrer are not big enough compared to the jar radius.
Various mixtures of alum and ferric chloride were used as coagulants in different concentrations. The results showed that 2.5 g/l coagulant consisting of 25% alum and 75% ferric chloride was an optimum concentration. In this condition, the turbidity was reduced from 690 to 9.68 NTU,
implying a turbidity reduction of 98.59%. This dose seems to be high, but doses lower than 2.5 g/l could not effect removal of colloidal particles for this specific wastewater. We suggest the use of different coagulant aids and continuing the experiments with regard to economy.
The properties of the pretreated wastewater are shown in the third column of Table 1. The results show that the values of TDS and EC are increased due to coagulant addition and the wastewater is acidic. Therefore, it was necessary to reduce the dissolved solids and other pollutants by another process. For this purpose, nanofiltration was applied as an advanced filtration process for the secondary treatment of the wastewater. The influence of TMP, feed flow rate, and time on permeate flux and quality of treated wastewater was then investigated.
Influence of TMP, Feed Flow Rate, and Time on Permeate Flux of the NF Process
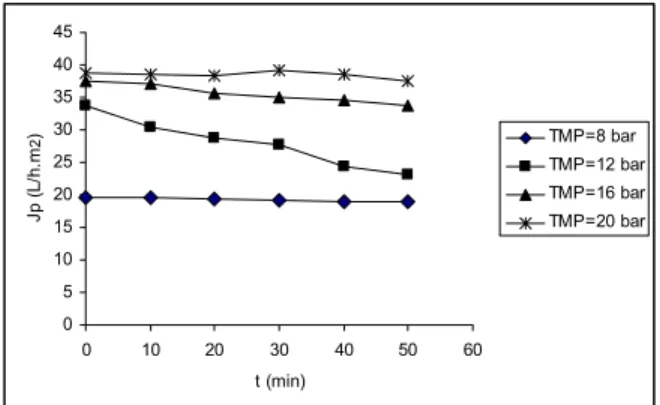
As the first step in the nanofiltration process, a new membrane sheet was installed in the module. The pilot was started and the feed flow rate was adjusted to 1.4 L/min. As shown in Fig. 3, the permeate fluxes of the NF membrane decreased with increasing filtration time for all pressures until they reached steady-state values. Similar results have been obtained by other researchers (Kilduff et al., 2004; Ahmad et al., 2005). In addition, increasing the TMP from 8 to 20 bar increases the permeate fluxes. Similar experiments were done for other flow rates such as 3, 4.5, and 6 L/min; the results are shown in Figs. 3-6.
0 5 10 15 20 25 30
0 10 20 30 40 50 60
t (min) Jp ( L /h .m 2
) TMP=8 bar
TMP=12 bar TMP=16 bar TMP=20 bar 0 5 10 15 20 25 30 35 40 45
0 10 20 30 40 50 60
t (min) Jp ( L /h .m 2
) TMP=8 bar
TMP=12 bar
TMP=16 bar
TMP=20 bar
Figure 3: Effect of TMP on permeate flux in term of time for feed flow rate of 1.4 L/min
Figure 4: Effect of TMP on permeate flux in term of time for feed flow rate of 3 L/min
0 5 10 15 20 25 30 35 40 45
0 10 20 30 40 50 60
t (min) Jp ( L /h .m 2
) TMP=8 bar
TMP=12 bar TMP=16 bar TMP=20 bar 0 10 20 30 40 50 60
0 20 40 60
t (min) J p ( L /h .m 2
) TMP=8 bar
TMP=12 bar
TMP=16 bar
TMP=20 bar
0 20 40 60
t (min) TPM=8 bar TPM=12 bar TPM=16 bar TPM=20 bar 0 10 30 40 50 20 60 Jp (L /h .m 2 ) 0 10 20 30 40 50 60
0 20 40 60
t (min) J p ( L /h .m 2
) TMP=8 bar
TMP=12 bar
TMP=16 bar
TMP=20 bar
0 20 40 60
t (min)
TPM=8 bar TPM=12 bar TPM=16 bar TPM=20 bar
0 20 40 60
t (min) TPM=8 bar TPM=12 bar TPM=16 bar TPM=20 bar 0 10 30 40 50 20 60 Jp (L /h .m 2 ) 0 10 30 40 50 20 60 0 10 30 40 50 20 60 30 40 50 20 60 Jp (L /h .m 2 )
Figure 5: Effect of TMP on permeate flux in term of time for feed flow rate of 4.5 L/min
Figure 6: Effect of TMP on permeate flux in term of time for feed flow rate of 6 L/min
Influence of TMP and Feed Flow Rate on the Quality of Wastewater Treated with the NF Process
A suitable quantity of permeate was sampled at the end of each experiment to determine the treated wastewater quality. The results of the sample analyses are represented in the fourth column of Table 1. The effects of variations of TMP and flow rate on turbidity are shown in Fig. 7. As shown in
this figure, increasing TMP causes turbidity reduction. By TMP increase, the flow of solvent and other components through the membrane is increased, but the amount of solvent flow is more than that of other components; thus, the total concentration of colloidal particles in the permeate is reduced and the treated wastewater is more transparent. Referring to Fig. 7, it can be concluded that the measured turbidity does not vary significantly with flow rate variation.
Table 1: Values of the wastewater quality parameters
Parameters Raw wastewater After pretreatment After nanofiltration
COD (mg/L) 180 70 8-1
TS (mg/L) 4805 4305 886-517
TSS (mg/L) 2285 45 28-21
EC ( s / cm)μ 3585 4624 1235-811
TDS (mg/L) 2520 4260 862-496
Turbidity (NTU) 690 9.68 1.1-0.3
pH 10.6 4.5 4.5-4.3
Alkalinity (mg/L) 1765 0 0
Pb (mg/L) 0.453 0.0065 0.0055-0.0030
Zn (mg/L) 0 0 0
Fé (mg/L) 5.61 0.176 0.0117-0.006
0 0.3 0.6 0.9 1.2
0 5 10 15 20 25
transmembrane pressure (bar)
T
u
rb
id
it
y
(N
T
U
)
Q= 1.4 L/min Q=3 L/min
Q=4.5 L/min Q=6 L/min
Figure 7: Effect of TMP and feed flow rate on turbidity
The effect of TMP and flow rate on TDS reduction is shown in Fig. 8. Referring to Table 1, it can be seen that the amount of TDS in raw wastewater is 2520 mg/l and it is increased to 4260 mg/l due to coagulant addition in the pretreatment process. As shown in Fig. 8, increasing TMP and flow rate causes TDS reduction, but the effect of flow rate is greater than that of TMP. Other works show similar results (Sridhar et al., 2002; Saitúa et al., 2005). By increasing the flow rate, the concentration polarization is decreased since the turbulency is increased due to the increase in the tangential velocity on the membrane surface; thus, the TDS of treated wastewater is reduced. Also, as mentioned above, increasing the TMP causes an increase in solvent and solute flow through the membrane. Since the solvent flow increased more than that of the solute, the concentration of solutes in the permeate decreased and thus the TDS is reduced.
0 200 400 600 800 1000
4 6 8 10 12 14 16 18 20 22
Transmembrane pressure (bar)
T
D
S
(
m
g
/L
)
Q=1.4 L/min Q=3 L/min Q=4.5 L/min Q=6 L/min
Figure 8: Effect of TMP and feed flow rate on TDS reduction
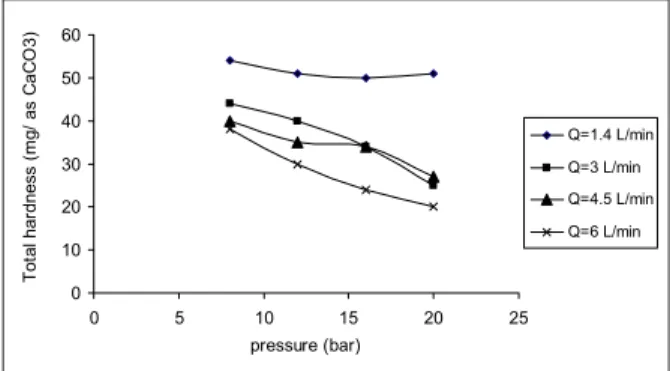
The effect of TMP and flow rate on hardness reduction is shown in Fig. 9. Regarding this Figure according to the reasons mentioned for the TDS variation, increasing both TMP and flow rate causes the hardness reduction.
Fig. 10 shows the effect of TMP and flow rate on COD reduction by nanofiltration. As shown in this figure, the reduction of COD is significant and the amount of COD is reduced from 70 to below 8 mg/L at the first level of flow rate. Referring to the reasons mentioned for TDS reduction, increasing both TMP and flow rate causes COD reduction in the permeates; additionally, it has been shown in other researches that COD rejection is increased by increasing the cross-flow velocity (Saitúa et al., 2005; Sarkar et al., 2007). The COD analyzer does not have adequate accuracy for amounts of COD less than 2mg/L, so the curves show unpredictable variations below 2mg/L.
0 10 20 30 40 50 60
0 5 10 15 20 25
pressure (bar)
T
o
ta
l
h
a
rd
n
e
ss
(
m
g
/
a
s
C
a
C
O
3
)
Q=1.4 L/min
Q=3 L/min
Q=4.5 L/min
Q=6 L/min
Figure 9: Effect of TMP and feed flow rate on hardness reduction
0 2 4 6 8 10
5 7 9 11 13 15 17 19 21
Transmembrane pressure (bar)
C
O
D
(
m
g
/L
)
Q=1.4 L/min Q=3 L/min Q=4.5 L/min Q=6 L/min
Figure 10: Effect of TMP pressure and feed flow rate on COD reduction
CONCLUSION
In the NF process, permeate flux is decreased as time passes for each TMP and flow rate because of concentration polarization and fouling phenomena. In addition, increasing both TMP and flow rate leads to an increase in permeate flux; however, the effect of increasing flow rate is greater than that of TMP.
TDS, hardness, and COD are reduced with increasing TMP and flow rate. At the final step of treatment, the amount of COD decreases from 180 to below 2 mg/L and the turbidity is reduced to less than 1 NTU. Also, TDS rejection approaches 82% and the hardness is lower than the factory constraint (100 mg/l as CaCO3), allowing the reuse of the
treated wastewater in the process.
ACKNOWLEDGMENT
This work has been supported by the Iran Nanotechnology Initiative Council.
NOMENCLATURE
COD chemical oxygen demand mg/L
EC electric conductivity μs / cm
Jp permeate flux m3 /m2. hr
NF nanofiltration
NTU nephelometry turbidity unit
TDS total dissolved solids mg/L
TMP transmembrane pressure bar
TS total solids mg/L
REFERENCES
Ahmad, A. L., Ismail, S. and Bhatia, S., Membrane treatment for palm oil mill effluent: Effect of transmembrane pressure and crossflow velocity. Desalination, 179, No. 3, 245 (2005).
Amar, N. B., Kechaou, N. and Palmeri, J., Comparison of tertiary treatment by nanofiltration and reverse osmosis for water reuse in denim textile industry. Journal of Hazardous Materials, 170, No. 1, 111 (2009).
Anouzla, A. Abrouki, Y. and Hicham, Colour and COD removal of disperse dye solution by a novel coagulant: Application of statistical design for the optimization and regression analysis. Journal of Hazardous Materials, 166, No. 2, 130 (2009). Avula, R. Y. and Nelson, H. M., Recycling of poultry
process wastewater by ultrafiltration. Innovative Food Science & Emerging Technologies, 10, No.1, 10 (2009).
Benítez, F. J., Acero, J. and Francisco, J., The use of ultrafiltration and nanofiltration membranes for the purification of cork processing wastewater. Journal of Hazardous Materials, 162, No. 2, 1438 (2009).
Bes-Piá, A., Iborra-Clar, A., and Garcia-Fegueruelo,
C., Comparison of three NF membranes for the reuse of secondary textile effluents. Desalination, 241, No. 3, 1 (2009).
Borbély, G. and Nagy, E., Removal of zinc and nickel ions by complexation-membrane filtration process from industrial wastewater. Desalination, 240, No. 3, 218 (2009).
Boricha, A. G. and Murthy Z. V. P., Preparation, characterization and performance of nanofiltration membranes for the treatment of electroplating industry effluent, Separation and Purification Technology, 65, No. 3, 282 (2009). Cséfalvay, E., Pauer, V. and Mizsey, P., Recovery of
copper from process waters by nanofiltration and reverse osmosis. Desalination, 240, No.1, 132 (2009).
García-Figueruelo, C., Bes-Piá, A. and Mendoza-Roca, J. A., Reverse osmosis of the retentate from the nanofiltration of secondary effluents. Desalination, 240, No. 1, 274 (2009).
He, Y. Li Guang-Ming, W. and Hua, J., Experimental study on the rejection of salt and dye with cellulose acetate nanofiltration membrane. Journal of the Taiwan Institute of Chemical Engineers, 40, No. 3, 289 (2009).
Kilduff, J. E. and Mattaraj, S., Flux decline during nanofiltration of naturally-occurring dissolved organic matter: effects of osmotic pressure, membrane permeability, and cake formation. Journal of Membrane Science, 239, No. 1, 39 (2004).
Lau, W. J. and Ismail, A. F., Polymeric nanofiltration membranes for textile dye wastewater treatment: Preparation, performance evaluation, transport modelling, and fouling control - a review. Desalination, 245, No. 1, 32 (2009).
Lee, Y. and Clark, M. M., Modeling of flux decline during crossflow ultrafiltration of colloidal suspensions. Journal of Membrane Science, 149, No. 2, 181(1998).
Lu, X. and Liu, L., Reuse of printing and dyeing wastewater in processes assessed by pilot-scale test using combined biological process and sub-filter technology. Journal of Cleaner Production, 17, No.2, 111 (2009).
Saitúa, H. and Campderrós, M., Effect of operating conditions in removal of arsenic from water by nanofiltration membrane. Desalination, 172, No. 2, 173 (2005).
Sridhar, S., and Kale, A., Reverse osmosis of edible vegetable oil industry effluent. Journal of Membrane Science, 205, No. 1, 83 (2002).
Tansel, B., Sager, J. and Garland, J., Effect of transmembrane pressure on overall membrane resistance during cross-flow filtration of solutions with high-ionic content. Journal of Membrane Science, 328, No. 2, 205 (2009).
Turan, M., Influence of filtration conditions on the performance of nanofiltration and reverse osmosis membranes in dairy wastewater treatment. Desalination, 170 No.1, 83 (2004). Zhang, Y., Ma, C. and Ye, F., The treatment of