ISSN 0104-6632 Printed in Brazil
www.abeq.org.br/bjche
Vol. 24, No. 02, pp. 171 - 184, April - June, 2007
Brazilian Journal
of Chemical
Engineering
FAST-TRACK EVALUATION OF A COMPACT
CHEMICALLY ENHANCED-TRICKLING
FILTER SYSTEM
S. A. R. Ahmed
*Chemical Engineering & Pilot Plant Department, National Research Center, Phone: +(20) (2) 3371499, Fax: +(20) (2) 3370931, El Tahrir St., Dokki, Cairo, Egypt.
E-mail: [email protected]
(Received: March 20, 2006 ; Accepted: September 27, 2006)
Abstract - With the more Stringent legislations pertinent to the management of industrial effluents, it deemed
necessary to develop an efficient compact, low cost treatment system that complies with applicable laws. Numerous versions of chemically enhanced - biological treatment schemes are commercially established. Chemically enhanced-trickling filter has been perceived as an efficient intervention scheme. This paper presents a fast-track approach for estimation of the minimum total annual treatment cost for the proposed Chemically Enhanced Primary Treatment/ Trickling Filter (CEPT-TF) system under given sets of conditions. The effect of different chemicals has been incorporated through empirical performance formulas. In addition, the influence of the type and characteristic of the media filter has been also addressed. The analysis of the results of the performance of the first stage of the treatment scheme tends to indicate that about 80 % of the biological pollution load can be removed by the upstream chemical treatment at the optimal dose. The optimal economic dose of iron salts ranges from 30 to 40 ppm according to unit capacity and characteristics of the influent. Further, the effect of biological filter media type on the total annual cost has been found to be relatively insignificant (6-16) %
Keywords: Chemically enhanced; Trickling filter; Industrial wastewater; Simulation; Cost.
INTRODUCTION
Chemically enhanced-biological treatment systems manifest numerous merits including, compact structure that decreases footprint and capital cost and possibilities of tolerating peak flows or peak loads which could be achieved via increasing the applied chemical doses, removal of considerable percentage of the non degradable matter and possibilities of targeting hazardous contaminants at the first upstream chemical treatment.
Earlier reported field and R&D investigations have indicated the superior performance of chemical treatment for industrial effluents management (Willem 1940 and Gordon 1967). Robinson et al
(2001), observed poor removal of acid dyes but excellent removal of direct dye with ferric chloride dose of about 50 ppm. Irene (2000) indicated optimal doses of ferric chloride of 40-50 ppm for a COD reduction of (65-85 %) and TSS reduction of (90-100 %) for several wastewater plants in Brazil. Other studies have addressed the performance of pilot and full scale trials using dosages of (20-45), (60-100) and (0-2) ppm for FeCl3, alum and polymer respectively to achieve (70-82)% and (35-60)% removal of SS and BOD respectively (Nenov 1995 and Nandy 2002).
municipal and industrial effluents. New trickling filter installations are controlled by, and take advantages of, the benefits offered by various media types and shapes in addition to simple operation, low power consumption and low sludge production, (Mann 1997 and Randall 1997). In spit of these advantages, it is relatively liable for clogging and the nitrification capacity loads may be decreased by the sensitivity of autotrophic bacteria to shock loads. Also, for concentrated wastes, a high rate of recirculation would be required for significant reduction of organics.
Biological filter is particularly suited for treatment of moderate BOD load or as a polishing step in combination with other techniques (WEF 1996, Stadterman 1995 and Parker 1996). It could also be used, in some cases, as a roughing filter for a high-strength wastewater (USEPA 2000). TFs, are currently used in conjunction with other treatment methods to treat wastewaters from refineries, pharmaceuticals, pulp and paper, textile mills, tanneries, breweries and distilleries (Oeller 1997, Pedersen 1997 and Rusten 1996), gases decontamination and pretreatment of volatile organic compounds (Miao 2005, Koh 2004, Neal 2000, Lu 2003, Wang 2002) and in potable water treatment for the removal of iron (Michalakos 1997), manganese (Gouzinis 1998) and nitrifying purposes (Vayenas 1995). TFs are conventionally teamed up with activated sludge to reduce the mixed flow to the later (De Clercq 1999).
The first process design approach of TF using fundamental principals was primarily discussed by Velz (1948). Recently, Seguret et al (2000) have studied the hydrodynamic behavior of eight full scale trickling filters (stone and plastic packed) through the investigation of RTD and the free drainage volume. The results indicated that different types of packing do not have the same retention time. Vayenas et al (1997) have developed other dynamic model, which describes nitrification in TF. The results predict that the best moment to start the continues operation is the moment when a maximum in nitrate and a minimum in nitrite concentrations is observed, otherwise a nitrobacter phenomena will occur which leads to filter failure. Pedersen and Arvin (1997) have studied the overall mass transfer coefficient in a trickling filter for treatment of toluene-containing waste gas. The overall mass transfer coefficient value was 25-140 % larger in the
trickling filter with a biofilm present than in the clean biotic system. The difference has been explained by improved wetting and, consequently, an enlarged mass transfer area. Kroumins et al (2000) have developed a mathematical model that predicts relationship between Reynolds number and the probability distribution of flow rate under trickling flow.
Study of flow pattern characterization has been conducted by Seguret (2000) and Gouzinis (1998). They concluded that, manganese removal efficiency up to 94 % was achieved for sufficiently high RT in a sequential batch reactor, while it was found to be inadequate for continues operation mode.
Combining chemical precipitation and biological filtration enable efficient integrated compact treatment that is characterized by small process footprint, reliability, flexibility, and of improved economics (Suman 2005, Alaton 2004, Rusten 1996 and Parker 1996). However, due to the availability of different treatment chemicals (coagulants and flocculants) and also the wide spectrum of filter media, the assessment and design procedures are rather complicated and may require limited or detailed experimental work. A fast-track approach (FTA) that reduces size of the choice matrix to a few systems will be highly useful for decision support purposes. The developed FTA is based on the extensive body of reported data on both chemical and biological filtration.
This article is concerned with the development and assessment of the proposed FTA for identification of a low cost CEPT-TF system based on the available technical and economic data on CEPT and TF media characteristics.
APPROACH AND METHODOLOGY
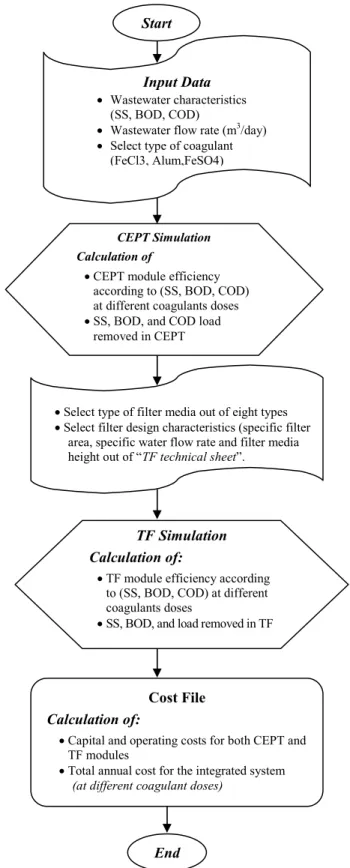
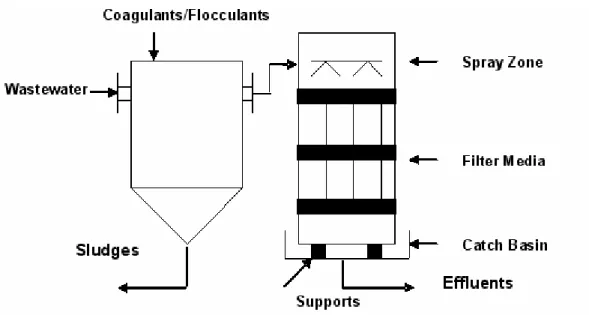
For the CEPT-TF system addressed in this work, as depicted in Fig. (1), various recommended coagulants are investigated. The coagulants selected; include Ferric Chloride (FC), Alum (A) and Ferrous Sulfate (FS). For trickling filter module several types of media have been selected including, stones, plastic, flocor, surfpac, PVC, slag & granite and glass.
Figure 1: Flow Diagram of the Proposed CEPT-TF System
CEPT/TF Modeling
a) CEPT Module
CEPT module performance has been investigated through the correlation of technical and experimental data pertinent to module efficiency. Generalized equation that correlates the % removal of SS, BOD and COD as a function of different coagulants at different doses have been formulated for: Industrial wastewater flows within the ranges of 10,000 to 50,000 m3 /day and BODin ranging between 300 to 800 ppm as follows:
R (i,j) = a (i,j)*(D)^3 - b (i,j)*
(D)^2 + c (i,j)*(D) + e (i,j)
(1)
where
R is the % removal
I is waste characteristics item no. (1- 2) J is coagulant no. (1-3)
a, b, c, e are equation constants D coagulant dose
The value of the previous coefficients illustrated in Equation (1) are highlighted in Table (1) that presents the specification of (i,j) matrix.
For a specific flow and retention time, the volume of the primary treatment basin is expressed by:
C
V = Q /24* Tc (2)
where
Q is the wastewater flow rate (m3/day). Tc is the residence time (hr).
VC is the required primary settling volume (m3).
Table 1: [i,j] Specification Matrix
Item Specification
i for i = 1 to 2 SS, BOD
j for j = 1 to 3 FeCl3, Alum, FeSO4
a (1,1), a (1,2), a (1,3) 2*10^-4, 7*10^-5, 2*10^-4 a (2,1), a (2,2), a (2,3) 3*10^-4, 2*10^-5, 2*10^-4
b (1,1), b (1,2), b (1,3) -38*10^-3, -117*10^- 4, -381*10^-5 b (2,1), b (2,2), b (2,3) -505*10^-4, -65*10^-4, -47*10^-3 c (1,1), c (1,2), c (1,3) 2.11, 0.77, 1.97
b) Trickling Filter Module
Rational algorithm has been proposed to estimate the fraction of BOD removed from wastewater. Then, TF performance is predicted according to various operating conditions. Further, the economic indicators are estimated in terms of BOD load removed.
The basic concept to correlate the BOD removal performance with operating conditions is (Velz (1948):
dC/dh = -KC (3)
where
C is BOD concentration K is Reaction rate constant h is media depth by integration:
0
C/C = exp (-Kh) (4)
where
C0 is BOD concentration in feed C is BOD concentration in effluent
As the BOD removal rate is a function of residence time (Howland 1958)
Then
0 v
C/C = exp (-K )θ (5) where
Ө is wastewater residence time.
The water residence time have been investigated under various filter operating conditions and experimentally correlated as follow:
e e
= f (q ,a ,h)
θ
Then
m1 m2 m3
e e
= q a h
θ V (6) where
ά is empirical constant
qe is volumetric flow rate per cross sectional area of filter bed (m3/m2 hr)
ae is specific surface area of filter bed (m2/m3) h is filter media height (m)
m1, m2, m3 are exponents that have been obtained empirically by many investigators according to various filter media (Hosono 1978, Metcalf 1991, Harrison 1987, Krumins 2000, Seguret 2000).
By substituting of equation (6) into (5)
Then
m1 m2 m3
0 v e e
C/C = exp (-K V q a h ) (7)
This equation is valid for the following assumptions:
Steady state BOD removal with first order kinetics
Constant microbial concentration
Constant temperature
Plug flow wastewater profile
The effective fraction of filter media ά is directly proportional to the operating conditions and consequently the term Kά (effective reaction rate constant) is directly proportional to hydraulic loading in the filter bed for specific media
Kά = ƒ(q, specific condition of filter media)
Then
m1 m2 m3
0 e e
C/C = exp (- qα a h ) (8) According to the published experimental data concerning the actual operation of trickling filter, the BOD removal efficiency is predicted for different trickling filter media as depicted in Table (2)
where
α is empirical constant.
Table 2: Trickling Filter Technical Sheet[a]
S Type of media ae
(m2m-3)
qe
(m3m-2hr-1)
h (m)
BOD removal efficiency equation
1 Whinstone 30-80 0.016-0.43 0.3-1.83 exp(-0.004qe-0.42aeh)
2 Plastic 88 0.1-1.9 0.31-2 exp(-(0.0025ln(qe)+0.0048)aeh/q)
3 Asbestos 82- 121 1.83-5 1.22-1.56 exp(-0.0028qe-0.49aeh/q)
4 Stone 30 -085 0.43-6.5 3-6 exp(2.69qe-0.45ae-0.7h/q)
5 Flocor,Surfpac 85 – 180 2.3-5 2-3.5 exp(-3.445qe0.5241ae-0.78h/q)
6 PVC 89 – 164 0.17-0.4 0.3-1.25 exp(-(4.9qe+1.57)ae-0.86h/q)
7 Slag, Granite 80 – 165 0.34-0.76 up to 1.8 exp(-(9.7.9qe+1.3)ae -1.1
h/q) 8 Fiber Glass Sheet 36 – 164 0.17-2.38 1.22-5.5 exp(-(10.1qe0.45ae-1.05h/q)
[a]Hosono 1978, Metcalf 1991, Harrison 1987, Wheatley 1976, Logan 2000, Pullen 1976, Gray 1983, Hemming 1978, Pullen 1976,Christoulas 1990, Krumins 2000, Seguret 2000
ae - is specific surface area of filter bed (m2/m3)
qe - is volumetric flow rate per cross sectional area of filter bed (m3/m2 hr)
Simulation
Simulation of CEPT/TF system has been developed according to the proposed technical models. The simulation approach has been conducted for various controlling indicators include: coagulant type& dose,
TF media type & characteristics, treatment capacity and organic load. According to the developed simulation model involving the technical aspects, a financial profile is estimated including capital cost, operating cost and the total annual cost. Block flow diagram of the developed approach has been depicted in Fig. (2).
Figure 2: Block flow Diagram of the Developed Approach
Start
Input Data • Wastewater characteristics (SS, BOD, COD)
• Wastewater flow rate (m3/day)
• Select type of coagulant (FeCl3, Alum,FeSO4)
CEPT Simulation
Calculation of
•CEPT module efficiency according to (SS, BOD, COD) at different coagulants doses
•SS, BOD, and COD load removed in CEPT
•Select type of filter media out of eight types
•Select filter design characteristics (specific filter area, specific water flow rate and filter media height out of “TF technical sheet”.
TF Simulation
Calculation of:
•TF module efficiency according to (SS, BOD, COD) at different coagulants doses
•SS, BOD, and load removed in TF
Cost File Calculation of:
•Capital and operating costs for both CEPT and TF modules
•Total annual cost for the integrated system
(at different coagulant doses)
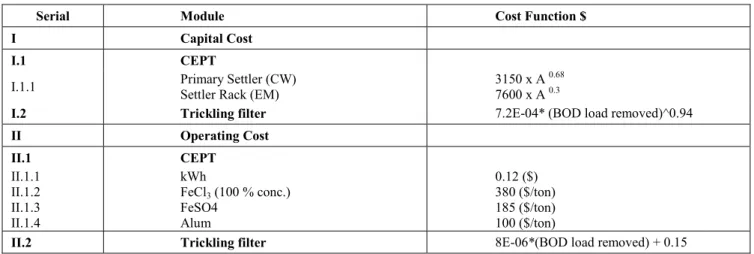
Investment and Operating Cost Estimation
Capital and operating cost estimates have been investigated according to cost functions that predict cost indicators as correlated with the
controlling technical parameters of each module. Also, the materials and chemicals cost are estimated according to the international prevailing prices. Adapted cost functions and data are presented in Table (3).
Table 3: Cost Functions of the Proposed System
Serial Module Cost Function $
I Capital Cost
I.1 CEPT
I.1.1 Primary Settler (CW) Settler Rack (EM) 3150 x A
0.68
7600 x A 0.3
I.2 Trickling filter 7.2E-04* (BOD load removed)^0.94
II Operating Cost
II.1 CEPT
II.1.1 II.1.2 II.1.3 II.1.4
kWh
FeCl3 (100 % conc.)
FeSO4 Alum
0.12 ($) 380 ($/ton) 185 ($/ton) 100 ($/ton)
II.2 Trickling filter 8E-06*(BOD load removed) + 0.15
Where: A - is the area of module (m2); V - is the volume of module (m3); CW - is civil work; EM - is electromechanical parts;
BOD - load: kg/day
RESULTS AND DISCUSSIONS
Simulation results for the adopted CEPT-TF approach are presented, analyzed and discussed as applied to typical textile wastewater characteristics.
Simulation and Cost Estimation
Technical and economic analysis has been conducted to identify the profiles for various design and operating parameters as outlined below.
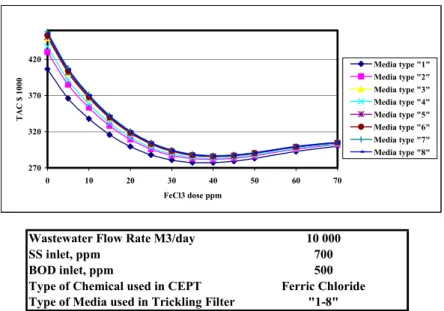
a) Simulation for TF-Media:
For selected coagulant, capacity and waste characteristics: total annual cost has been estimated for different filter media at different FeCl3 doses as depicted in Fig. (3).The highest TAC is detected at zero coagulant and decrease till reaching min. The optimum coagulant dose is recorded at about 40 ppm FeCl3 for all type of TF media. Whinstone (filter media 1) has addressed the min TAC at different
doses. Wide difference, about 150,000 US$, is estimated between the module with the highest TAC (CEPT-TF Slag media) and the lowest TAC (CEPT-TF whinstone media), at no or relatively low coagulant dose, while reaching about 33,000 US$ at the optimum dose. Further, slight differences may be traced at coagulant doses exceeding the optimum dose.
b) Coagulant Type
270 320 370 420
0 10 20 30 40 50 60 70
FeCl3 dose ppm
TA
C
$ 1
000
Media type "1" Media type "2" Media type "3" Media type "4" Media type "5" Media type "6" Media type "7" Media type "8"
Wastewater Flow Rate M3/day 10 000
SS inlet, ppm 700
BOD inlet, ppm 500
Type of Chemical used in CEPT Ferric Chloride
Type of Media used in Trickling Filter "1-8"
Figure 3: Change of Total Annual Cost of CEPT-TF System with Varying FeCl3 Dose at Various TF Media for 10 000 m3/day
Unit Capacity m3/day 30 000
SS inlet, ppm 700
BOD inlet, ppm 500
Type of Coagulant used in CEPT FeCl3,Ferrous sulfate,Alum Type of Media used in Trickling Filter "1-8"
400 500 600 700 800 900 1000
0 20 40 60
FeCl3 dose ppm
T.
A
nnua
l C
o
st
$
1
0
0
0
0 20 40 60
Ferrous sulfate dose ppm
0 20 40 60
Alum dose ppm
Media type "1" Media type "2" Media type "3" Media type "4" Media type "5" Media type "6" Media type "7" Media type "8"
.
Figure 4: Change of Total Annual Cost of CEPT-TF System with Varying Coagulant Dose at Various TF Media for 30 000 m3/day
Fig. (5) represents the lowest and the highest TAC curves, according to different coagulants, estimated for whinstone and granite filter media respectively. It indicates that for granite or slag media, the optimum coagulant doses are 40 ppm and 35 ppm with TAC of about (520,000 and 513,000) US$ for ferric chloride and ferrous sulfate coagulants respectively. Although, ferrous sulfate indicates lower TAC for all media types, FeCl3 has superior performance than others. At the optimum dose, the effluent BOD was 40, 50 and 95 ppm for FeCl3, FeSO4 and alum respectively. Moreover, ferrous sulfate produces greater amount of sludge that will affect the sludge treatment cost which has not been
accounted for within the scope of this work.
c) Capacity Change
400 550 700 850 1000
0 10 20 30 40 50 60 70 Chemical dose (ppm)
T
A
C
( $
10
00
) FeCl3&Media
type "1"
FeSO4&Media type "1"
Alum&Media type "1"
400 550 700 850 1000
0 10 20 30 40 50 60 70 Chemical dose (ppm)
TA
C
( $
10
00
) FeCl3&Media type"7"
FeSO4&Media type "7"
Alum&Media type "7"
Unit Capacity 30 000
SS inlet, ppm 700
BOD inlet, ppm 500
Type of Coagulant used in CEPT FeCl3,Ferrous sulfate,Alum Type of Media used in Trickling Filter " 1 , 7 "
Figure 5: Change of Total Annual Cost of CEPT-TF System with Different Varying Coagulant Type and Dose for Selected TF Media
550 700 850 1000 1150 1300 1450 1600
0 10 20 30 40 50 60 70
FeCl3 dose ppm
T.
A
n
n
u
a
l C
o
st
$ 10
00
0 10 20 30 40 50 60 70
FeCl3 dose ppm
Media type "1"
Media type "2"
Media type "3"
Media type "4"
Media type "5"
Media type "6"
Media type "7"
Media type "8"
Unit Capacity 30 000 and 50 000
SS inlet, ppm 700
BOD inlet, ppm 500
Type of Coagulant used in CEPT Ferric Chloride
Type of Media used in Trickling Filter " 1-8 "
Figure 6: Change of Total Annual Cost of CEPT-TF System with Varying FeCl3 dose at Various Capacity
d) Waste Characteristics:
TAC is relatively sensitive to change in waste load at small coagulant and tends to decrease for higher coagulant dose. It is observed that the optimum dose has been moved from 30 to 47 ppm FeCl3 when BOD influent increases from 300 to 800 ppm respectively as presented in Fig. (7). The TAC increases by 600,000 US$ and 120,000 US$ at zero and optimal coagulant dose respectively. The total operating cost and the TF annualized cost have increased by about 65,000 US$.
Table (4) presents the optimum value of ferric chloride dose and the corresponding TAC at different BOD feed load.
e) Filter Characteristics:
y
0 200 400 600 800 1000 1200 1400
0 10 20 30 40 50 60 70
FeCl3 dose ppm
TA
C $
10
00
BODin 300 ppm BODin 400 ppm BODin 500 ppm BODin 600 ppm BODin 700 ppm BODin 800 ppm
Wastewater Flow Rate M3/day 30000
SS inlet, ppm 400-1100
BOD inlet, ppm 300-800
Type of Chemical used in CEPT Ferric Chloride
Type of Media used in Trickling Filter "1"
Figure 7: Change of TAC with Different FeCl3 Dose for CEPT-TF System for Different Waste Characteristics
Table 4: Optimum Ferric Chloride Dose and the Corresponding TAC at Different BOD Load
BOD Load ppm
Optimum FeCl3 Dose ppm
TAC US $ 1000
300 30 436 400 35 466 500 37 493 600 40 516 700 42 538 800 45 556
450 550 650 750 850 950 1050
0 10 20 30 40 50 60 70 80
FeCl3 dose( ppm)
T
A
C
(
$
1000
)
a= 85 , q=0.17 , h=1.25
a= 100 , q=0.2 , h=1
a=120 , q=0.3 , h=0.75
a= 160 , q=0.4 , h=0.3
Wastewater Flow Rate M3/day 30000
SS inlet, ppm 700
BOD inlet, ppm 500
Type of Chemical used in CEPT Ferric Chloride
Type of Media used in Trickling Filter "6"
Sensitivity Analysis
a) Capacity Definition
The amount of BOD removed per kg coagulant at and around the optimum coagulant dose for different CEPT-TF modules using different coagulant types have been investigated as depicted in Table (5). The most efficient coagulant has been found to be FeCl3 that shows greater amount of BOD removal ranging between 14-16.5 kg BOD/kg coagulant added for different CEPT-TF modules at the optimum FeCl3 doses.
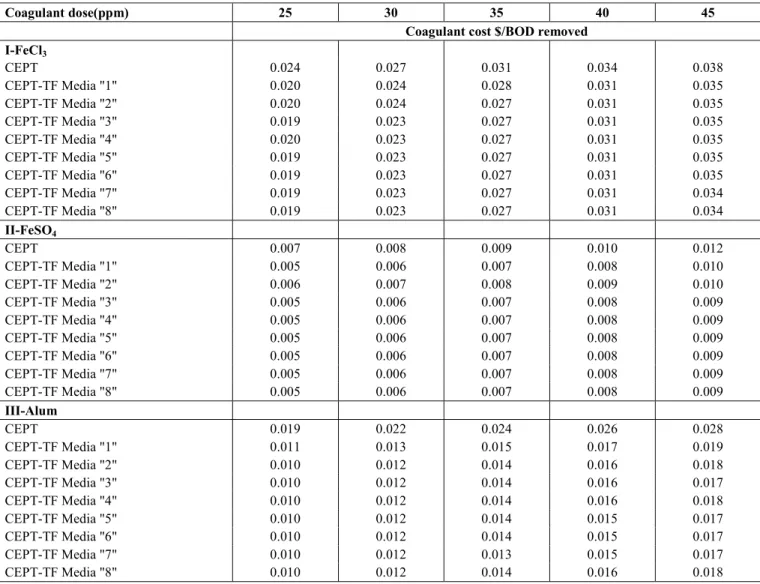
b) Cost Definition
Table (6) presents the coagulant cost in $ /kg BOD removed at and around the optimum dose for
different CEPT-TF modules using different coagulant types. According to coagulant cost, FeSO4 has the lowest annual cost per kg BOD removed that ranges between 0.008-.006 $/kg BOD at optimum coagulant dose for different integrated CEPT-TF modules.
c) Coagulants Performance Profile
Coagulant performance has been presented as % BOD removed distribution with coagulant% of the maximum dose as shown in Fig. (9). About 87% of the BOD load have been removed using about 12.5% of the coagulant% of max dose and more than 95% removal of BOD have been achieved using 50% of coagulant max dose.
Table 5: Capacity Definition
45 40
35 30
25 Coagulant dose (ppm)
Kg BOD removed /Kg coagulant I-FeCl3 10.0 11.0 12.3 13.8 15.7 CEPT 10.8 12.1 13.8 15.9 18.9 CEPT-TF Media "1"
10.9 12.2
13.9 16.2
19.3 CEPT-TF Media "2"
11.0 12.3
14.1 16.4
19.5 CEPT-TF Media "3"
11.0 12.3
14.0 16.2
19.4 CEPT-TF Media "4"
11.0 12.4
14.1 16.2
19.6 CEPT-TF Media "5"
11.0 12.4
14.1 16.4
19.6 CEPT-TF Media "6"
11.0 12.4
14.1 16.5
19.7 CEPT-TF Media "7"
11.0 12.4
14.1 16.4
19.6 CEPT-TF Media "8"
II-FeSO4 8.6 9.7 11.1 12.7 14.6 CEPT 10.5 11.8 13.5 15.6 18.6 CEPT-TF Media "1"
9.5 11.0
12.7 15.0
18.1 CEPT-TF Media "2"
10.8 12.2
13.9 16.2
19.4 CEPT-TF Media "3"
10.7 12.1
13.8 16.1
19.2 CEPT-TF Media "4"
10.9 12.2
14.0 16.3
19.5 CEPT-TF Media "5"
10.9 12.2
14.0 16.3
19.5 CEPT-TF Media "6"
10.9 12.3
14.0 16.4
19.6 CEPT-TF Media "7"
10.6 12.0
13.7 15.9
19.0 CEPT-TF Media "8"
III-Alum 6.5 7.1 7.7 8.6 9.7 CEPT 9.9 11.1 12.6 14.6 17.3 CEPT-TF Media "1"
10.3 11.6
13.1 15.3
18.2 CEPT-TF Media "2"
10.6 11.9
13.6 15.8
18.9 CEPT-TF Media "3"
10.4 11.7
13.3 15.5
18.5 CEPT-TF Media "4"
10.7 12.0
13.6 15.9
19.0 CEPT-TF Media "5"
10.7 12.0
13.7 15.9
19.1 CEPT-TF Media "6"
10.8 12.1
13.8 16.1
19.2 CEPT-TF Media "7"
10.2 11.5
13.0 15.1
Table 6: Cost Definition 45 40 35 30 25 Coagulant dose(ppm)
Coagulant cost $/BOD removed I-FeCl3 0.038 0.034 0.031 0.027 0.024 CEPT 0.035 0.031 0.028 0.024 0.020 CEPT-TF Media "1"
0.035 0.031
0.027 0.024
0.020 CEPT-TF Media "2"
0.035 0.031
0.027 0.023
0.019 CEPT-TF Media "3"
0.035 0.031
0.027 0.023
0.020 CEPT-TF Media "4"
0.035 0.031
0.027 0.023
0.019 CEPT-TF Media "5"
0.035 0.031
0.027 0.023
0.019 CEPT-TF Media "6"
0.034 0.031
0.027 0.023
0.019 CEPT-TF Media "7"
0.034 0.031
0.027 0.023
0.019 CEPT-TF Media "8"
II-FeSO4 0.012 0.010 0.009 0.008 0.007 CEPT 0.010 0.008 0.007 0.006 0.005 CEPT-TF Media "1"
0.010 0.009
0.008 0.007
0.006 CEPT-TF Media "2"
0.009 0.008
0.007 0.006
0.005 CEPT-TF Media "3"
0.009 0.008
0.007 0.006
0.005 CEPT-TF Media "4"
0.009 0.008
0.007 0.006
0.005 CEPT-TF Media "5"
0.009 0.008
0.007 0.006
0.005 CEPT-TF Media "6"
0.009 0.008
0.007 0.006
0.005 CEPT-TF Media "7"
0.009 0.008
0.007 0.006
0.005 CEPT-TF Media "8"
III-Alum 0.028 0.026 0.024 0.022 0.019 CEPT 0.019 0.017 0.015 0.013 0.011 CEPT-TF Media "1"
0.018 0.016
0.014 0.012
0.010 CEPT-TF Media "2"
0.017 0.016
0.014 0.012
0.010 CEPT-TF Media "3"
0.018 0.016
0.014 0.012
0.010 CEPT-TF Media "4"
0.017 0.015
0.014 0.012
0.010 CEPT-TF Media "5"
0.017 0.015
0.014 0.012
0.010 CEPT-TF Media "6"
0.017 0.015
0.013 0.012
0.010 CEPT-TF Media "7"
0.018 0.016
0.014 0.012
0.010 CEPT-TF Media "8"
80 85 90 95 100
12.5 25 37.5 50 62.5 75 87.5 100
coagualnt % of optimum
% of BO D rem o v ed
Wastewater Flow Rate M3/day 30000
SS inlet, ppm 700
BOD inlet, ppm 500
Type of Chemical used in CEPT Ferric Chloride
Type of Media used in Trickling Filter "1"
CONCLUSIONS
Technical and economic assessment of CEPT-TF system in industrial wastewater treatment has been evaluated. A simulation approach has been developed for the proposed system through theoretical considerations& empirical assumption based on experimental data obtained from pilot and full scale published data. A complete financial profile has been adopted involving capital, operating and total cost for the selected modules and integrated system. An integrated fast track approach for prioritirising the total annual treatment cost for different CEPT-TF options under a giving set of technical constrains has been developed.
The results indicate that, major part of BOD load is removed within the CEPT module. More than 85 % of BOD removed by the overall system is carried out in CEPT module with coagulant dose up to 12.5 % of the optimum dose (40 ppm). Moreover The percentage of CEPT module of TAC represents about 38, 28, 19 % on using: ferric chloride, ferrous sulfate and alum respectively at 40 ppm dose, 10,000 m3/day capacity and 500 ppm BOD load.
The optimum coagulant dose ranges between 30-45 ppm (for iron salt) depending on coagulant type, waste load and unit capacity (according to the investigated constrains). The correlation between alum dose and TAC has been proposed to be linear. Minimum TAC has been changed according to the giving technical considerations. In most cases, CEPT-whinstone trickling filter system has proved to be the lowest TAC system, with min technical performance, while CEPT-PVC trickling filter system has proved to be the greatest TAC with optimum performance.
It is noticed that, the TAC for the proposed integrated system is relatively sensitive to change in waste load at zero coagulants and the sensitivity is relatively less for higher coagulants dose. Increase in unit capacity affect the optimum coagulant dose location and change the relative order of TAC- curves of the proposed integrated CEPT-TF system irrespective of coagulant type.
NOMENCLATURE
A Alum
a, b, c, d equations constants according to various filter media
ae Specific surface area of filter bed (m2/m3)
BOD Biological Oxygen Demand
C Conc. of the removable BOD in effluent C0 Conc. of the removable BOD in feed CEPT Chemically Enhanced Primary
Treatment
COD Chemical Oxygen Demand
D coagulant dose
FC Ferric Chloride
FM Filter Media
FM(n) Filter Media of n where n = 1 to 8
FS Ferrous Sulfate
H filter media height (m)
I waste characteristics item no. (1- 2) J Coagulant no. (1-3)
K,Kv Reaction rate constant (time-1) PVC Poly Vinyl Chloride
Q Wastewater flow rate (m3/day)
qe Volumetric flow rate per cross sectional area of filter bed (m3/m2 hr)
R Percentage Removal
SS Suspended Solid
TAC Total Annual Cost
Tc Residence time (hr)
TF Trickling Filter
TSS Total Suspended Solid
VC Required primary settling volume (m3)
α, ά Empirical constants
REFERENCES
Metcalf and Eddy, Inc., Wastewater Engineering, Treatment, Disposal and Reuse, McGraw Hill Companies. New York (1991).
Water Environment Federation (WEF), Operation of Municipal Wastewater Treatment Plants, Manual of Practice No. 11, 5th ed. Vol. 2, WEF. Alexandria, Virginia (1996).
Velz, C.J., A Basic Law for the Performance of Biological Filter, Sewage Works Journal, Vol.20, pp 607-617(1948).
Robinson, T. et al, Remediation of Dyes in Textile Effluent: a Critical Review on Current Treatment Technologies with a Proposed Alternative, Bioresearch Technology, Vol. 77, pp 247-255 (2001).
Seguret, F. et al, Hydrodynamic Behavior of Full Scale Trickling Filters, Wat Res. Vol. 34, No 5, pp1551-1558 (2000).
Michalakos, G. D. et al, Removal of Iron from Potable Water Using a Trickling Filter, Wat.Res.Vol.31, No 5, pp 991-996 (1997).
Vayenas, D. V. and Lyberatos, G., On the Design of Nitrifying Trickling Filters for Potable Water Treatment, Wat.Res.Vol.29, No 5, pp1079-1084 (1995).
Guzinis, A.et al, Removal of Mn and Simultaneous Removal of NH3, Fe and Mn from Potable Water Using a Trickling Filter, Wat. Res. Vol. 32, No 8, pp 2442-2450 (1998).
Randall, A.A. et al, Industrial Pretreatment: Trickling Filter Performance and Design, Journal of Environmental Engineering, November, pp 1072-1079 (1997).
Krumins, V. et al, Fluid Velocity Distribution Nitrifying Trickling Filter: Mathematical Model and NMR Calibration, Wat. Res. Vol. 34, No 8, pp 2337-2345 (2000).
Willem, R., Chemical Treatment of Sewage, First Annual Convention of the Sewage Works Federation, Chicago, pp1051-1061 (1940).
Gordon, L., Chemical Treatment of Raw Sewage, Water and Wastes Engineering, July, No7, pp.61-63 (1967).
Irene, W. Y., Bench-Scale Study of Chemically Enhanced Primary Treatment in Brazil, Master Thesis for Engineering in Civil and Environmental Engineering, Faculty of Engineering, Brazil (2000).
United States Environmental Protection Agency, Office of Water Washington, D.C., Wastewater Technology Fact Sheet Trickling Filter Nitrification, EPA 832- F-00-015 (2000).
Mann, A.T. and Stephenson, T., Modeling Biological Aerated Filters for Wastewater Treatment, Wat. Res. Vol.31, No 10, pp 2443-2448 (1997).
Harrison, J. R. and Daigger, G. T.,” A Comparison of Trickling Filter Media, J. Wat. Pollut. Control Fed. Vol. 59, pp 679-685 (1987).
Stadterman, K. L. et al, Removal and Inactivation of Cryptosporidium oocysts by Activated Sludge Treatment and Anaerobic Digestion,Water Science and Technology Vol.31, Issues 5-6, pp 97-104 (1995).
Parker, D. et al, Design and Operations Experience with Flocculator-Clarifiers in Large Plants,Water Science and Technology, Vol. 33, Issue12, pp163-170 (1996).
Oeller, H.J. et al, Reduction in Residual COD in Biologically Treated Paper Mill Effluents by Means of Combined Ozone and Ozone/UV Reactor Stages, Water Science and Technology Vol. 35, Issues 2-3, pp 269-276 (1997).
Pedersen, A. R. and Arvin, E., Toluene Removal in a Biofilm Reactor for Waste Gas Treatment, Water Science and Technology, Vol. 36, Issue1 pp.69-76 (1997).
Rusten, B., Siljudalen J. G. and Strand H., Upgrading of a Biological-Chemical Treatment Plant for Cheese Factory Wastewater, Water Science and Technology, Vol. 34, Issue 11, pp 41-49 (1996).
De Clercq, B., Coen, F., Vanderhaegen B. and Vanrolleghem P. A., Calibrating Simple Models for Mixing and Flow Propagation in Waste Water Treatment Plants, Water Science and Technology, Vol. 39, Issue 4, pp 61-69 (1999).
Vayenas, D. V., Pavlou, S. and Lyberatos, G., Development of a Dynamic Model Describing Nitritification and Nitratification in Trickling Filters, Wat. Res., Vol. 31, Issue 5, pp 1135-1147 (1997).
Suman, D. S. and Anjaneyulu, Y., Evaluation of Biokinetic Parameters for Pharmaceutical Wastewaters Using Aerobic Oxidation Integrated With Chemical Treatment, Process Biochemistry, Vol. 40, Issue 1, pp 165-175 (2005).
Alaton, I. A., et al, Combined Chemical and Biological Oxidation of Penicillin Formulation Effluent, Journal of Environmental Management, Vol. 73, Issue 2, pp155-163 (2004).
Wheatley, A.D. and Williams, I.L., Pilot Scale Investigation Into the Use of Random Pack Plastics Filter Media in the Complete Treatment of Sewage, Water Pollution Control, Vol. 75, Issue 4, pp 468-486 (1976).
Pullen, K.G., Trials On the Operation of Biological Filters, Water Pollution Control, Vol.76, Issue 1, pp 75-85 (1976).
Gray, N.F. and Learner, M.A., A Pilot –Scale Percolating Filter for Use in Sewage Treatment Studies”, Wat. Res., Vol. 17, No 3, pp 249-253 (1983).
Hemming, M.L. and Wheatley, A.D., Low-rate Biofiltration Systems Using Random Plastic Media, Water Pollution Control, Vol. 78, Issue 4, pp 45-68 (1978).
Christoulas, D.G. et al, Performance Relationship for Low and Intermediate Rate Biological Filters, Wat. Res., Vol. 24, No 5, pp 607-614 (1990). Krumins, V. M. et al, Fluid Velocity Distribution in
Nitrifying Trickling Filters: Mathematical Model and NMR Calibration, Wat. Res., Vol. 34, Issue 8, pp 2337-2345 (2000).
Nenov, V., TSS/BOD Removal Efficiency and Cost Comparison of Chemical and Biological Wastewater Treatment, Water Science and Technology, Vol. 32, No 4, pp 207-214 (1995). Nandy, T., et al, Optimization of Coagulants for
Pretreatment of Printing Ink Wastewater, Environmental Engineering Science, Vol. 19, No 1, pp 1-7, (2002).
Howland, W. E., Flow over Porous Media as in a Trickling Filter, Proc. 12th Ind. Waste Conf. Purdue Univ., pp 435-465 (1958).
Miao, J., et al, Restaurant Emission Removal by Biofilter with Immobilized Bacteria, Zhejiang Univ SCI 6B(5), pp 433-437(2004).
Koh, L.H, et al, Pre-Treatment of Volatile Organic Compounds Up-Stream of Biological Gas Cleaning Operation, Journal of Chemical
Technology and Biotechnology, Vol.79, pp 619-625 (2004).
Lu, Z.J. et al, Biofiltration of Concentration Mixtures of Hydrogen Sulfide and Methanol, Environmental Progress, Vol. 22, No. 2, pp 129-136 (2003).
Neal, A.B., et al, Use of Biofilters and Suspended-Growth reactors to Treat VOCs, Waste Management, Vol. 20, pp 59-68 (2000).
Wang, Z.H., et al, Study on the Effects of Cooking Oil Fume Condensate on the DNA Integrality”, Journal of Hygiene Research, Vol. 31,No 4, pp 238-240 (2002).
![Table 2: Trickling Filter Technical Sheet [a]](https://thumb-eu.123doks.com/thumbv2/123dok_br/18894364.425934/4.892.69.823.909.1071/table-trickling-filter-technical-sheet-a.webp)