ISSN 0104-6632 Printed in Brazil
www.abeq.org.br/bjche
Vol. 22, No. 02, pp. 181 - 194, April - June, 2005
Brazilian Journal
of Chemical
Engineering
FLUIDIZED BED SPRAY GRANULATION:
ANALYSIS OF HEAT AND MASS TRANSFERS
AND DYNAMIC PARTICLE POPULATIONS
S. Heinrich
*, M. Henneberg, M. Peglow, J. Drechsler and L. Mörl
Otto-von-Guericke-University, Universitätsplatz 2, 39106 Magdeburg, Germany, Institute of Process Equipment and Environmental Technology.
E-mail: [email protected]
(Received: October 20, 2004 ; Accepted: November 20, 2004)
Abstract - A model was developed taking into consideration the heat and mass transfer processes in liquid-sprayed fluidized beds. Such fluidized beds (FB) are used for granulation, coating and agglomeration. Conclusions are drawn on the relevance of particle dispersion, spraying and drying to temperature and concentrations distributions. In extension, the model was coupled with a population balance model to describe the particle size distribution and the seeds formation for continuous external FBSG (fluidized bed spray granulation) with non-classifying product discharge and a screening and milling unit in the seeds recycle. The effects of seeds formation on the stability of the process is discussed.
Keywords: Fluidized bed; Granulation; Population balance.
INTRODUCTION
The FBSG is a process used for the production of granular high-quality, free-flowing, low-dust and low-attrition solids originating from liquid products, e. g. solutions, suspensions, melts and emulsions. The advantage is the coupling of the wetting, drying, particle enlarging, shaping, homogenisation and separation processes and the the production in a single processing step (Uhlemann and Mörl, 1999). Especially for large production units a continuous operation of the FBSG is desirable. The continuous granulation process presents, unlike to the batch-operation, the advantage to operate the plant under stationary condition at high throughputs. The stationary operation point is reached, provided constant granulate spectrum beside constant mass flows and constant thermal conditions, whereby initially fed granulates have to be removed at all.
Sometimes this unsteady phase lasting up to a few hours.
MODELLING OF THE HEAT AND MASS TRANSFER
The heat and mass transfer is modelled as continuum, using a balance of the mass and the energy of the air, of the particles and of the liquid in the fluidized bed. A set of coupled partial differential equations for the time-dependent temperatures of particles and of liquid film, for the time and height dependent air humidity and air temperature as well as for the time-dependent wetting efficiency of the particles results with the following assumptions:
Assumptions
§ Ideal plug-flow of the fluidization gas (PFTR model).
§ Solid mixing is described by axial and radial dispersion coefficients (Kawase and Moo-Young, 1987).
§ The fluidization of the fluidized bed is homogeneous, i.e. the porosity of the bed is constant.
§ The liquid on the particles forms a coherent film of constant thickness ∆f, which is independent of the particle diameter.
§ Only the first period of drying is observed, i.e. the solid particles are non-hygroscopic and absorb no moisture.
§ The wetting efficiency ϕ characterizes the ratio of wetted particle surface to total particle surface:
P,wetted L
P,wetted P,unwetted L,max
A
A
A
ρ
ϕ =
=
+
ρ
(1)§ An adiabatic saturation of air with steam in the fluidized bed may be assumed. The water mass flow m&L,Ev that evaporates at the interface between humid air and water depends on the present steam pressure pSt and on the saturated steam pressure pSt,∞:
St St
L,Ev P
St, A
P A A P A
pM
p p
m
A
ln
RT
p p
pM
A
(Y
Y )
A (Y
Y )
RT
∞
∞ ∞
−
= β
≈
−
≈ β
−
= βρ
−
&
(2)
§ The wetted surface, related to the volume element, is A (1*P − ε ϕ) , and so
*
LV,Ev A P A
m& = βρ A (1− ε ϕ) (Y∞ −Y ) which holds for the evaporated mass flow per volume unit (with β* = βρΑ).
§ The heat flows between air and dry particle and between air and liquid film as well as between particle and liquid film are analogeous (αAP =
αAF = αPF = α) and calculated after Gnielinski (1980).
Balancing of the Components
(a) Mass Balance of the Air
The water loading of the air increases due to the evaporation flow of the liquid film on the particles into the air as a function of the mass transfer
(
)
(
)
* *
L
A A A A A
*
A P A
(dm )
m Y dA m Y dY dA
t
A (1 ) Y∞ Y dV
∂ = − + +
∂
+βρ − ε ϕ −
& &
(3)
The water loading
dm
&
L in the volume element dV can be expressed using the dry air mass, the air humidity YA and the air densityρ
A asL A A A A
dm
=
Y dm
= ρ
Y
dV
(4)Using Eq. (4) in Eq. (3) results to
(
)
*
A A
A A
*
A P A
( Y dV)
m dY dA t
A (1 ) Y∞ Y dV
∂ ρ = − + ∂
+βϑ − ε ϕ −
&
(5)
The air density
ρ
A anddV
are independent on time. WithdV
=
dAdz
follows the time and height-dependent air humidity(
)
* A A A * AA P A
Y m
z
Y 1
t A (1 ) Y Y
∞ ∂ − + ∂ ∂ =
∂ ρ +βρ − ε ϕ −
&
(6)
(b) Energy Balance of the Air
(
)
(
)
(
)
(
)(
) (
)
* *
A
A A St A A A St A V,0 A
*
LV,Ev St A V,0 P P A A
(dH )
m c c Y d dA m c h dY dA
t
m c h dV A (1 ) 1 ∞ dV .
∂ = − + ϑ − ϑ + ∆
∂
+ ϑ + ∆ + α − ε − ϕ ϑ − ϑ + ϕ ϑ − ϑ
& &
&
(7)
From the mass mass balance of the air results
*
A A
LV,Ev A A
Y Y
m m
t z
∂ ∂ = ρ +
∂ ∂
& & (8)
The enthalpy of the air in the volume element
(
)
A A A A A St A V,0
dH = ρ c ϑ +Y c ϑ + ∆h dV (9)
depends on the time, since air humidity and air temperature are time-dependent.
The dry air mass is constant, since a change of the density as a result of an increase or decrease of the temperature is equalized by a higher outflow or inflow of dry air. If the temporal change of the air enthalpy is broken down into the differential quotients of the time dependent quantities,
(
)
(
)
A A
A A St A
A
A St A V,0
(dH )
c c Y dV
t t
Y
c h dV
t
∂ = ρ + ∂ϑ +
∂ ∂
∂
+ρ ϑ + ∆
∂
(10)
the time and height-dependent air temperature results:
(
)
(
)(
) (
)
* *
A A A P
A A A St A
P A A
m A (1 )
t z c c Y
1 ∞
∂ϑ = − ∂ϑ + α − ε ∂ ρ ∂ ρ + − ϕ ϑ − ϑ + ϕ ϑ − ϑ
&
(11)
(c) Mass Balance of the Liquid
Assuming the particles are 100 % wetted, the maximum liquid concentration per volume element is calculable with the effective particle surface
* P
A (1− ε), the liquid film thickness ∆f and the density of the liquid with ρ = ρL W:
L,max *
L,max P L
bed
m
A (1 ) f V
ρ = = − ε ∆ ρ (12)
The actual liquid mass per volume element results by multiplication with the wetting efficiency
L L,max
ρ = ϕρ (13)
The liquid loading of a volume element depends on the spatial mixing (dispersion) of the solid, on the evaporation flow and on the injected water flow per volume element
(
)
2
L L L
Z 2 R
2 2
L L
R 2 2 2
*
P A LV
1
D D
t z r r
1
D D
r r
A (1 ) Y Y m
φ
∞
∂ρ = ∂ ρ + ∂ρ +
∂ ∂ ∂
∂ ρ ∂ ρ
+ + +
∂ ∂φ
+β − ε ϕ − + &
(14)
With the assumption of the horizontal and vertical particle dispersion the differential equation for the wetting efficiency is obtained:
(
)
2 2
Z 2 R R 2
* LV P A L,max L,max 1
D D D
t z r r r
m A (1 )
Y∞ Y
∂ϕ= ∂ ϕ+ ∂ϕ+ ∂ ϕ+
∂ ∂ ∂ ∂
β − ε
+ ϕ − +
ρ ρ
&
(15)
(d) Energy Balance of the Liquid
Heat is transported on the interfaces air–liquid film and particle–liquid film and described by the volume-based heat flows
*
V,AL P AL A
q& =A (1− ε ϕα) (ϑ − ϑ∞) (16)
*
V,PL P PL P
q& =A (1− ε ϕα) (ϑ − ϑ∞) (17)
A correction factor is introduced, which specifies the ratio of the heat transfer coefficients between particle–liquid film and fluidized bed
PL
fα = α α (18) The evaporated liquid flow at the interface transports the enthalpy flow
* *
P A St A V,0
A (1 ) (Y Y )(c∞ h )
β − ε ϕ − ϑ + ∆ .
(
)
(
)
(
)
(
)
2 2
*
L L L L
Z 2 R R 2 P A P
* *
P A V,0 St A L LV L,in
h h 1 h h
D D D A (1 ) f
t z r r r
A (1 ) Y Y h c c m
∞ α ∞
∞
∂ = ∂ + ∂ + ∂ + α − ε ϕ ϑ − ϑ + ϕ ϑ − ϑ
∂ ∂ ∂ ∂
+β − ε ϕ − ∆ + ϑ + & ϑ
(19)
which is with hL = ϕρL,maxcLϑ∞ proportional to the liquid film temperature
(
)
(
)
(
)
(
) (
)
(
)
(
)
2 2 *
L P
Z 2 R R 2 A P
L L,max
* *
LV P
A V,0 St A L,in
L L,max L,max
A (1 )
1 1
D D D
t t z r r r c
m A (1 )
Y Y h c .
c t
∞ ∞ ∞
∞
∞ ∞
∞ ∞
∂ ϕϑ ∂ ϕϑ ∂ ϕϑ
∂ϑ =∂ϑ = + + +α − ε ϑ − ϑ + ϑ − ϑ
∂ ∂ ϕ ∂ ∂ ∂ ρ
β − ε ∂ϕ
+ − ∆ + ϑ + ϑ − ϑ
ρ ϕρ ∂
&
(20)
(e) Energy Balance of the Solid
The temporal change of the enthalpy of the solid
P P
S S
h c
t t
∂ = ρ ∂ϑ
∂ ∂ (21)
is determined by the particle dispersion and the heat transfers particle–air and particle–film. With the assumption of the homogeneous fluidization, ρS = (1-ε)ρP is local and time-independent and can be formulated before the differentials to calculate the particle temperature
(
)(
) (
)
2
P P P
Z 2 R
2 *
P P
R 2
S S
A P P
1
D D
t z r r
A (1 ) D
c r
1 ∞
∂ϑ = ∂ ϑ + ∂ϑ +
∂ ∂ ∂
∂ ϑ α − ε + +
ρ ∂
− ϕ ϑ − ϑ − ϕ ϑ − ϑ
(22)
Modelling of the Liquid Separation
The temperature and humidity distribution in the FB is determined by the spatial distribution of the sprayed liquid and the liquid evaporation. The spraying area is limited by the spraying angle and the penetration depth of the nozzle. The spraying angle depends on the nozzle being used, while the penetration depth is determined by the intensity of the liquid drop deposition on the particles. The intensity of the drop deposition is described by a degree of net deposition (Heinrich and Mörl, 1999; Heinrich et al., 2003b).
POPULATION BALANCE MODELLING
Fluidized bed spray granulation is a size enlargement process. For the granulation a technique called layering is used, that adds small fractions of solids at the time to the surface of a particle called seed. In fluidized bed spray granulation the solids added are in liquid state as they are sprayed into the granulation chamber. If a droplet of this liquid hits a particle of the fluidized bed material before it returns into solid state, it spreads on the surface of the particle and returns into solid state here (e.g. by evaporation of the solvent), leaving a new thin shell of solid material. Because of the stochastic nature of the particle movement, it can be assumed that, statistically speaking, every given fraction of the cumulative surface of the bed material receives the fraction of the liquid sprayed in, that correlates with it’s percentage. Counteracting the granulation, the process of attrition is constantly reducing the size of the particles, by abrading small fractions of solids from the surface of the particles.
growth rate, i.e. the change of diameter over time, is equal for all the particles. Additional assumptions are:
Assumptions
§ Ideal plug flow of the fluidization gas (PFTR model),
§ Total backmixing of the particles (CSTR model), § the fluidization of the fluidized bed is
homogeneous, i.e. the porosity of the bed is constant,
§ the liquid load of the fluidizing material is independent of the location (uniform distribution), § all particles are spheres,
§ Hold-up material and the sprayed solid with the suspension have same densities,
§ agglomeration and breakage processes are not considered,
§ residence time of the discharged, elutriated and re-fed particle streams is negligibly small.
Balancing
Processes changing the state are modeled in terms of a particle population balance (PB), based on the work of (Randolf and Larson,1988), that was simplified for the purpose of pure granulation, as earlier published (Heinrich et al., 2002 and 2003a), leading to Eq. 1:
(
P,tot 0)
(
P,tot 0)
in in out outP 0 P 0
P
N q N q G
N q N q
t d
∂ ∂
= − + −
∂ ∂ & & (23)
The original model, though, does not take into account that in real life pure granulation is quite rare. A nearly unavoidable stream of very small particles is created by processes like attrition and overspraying (the fraction of droplets of the suspension KOS that dry before they hit a particle). Since they are so small, a fraction of these particles is bound to the wet surface of bed materials particles right away (Kgrowth). Even so this is in principle a kind of agglomeration, since the size difference of the particles is so big, the effect on the seed particles is not different as for the drying of a droplet that hits, so it can be modeled as an addition to the granulation. The rest of these small particles is ejected with the leaving fluidization gas. Usually this gas is cleaned by some kind of separation device (e.g. cyclone, filter, etc.). If a fraction of the dust Ksep is recycled into the granulator, it again gets the chance to contribute to the granulation. The extended model implemented takes these effects into account, to formulate an expression for the rate of change in the cumulative mass of the bed material: P P e P,tot m A m t A ∂ =
∂ & (24)
e susp w OS growth sep
att P,tot growth sep
m m (1 x ) 1 K (1 K K )
K A K K 1
= − − − + + − & & (25)
Fig. 1 provides a scheme for the mass balance of a granulator, used to derived Eq. (25) for m&e.
By replacing the mass of the particles by the density and the diameter, the growth rate G can be obtained: e P P P,tot 2m d G t A ∂ = = ∂ ρ & (26)
For coupling the particle system model and the heat and mass transfer model, a characteristic scalar value for the average size of the particles is needed. In the implementation the Sauter-diameter d32 is used: P,tot 32 P P P,tot 6m d d A = =
ρ (27)
S
susp W
m
m (1 x )
= −
& &
OS OS susp W
m& =K m& (1 x )−
att att P,tot
m& =K A
[
]
du,out
sep OS att
m
(1 K ) m m
= − + & & & internal seeds,OS growth du,OS m
(1 K )m
= − & & internal seeds,OS growth du,att m
(1 K )m
= − & & du,OS sep OS m K m = & & du,att sep att m K m = & & int int
, 0, ,
& ernal ernal seeds OS seeds OS
N q growth du,OS growth du,OS m K m = & & growth du,att growth du,att m K m = & & int int
, 0, ,
& ernal ernal seeds att seeds att
N q
Granulator
Overspray AttritionSeparator
filter cyclone-Dust
OS (K ) growth (K ) att (K ) sep (K )Figure 1: Balance scheme around the granulator.
RESULTS AND DISCUSSION
Temperature and Humidity Distributions
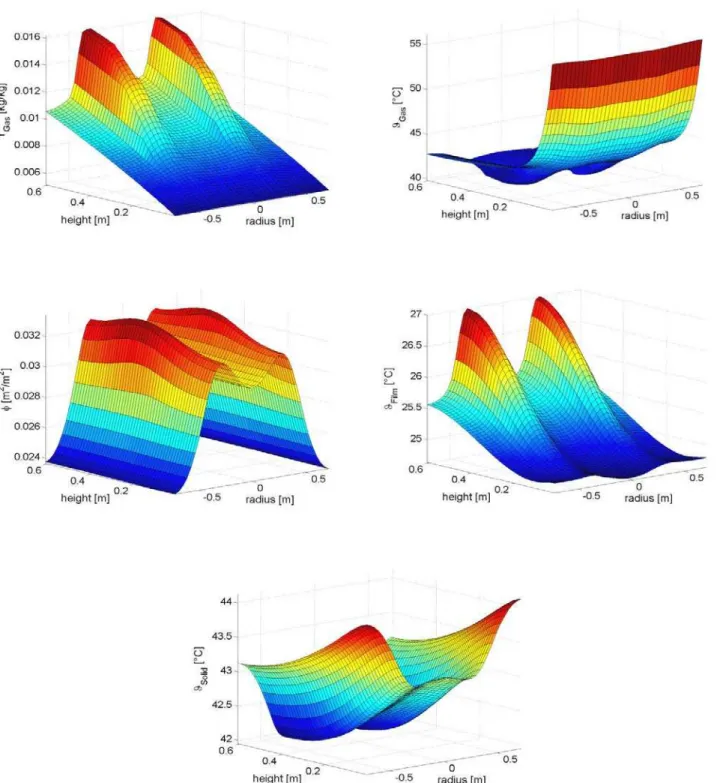
For the spatial steady-state presentation of the balance variables, a top-down water spraying process into a FB of platic particles (dP,32 = 3.2 mm, mbed = 370 kg) was simulated (Figure 2). Two single-fluid full cone spray nozzle (spraying angle = 60°) is positioned in the in the height of the FB (diameter: 1.5 m, height: 0.6 m). The air humidity increases almost linearly in the axial direction with the distance from the distributor plate. The air temperature decreases strongly directly over the distributor plate, reaches already in the FB the outlet temperature, and remains throughout the FB area almost constant. In other words, an average constant bed temperature may be assumed. The particle temperature, which is not shown in the figure, decreases slowlier than the air temperature due to the particles’ heat capacity, and during stationary
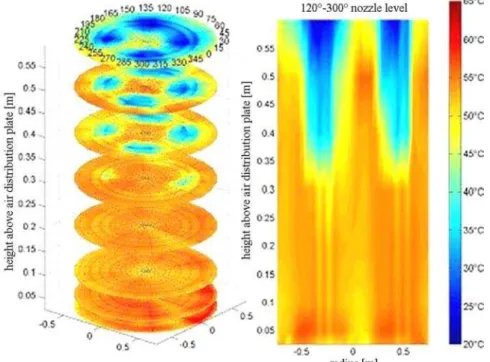
Figure 3: Measured stationary spatial air temperature distributions of a water sprayed FB of plastic spheres (m&A=25000 kg/h, ϑA = 60 °C).
A number of stationary spatial air temperature distributions were measured with a special probe (14 PTFE isolated NiCr-Ni thermocouples for protection of heat conduction, wetting and particle contact) in a water-sprayed industrial-scale plant (total height: 10 m, diameter: 1.5 m, cross section area = 1.77 m²). The water was atomized by four single-fluid full cone spray nozzles (m&L =4 x 45 kg/h) into a monodisperse FB of plastic spheres (d32,bed = 3.3 mm,
ρP = 1380 kg/m³, mbed = 370 kg). The plant was operated discontinuously. The chamber walls were isolated with mineral wool to approximate adiabatic conditions. The height was adjusted in 50 resp. 100 mm steps, starting directly 0 mm over the distribution plate up to the nozzle height at 600 mm. The radial measurement succeeded in 15° steps. Figure 3 illustrate measured spatial air temperature distributions in the FB. The left side of the diagram shows the whole bed in horizontal layers, while the right side shows a vertical cross-section through the FB at a nozzle level 120°/300°.
The air temperature gradients shows an inhomogeneous particle and liquid distribution. The nozzles‘s shapes can easily be recognized. Three characteristic zones form are formed: A heat transfer right over the distributor plate; the heated particles reach the upper zones, where they dispose their stored heat for the evaporation process; an average constant air temperature forms the largest part of the FB, due to the high heat and mass transfer. At the upper sprayed part of the FB a mass transfer zone is formed, from which cold particles are transported to the lower part of the FB and absorb heat. These
results reconfirm statements of Smith and Nienow (1982), of Maronga and Wnukowski (1997) and Trojosky (1991).
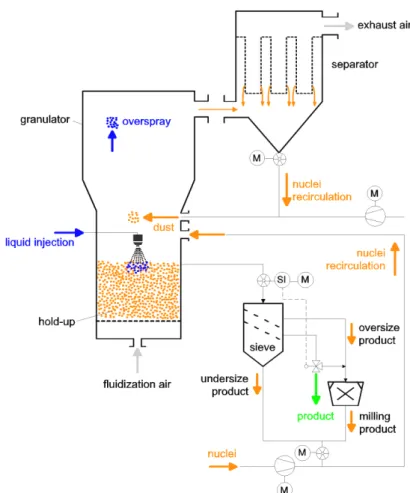
Particle Size Distributions
In Figure 4, the scheme of the continuous granulation process with external separation and recycle is shown with the parameters of the simulations. A cylindrical fluidized bed apparatus with a diameter of 0.4 m was selected. As process parameters, the hold-up mass was set to 20 kg (ρP = 1500 kg/m³, cS = 790 J/(kg K), λS = 1.1 W/(m K)) and the suspension injection rate was 50 kg/h with
ϑL,in = 20 °C, xS = 30 mass-%. The operation velocity is set 15 times higher as the minimal fluidization velocity (ϑA,in = 220 °C, YA,in = 0.01 kg/kg).
In simulation 1 a granulation process is investigated in which the fraction of the sieve oversize is milled into a coarse diameter range (dm = 0.75 mm). Number density distributions q0 with assumed Gaussian normal distribution, an average
diameter of d and a standard deviation of σ, are used to input the distribution parameters of hold-up, of overspray, of dust (seeds by attrition), of screen oversize product, of screen undersize product and of milling product. The parameters are given in Table 1.
Figure 4: Flow sheet for the continuous process with external separation.
Table 1: Parameters of the particle dize distributions of the simulations.
Hold-up
dbed,0 0.65 mm
σbed,0 0.077 mm
Overspray
dOS 0.21 mm
σOS 0.023 mm
Dust
ddu 0.5 mm
σdu 0.08 mm
Mill
dm 0.75 (Sim 1) mm
0.6 (Sim 2) mm
σm 0.05 mm
Screen (oversize)
dscreen,o 1.2 mm
σscreen,o 0.06 mm
Screen (undersize)
dscreen,u 0.8 mm
A coarser milling reduces the number of seeds particles, increases the mass-related surface and promotes the particle growth. As recognizable in Figure 5 and 6, the fluctuations decreases and the process is in a steady state after 16 hours. The central condition is the continuous screen oversize flux and the constant non-classifying discharge, which leads to a constant bed mass. The pneumatic parameters illustrates a steady-state Reynolds number around 100 and a suitable bed height of 0.62 m with high bed porosities, whereby the operation point is between the fluidization point and the discharge point. As is recognizable, the bed mass is constant during the entire start-up and the number of particles in the bed, the particle surface in the bed and the heat and mass transfer parameter are constant after 16 hours. The wetting efficiency of 13 % is ideal for layering granulation. The Sauter diameter of the particles in the bed and final product are almost the same with 0.98 mm. The particle size distribution indicates a bimodal distribution caused by the re-feeding of fine seeds in constrast to the hold-up material. The steady-state concerning population balances is obtained, when all particles originating from hold-up material are removed.
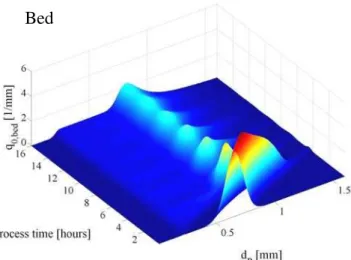
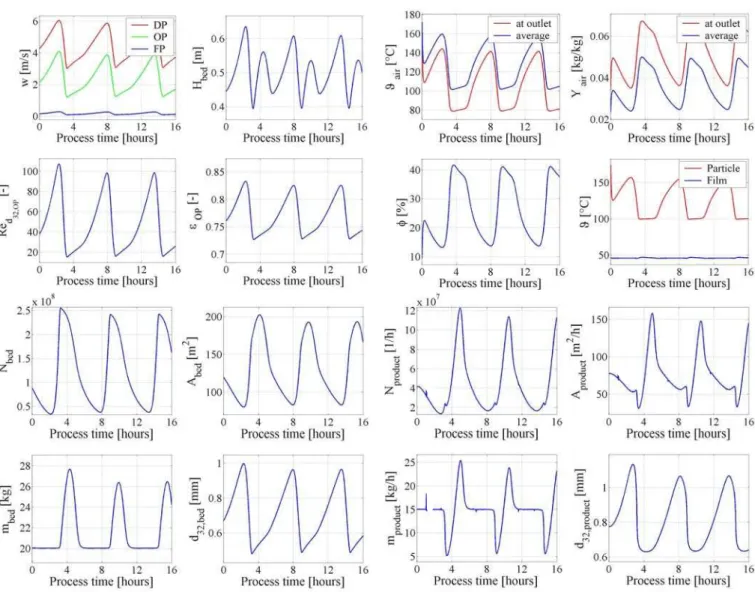
In Simulation 2 the degree of milling is increased (dmill = 0.4 mm). The hold-up in the apparatus is sprayed with a constant solid suspension rate. With the assumption of the uniform wetting of the particles a surface proportional growth occurs for the first period of 2 hours. Then, a large number of fine-milled particles with a large specific surface is re-fed into the bed as internal seeds. As a result a slowing down of the growth process is noticeable. That means, as a result of the fine milling the screen oversize mass flow completely disappears at some time intervals. The constant production or re-fed of seeds is the central condition for a stable continuous fluidized bed. The process has no internal damping (Figure 7 and Figure 8). With increased process time the amplitudes of the oscillations increases and the process runs unstable due to the fine milling of the screen oversize particles. By the constant discharge of particles and the following external separation, all granulates which correspond to the fraction of the sieveoversize are sieved out. The entire particle spectrum of the particles in bed is below the sieve oversize fraction, which is tantamount to a standstill of the feeding-in of seeds. Avoiding this state, a constant flux of oversize granules has to be achieved by a large growth rate.
Figure 5: Calculated number density distribution in the fluidized bed of a continuous granulation process with stable behaviour (Sim. 1).
Figure 6: Calculated parameters of a continuous granulation process with stable behaviour (Sim. 1).
Figure 7: Calculated number density distribution in the fluidized bed of a continuous granulation process with unstable behaviour (Sim. 2).
Figure 8: Calculated parameters of a continuous granulation process with unstable behaviour (Sim. 2).
CONCLUSIONS
The presented heat and mass transfer model for a liquid sprayed gas/solid FB allows the calculation of wetting, deposition and drying of the sprayed-in drops onto FB particles. The heat- and mass transfer model provides perceptions over spatial temperature- and concentration fields. Simulation results and experiments determined that a narrow area right above the distributor plate exists, which may be defined as the heat transfer zone. There the air temperature decreases strongly (after few particle layers) due to energy absorbed by colder particles. As a result of the dispersion, these particles reach the FB surface, where their energy is transferred back to the air at the spraying area. The liquid on the particles evaporates through its contact with the air and so the air humidity rises. The spraying zone can
therefore be defined as a mass transfer zone and is characterized by high wetting efficiency. An average constant bed temperature is between both zones. The model was coupled with a population balance model for the calculation of the time-dependent particle size distribution in the FB -or in the product mass flow during continuous operation with external separation and milling - taking into account attrition, dust formation, self-nucleation and product discharge.
NOMENCLATURE
A surface area, with A* = A/V m² c specific heat capacity J/(kg K)
d diameter m
∆f liquid film thickness m
G growth rate m/s
∆hV specific heat of evaporation J/kg
H height m
K coefficient (-)
m mass kg
m& mass flow kg/s
*
m
&
mass flow per area kg/(m² s)M molar mass kg/mol
N particle number (-)
N& particle flux 1/s
p pressure Pa
R universal gas constant J/(mol K)
Re Reynolds number (-)
t time s
T temperature K
V volume m³
w velocity m/s
Y gas moisture content (dry basis)
kg/kg
z length coordinate m
Subscripts
A air (-)
att attrition (-)
bed fluidized bed (-)
e effective (-)
Ev evaporation (-)
F fluidization (-)
in at inlet (-)
inuc internal seeds (-)
L liquid (-)
OP operation point (-)
OS overspray (-)
out at outlet (-)
P particle (-)
S solid (-)
St steam (-)
tot total (-)
W water (-)
0 initial (-)
∞ saturation point (-)
Greek Symbols
α heat transfer coefficient W/(m² K)
β mass transfer coefficient m/s
ε porosity of the fluidized bed m³/m³
ϑ temperature °C
ρ density kg/m³
σ standard deviation mm
ϕ wetting efficiency (-)
REFERENCES
Gnielinski, V. (1980), Wärme- und Stoffübertragung in Festbetten, Chem.-Ing.-Tech. 52, 228-236.
Heinrich, S. and Mörl, L. (1999), Fluidized bed spray granulation - A new model for the description of particle wetting and of temperature and concentration distribution, Chem. Eng. Proc. 38, 635-663.
Heinrich, S., Peglow, M., Ihlow, M., Henneberg, M. and Mörl, L. (2002), Analysis of the start-up process in continuous fluidized bed spray granulation by population balance modelling, Chem. Eng. Sci. 57, no. 20, 4369-4390.
Heinrich, S., Peglow, M., Ihlow, M. and Mörl, L. (2003a). Particle population modeling in fluidized bed spray granulation - analysis of the steady-state and unsteady behavior, Powder Technol. 130 (1-3), 154-161.
Heinrich, S., Blumschein, J., Henneberg, M., Ihlow, M., Peglow, M. and Mörl, L. (2003b), Study of multi-dimensional temperature and concentration distributions in liquid sprayed fluidized beds, Chem. Eng. Sci. 55 (2003) 23-24, 5135-5160.
Kawase, Y. and Moo-Young, M. (1987), Gas-bubble hold-up and axial dispersion coefficient of emulsion phases in fluidized beds, Can. J. Chem. Eng. 65, no. 3, 505-507.
Maronga, S.J. and Wnukowski, P. (1997), Establishing temperature and humidity profiles in fluidized bed particulate coating, Powder Technol. 94, 181-185.
Mörl, L., Mittelstraß, M. and Sachse, J. (1977). Zum Kugelwachstum bei der Wirbelschichtrocknung von Suspensionen oder Lösungen, Chem. Techn. 29 (10), 540-541.
Randolf, A. and Larson, M. (1988). Theory of Particulate rocesses, 2nd. ed. New York: Academic Press, 1988.
Rangelova, J., Mörl, L., Heinrich, S. and Dalichau, J. (2004). Zerfallsverhalten von Partikeln in Wirbelschichten – Anwendung eines konstanten oberflächenbezogenen Abriebskoeffizienten, Chem. Ing. Techn. 76 (8), 1078-1086.
Smith, P.G. and Nienow, A.W. (1982), On atomising
a liquid into a gas fluidised bed. Chem. Eng. Sci. 37, no. 6, 950-954.
Trojosky, M. (1991), Modellierung des Stoff- und Wärmetransportes in flüssigkeitsbedüsten Gas/Feststoff-Wirbelschichten, Dissertation (PhD), TU Magdeburg.