*e-mail: [email protected]
Evaluation and Modelling of Integral Capacitors Produced
by Interdigitated Comb Electrodes
Leandro Alfredo Ramajoa*, Damian Enrique Ramajob, María Marta Reboredoa,
Diego Hernan Santiagoa, Miriam Susana Castroa
a
Institute of Research in Material Science and Technology – INTEMA,
CONICET, University of Mar del Plata,
Juan B Justo 4302 (B7608FDQ), Mar del Plata, Argentina
b
International Center for Computational Methods in Engineering, CIMEC, INTEC,
Güemes 3450 (S3000GLN), Santa Fe, Argentina
Received: September 18, 2008; Revised: December 10, 2008
Integral capacitors (IC) of one or two-layer printed wiring board (PWB) circuits were produced using comb electrodes fixtures and dielectric composites as the inter-electrode material. ICs were fabricated at laboratory scale, using copper comb electrodes and BaTiO3-epoxy composite materials deposited on a glass-Epoxy FR4 board. They were experimentally tested in order to obtain their electrical response. Furthermore, ICs behaviour was modelled through 2-dimensional models applying finite element method (FEM). Results showed that by this laboratory technique it was possible to obtained integral capacitors with low dielectric losses. Moreover, acceptable agreement was found between numerical and experimental capacitance results for all the different analysed ICs. In conclusion, 2D FEM models are a suitable tool to predict electric response of IC devices.
Keywords: integral capacitors, dielectric composites, FEM
1. Introduction
Interdigital capacitors (IDC) for technological applications have been studied by many authors since the early 1970s. The applica-tions of these components include lumped elements for microwave integrated circuits1-3, optical and surface acoustic wave devices2, optically controlled microwave devices4, thin-film acoustic-electronic transducers and comb electrodes devices for dielectric characteriza-tion of polymers and ceramics materials5. Recently, IDC have been studied for humidity determinations6-7 and gas sensing8-10. Typical interdigital capacitive sensors (IDC-S) are made of an “inert” substrate over which comb electrodes are depositated. In this way, polymers, as active material, have been used for organic vapour sensing because they exhibit rapid reversible vapour absorption and are easy to ap-ply as thin or thick films by a variety of techniques11. These sensor arrays can be part of an electronic nose for a particular application depending on the sensitive layers that are chosen.
Usually, integral capacitors (IC) are plane devices, based on the ground and power sheets of the printed wiring boards (PWB) to create the two conductors, applying then a dielectric material in order to separate them. Moreover, IC with one or two layers of PWB could be produced using comb electrodes in order to reduce costs and optimize the process design of new electronic circuits. Never-theless, the mainproblem of these devices is the difficulty to obtain components with specific characteristics because of the absence of analytical expressions to predict their electrical response. If both combs have interdigitated electrodes with the same shape and an infinite top air layer, the structures can be acceptably approximated with the proposed method of capacitance computation11. Despite this, for electronic applications, the specific capacitances need to be known for every different configuration. In this way, finite element method (FEM) can be used in order to determine the effective capacitance, modelling IC real geometries by means of 2D and 3D models.
On the other hand, polymeric composite materials, consisting of dielectric ceramic particles immersed in an epoxy resin, have
been reported to have interesting properties for a wide range of applications12-14, like passive electronic devices. Because of their good performance and low cost, small size and light weight, polymeric ceramic materials have arisen much attention mainly for microelec-tronic packaging applications.
In this work, ICs made by using comb electrodes and a dielectric polymeric composite material (BaTiO3-epoxy) were fabricated and experimentally and numerically studied. The electric response of the composite material deposited on comb electrodes was evaluated by means of a quasistatic approximation using the constitutive Laplace equation. 2D periodic models were employed to represent the real geometry of IC, and FEM was applied in order to solve them. The numerical results were confronted with experimental ones measured at room temperature and at range of frequency from 20 Hz to 1 MHz.
2. Experimental Procedure
2.1. Comb electrode geometry
1 cm2, a substrate permittivity of 5.8ε0 (glass-Epoxy FR4 board) and electrode height of 25 µm were prepared.
2.2. Dielectric material
Barium titanate ceramic powder BaTiO3 (TAM Ceramics Inc) was doped with 0.6 wt. (%) of Nb2O5 to modify its dielectrical prop-erties. Powders were immersed in isopropilic alcohol and mixed by agitation at 6000 rpm during 5 minutes. Afterwards, the alcohol was eliminated by heating at 65 ºC until constant weight was reached. The powder was thermally treated at 1350 ºC for 180 minutes and cooled until room temperature was reached with a cooling rate of 3 ºC/min. The powder was milled for 90 minutes in isopropilic alcohol using a planetary mill with ZrO2 balls (Fritsch, Pulverisette 7) until an aver-age particle size of 1.4 µm was obtained.
As regards the dielectric composite material, the matrix was made by mixing epoxy DER 325 (Dow Chemical), and DEH 324 (Dow Chemical) as the curing agent (12.5 phr), while the doped BaTiO3 was introduced as the discrete phase. The viscosity of the mixture was reduced by adding tetrahydrofuran (THF, Dorwil Chemical) at a concentration of 10 wt. (%).
The ceramic powder was added to the epoxy resin at different volume fractions (0 to 40 vol. (%)) and suitably blended by employing an ultrasonic mixer (Sonic vibra-cell 150 W) during 4 minutes. Then, the different composites were deposited by pouring the material onto the glass-Epoxy FR-4 boards and cured at 100 ºC for 2 hours. Finally, vacuum was applied in order to extract the THF.
The BaTiO3 concentration of the composites was analysed by ther-mal gravimetric technique (TGA, Shimadzu TGA-50) under controlled nitrogen atmosphere, starting from room temperature with a heating rate of 10 ºC/min up to 800 ºC. In addition, after the curing process the dispersion of BaTiO3 particles into the composites was analysed through Scanning Electron Microscope (SEM, JEOL 6460LV).
Electric measurements were performed at room temperature us-ing a Hewlett Packard 4284A impedance analyzer in the frequency range from 20 Hz to 1 MHz. IC microstructure was studied using a scanning electron microscopy (SEM, JEOL 6460LV).
3. Numerical Modelling
Finite element analysis, using Petrov Galerking Standar, was applied to estimate the electrostatic potential distribution within the dielectric material and the effective capacitance of the comb-electrodes configurations. More details about FEM formulation can be found in previous works12-13.
The capacitance (C) of each electrode along the direction which corresponds to the applied electric field (V) was calculated by means of the following relationship14:
(C1+C2) (C1+C2) (C1+C2)
(C1+C2)
C .C C
q
C= = =
V 2C 2 , being
2 . 1 .
q ε E dA ε E dA (1)
where q is the effective electric charge of electrodes, E is the electric field, ε1and ε2are the permittivities of each surface and A is the area of the surface where the field is applied.
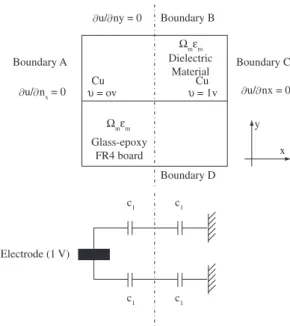
Figure 1b shows the computational domain extracted from the overall IC. As noted from this figure, a periodic assumption can be employed to represent the comb electrodes structures. So, to reduce the computational cost of simulations, only a small fraction of the overall geometry was considered (pointed as periodic computational domain in Figure 1b). Taking into account the two relevant param-eters, the capacitance per unit of area was obtained.
The applied boundary conditions for A and C surfaces (see Figure 2) were a difference in potential (∆V = U2-U1) of 1V along the x direction, a gradient of potential null in x direction (∂u/∂nx = 0), and finally a gradient of potential null along the y direction at the other boundaries (B and D). Table 1 shows the initial and final vol-ume fractions of BaTiO3 in the composites, and Table 2 displays the electric properties of the ICs tested. The permittivities reported in Table 2 were employed for computational simulations. Calculations were performed using a software developed by the authors and post processing of results was carried out with Octave.
UV Lamp
Photomask
Blue coloured positive resin
Glass epoxy FR4 board
C 300M C 300M
Periodic computacional domain
Dieletric material
Electrodes gap
Comb 1 (Cu)
Comb 2 (Cu) (a)
(b)
Figure 1. Outline and method of manufacture of comb electrode capacitors.
y
x Boundary C Boundary A
Boundary B
Boundary D
u/ nx = 0 u/ ny = 0
u/ nx = 0
Cu Cu
= ov = 1v Dielectric
Material
Glass-epoxy FR4 board
mεm
mεm
Electrode (1 V)
c1 c1
c1 c1
4. Results and Discussion
4.1. Comb electrodes
The measured BaTiO3 volume fractions and the corresponding solvent percentages retained inside the composites with different filler amount are shown in Table 1. A slight variation between initial and final BaTiO3 volume fraction and a low concentration of THF retained (below 1 wt. (%)) after the curing step can be observed. These results suggest that there are not significant differences between initial and final BaTiO3 concentrations, and that the influence of solvent concentration can be negligible for numerical analysis.
10 6 8 10 12 14 16 18
6
4 8 10 12 14 16 18 20 22
100 1000 10000 100000 100000
10 100 1000 10000 100000 100000
Capacitance (pF
.cm
2)
Frecuency (Hz)
Capacitance (pF
.cm
2)
Frecuency (Hz)
BaTiO3 0% vol BaTiO3 10% vol
BaTiO3 20% vol
BaTiO3 40% vol
BaTiO3 30% vol
Capacitors with: 1 cm2 and 500 m
Capacitors with: 1 cm2 and 400 m
(a)
(b)
Figure 3. Experimental results of capacitance of interdigital capacitors with gaps between electrodes of 400 and 500 µm as a function of frequency and
BaTiO3 volume fraction at 20 ºC.
The permittivity of composites and the capacitance of ICs for two electrodes gaps (400 and 500 µm) are shown in Table 2. It can be seen that capacitance increases as electrodes gap reduces. Moreover, capacitance is linearly proportional to permittivity and electrodes gap. So , IC capacitance of samples performed without any inter-electrode dielectric material (defined as Air in Table 2) represents the lowest capacitance value of each electrode gap analysed.
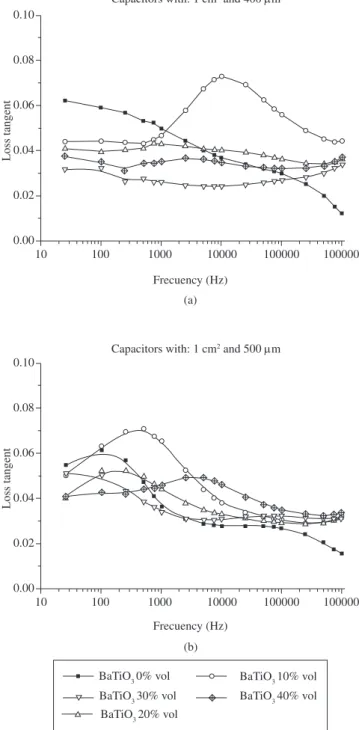
The capacitance and the loss tangent for both electrodes gaps as a function of frequency and filler amount are plotted in Figures 3 and 4, respectively. As expected, capacitance was influenced by frequency and filler concentration, and the slight decrease with frequency was due to the classic Debye process.
10 0.00 0.02 0.04 0.06 0.08 0.10
100 1000 10000 100000 100000
Loss tangent
BaTiO3 0% vol BaTiO3 10% vol
BaTiO3 20% vol
BaTiO3 40% vol
BaTiO3 30% vol
Capacitors with: 1 cm2 and 500 m
Capacitors with: 1 cm2 and 400 m
Frecuency (Hz)
(a)
10 0.00 0.02 0.04 0.06 0.08 0.10
100 1000 10000 100000 100000
Loss tangent
Frecuency (Hz)
(b)
Figure 4. Loss tangent of interdigital capacitors with gaps between electrodes
of 400 and 500 µm as a function of frequency and BaTiO3 volume fraction
On the other hand, although, the system with 10 vol. (%) of BaTiO3 and electrodes gap of 400 µm showed an abrupt peak after 10 KHz, loss tangent did not show strong variations in the frequency range from 100 Hz to 10 KHz,. In addition, the systems with elec-trodes gap of 500 µm showed peaks for different frequencies. These peaks could be caused by a combination of several factors; the most important being the influence of the electrodes at low frequencies, the polarization effects, the influence of the substrate (at low filler concentration) and the high conductivity of the samples15.
Figure 5 shows SEM micrographs from transversal cross sec-tions of samples with electrodes gaps of 400 µm and different filler
15 kv x130 100 m 40 30 SEI
15 kv x130 100 m 44 30 SEI 15 kv x2.000 10 m 44 30 SEI
15 kv x130 100 m 47 30 SEI 15 kv x130 100 m 45 30 SEI
(a) (b)
(d) (e)
(c)
Figure 5. SEM of comb electrodes with: a) 10 vol. (%), b), 20 vol. (%), c) 30 vol. (%), d) 40 vol. (%) of BaTiO3 and e) amplification showing in detail the end of one electrode from picture c.
Table 1. Initial and finally obtained volume fractions of BaTiO3 and retained THF percentages for composites with different filler concentrations
(deter-mined through xTGA; §DSC). THF initial = 10 wt. (%).
Initial BaTiO3 (vol. (%))
Real BaTiO3x (vol. (%))
Retained THF§ (wt. (%))
10 10
<1%
20 19
30 28
40 39
Table 2. Permittivity of composites and capacitance of IC for two electrode gaps.
Material Permittivity (ε’)
Capacitance (pF/cm2) 500 µm 400 µm Air 1.00 2.81 ± 0.22 3.89 ± 0.16
Epoxi 4.12 4.02 ± 0.21 5.83 ± 0.37 Initial BaTiO3
(vol. (%))
10 7.00 5.10 ± 0.12 7.79 ± 0.32 20 10.50 7.04 ± 0.20 10.05 ± 0.54 30 16.00 9.47 ± 0.33 13.25 ± 0.57 40 26.20 14.04 ± 0.19 19.17 ± 0.59
concentrations. Pictures show a good distribution of particles in all cases and small defects in samples with higher filler amount. In these specimens, the defects were generated during sample preparation for SEM analysis, due to the low flexibility of composites caused for the presence of ceramic inclusions.
Finally, defects on copper electrodes appeared as a result of the comb manufacturing process (etching in ferric chloride acid). Due to the electrode geometry, those defects were concentrated mainly on vertices. Also, the average height of the electrodes could be deter-mined from micrographs, being 25 µm with a dispersion of 10%.
4.2. FEM Model
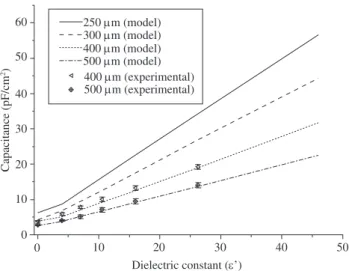
Numerical and experimental results of capacitance as a function of the material permittivity and the electrode gaps are presented in Figure 6. The numerical model fit the experimental points for
elec-60
50
40
30
20
10
10 20 30 40 50
0 0
Dielectric constant (’)
Capacitance (pF/cm
2)
250 m (model)
400 m (experimental)
500 m (experimental)
300 m (model)
400 m (model)
500 m (model)
0.4
0.2
0.0
-0.2
-0.4
-0.6
-0.8
0 0.1 0.2 0.3
0 0.1 0.2 0.3 0.4 0.5 0.6 0.7 0.8 0.9 1
X
Y
Potencial V
0.4
0.2
0.0
-0.2
-0.4
-0.6
-0.8
0 0.1 0.2 0.3
X
Y
Electric field Ez ModE
560 510 460 410 360 310 260 210 160 110 60 10
0.04
0.02
-0.02 0.00
0.14 0.15 0.16 X
Y
Composite with 40 v
ol%
0.4
0.2
0.0
-0.2
-0.4
-0.6
-0.8
0 0.1 0.2 0.3
0 0.1 0.2 0.3 0.4 0.5 0.6 0.7 0.8 0.9 1
X
Y
Potencial V
0.4
0.2
0.0
-0.2
-0.4
-0.6
-0.8
0 0.1 0.2 0.3
X
Y
Electric field Ez ModE
120 110 100 90 80 70 60 50 40 30 20 10
0.04
0.02
-0.02 0.00
0.14 0.15 0.16 X
Y
Composite with 0 v
ol%
(a)
(b)
trode gaps of 400 and 500 µm. It is easy to note the linear relation-ship between permittivity and capacitance which suggests that the substrate plays a very important role in composites with low dielectric permittivities, because the substrate permittivity represents the high-est one of the system.
Results show that differences between FEM estimations and experimental data are lower than the experimental-error estimation. It allows to conclude that FEM is suitable to be used for predicting the capacitance of real IC as a function of the material dielectric constant for electrode gaps from 400 to 500 µm. As shown in Figure 6, if FEM predictions about IC with electrode gap of 250 µm (maximum resolu-tion of photogravure technique) are right, then capacitances upper than 50 pF.cm–2 could be obtained by using composite materials with dielectric constants of 55ε0.
Figure 7 shows the numerical results of potential (V) and the electric field (Ez) for two IC with an electrode gap of 300 µm and filler fractions of 0 and 40 vol. (%). Note that the dielectric mate-rial thickness used to perform the capacitor is over dimensioned. So, it can be significantly reduced in order to decrease material costs. The potential distribution at both sides of the electrode is symmetric, while the electric field intensity is greatly increased in a small region near the electrode vertex. That is often attributed to field enhancement that occurs near the electrode tips15. In this sense, the material with the highest filler fraction (Figure 7 at the bottom) shows the highest electric field and the lowest potential spectra around the electrode.
5. Conclusions
A numerical and experimental research about the electrical response of comb-electrodes capacitors made of epoxy/BaTiO3 composites was carried out. Results of numerical simulations using FEM were confronted with experimental ones leading to the follow-ing conclusions:
• Experimentalresultsshowedthatitispossibletomanufacture
integrated capacitors using comb electrodes. ICs have good frequency response and low loss, even though it is difficult to obtain relatively high capacitances;
• Thecompositematerialwasdistributedevenlyonthecapacitor
surface, regardless of copper-electrodes surfaces showed an irregular shape due to chemical attack; and
• Experimentaldatawerecorrectlyittedbymeansof2Dperiodic
FEM models, showing capability to predict the capacitance of IC with different electrodes gaps and inter-electrodes material properties.
Acknowledgements
This work was supported by National Council of Science and Technology of Argentina (CONICET). Also it was achieved
thanks to collaboration of Eliseo Britos del Pino (CONICET´s Technician).
References
1. Alley GD. Interdigital capacitors and their application to lumped-element
microwave intergrated circuits. IEEE Transactions on Microwave
Theoryand Techniques. 1970; MTT-18: 1028-1033.
2. Wei JS. Distributed capacitance of planar electrodes in optic and accustic
surface wave devices. IEEEJournal ofQuantum Electronics. 1977;
QE-13 (4): 152-158.
3. Hoffman RK. Handbook of Microwave Integrated Circuits. Norwell MA:
Artech; 1987.
4. Schaumburg G. Dielectrics Newsletter. Novocontrol Issue. Germany:
Dirk Wilmer; 2006. p. 5-7.
5. Zaretsky MC, Mouayad L, Melchor JR. Continuum properties
from interdigital electrode dielectrometry. IEEE Transactions on
Electrical Insulation; 1988; 23(6): 897-917.
6. Qu W, Wlodarski W. A thin-film sensing element for ozone, humidity
and temperature. Sensor and Actuators B, 2000; 64(1-3): 42-48.
7. Hagleitner C, Hierlemann A, Lange D, Kummer A, Kerness N, Brand
O, Baltes H. Smart Single-Chip Gas Sensor Microsystem. Nature, 2001;
414(6861): 293-296.
8. Casalini R, Kilitziraki M, Wood D, Petty MC. Sensitivity of the electrical
admittance of a polysiloxane film to organic vapours. Sensor and
Actuators B. 1999; 56(1-2): 37-44.
9. Zhou R, Hierlemann A, Weimar U, Göpel W. Gravimetric, dielectric and calorimetric methods for the detection of organic solvent vapours using
poly(ether urethane) coatings. Sensor and Actuators B. 1996; 34(1):
356-360.
10. Rui I, Dias CJ. Analytical evaluation of the interdigital electrodes capacitance for a multi-layered structure. Sensor and Actuators A. 2004; 112(2-3): 291-301.
11. Ramajo L, Reboredo MM, Castro MS. Dielectric response and relaxation
phenomena in composites of epoxy with BaTiO3 particles. Composites
Part A. 2005; 36(9): 1267-1274.
12. Ramajo L, Reboredo MM, Castro MS. Characterisation of epoxy/BaTiO3
composites processed by dipping for integral capacitor films (ICF). Journal of Materials Science, 2007; 42(10): 3685-3691.
13. Gregorio R, Cestari JM, Bernardino FE. Dielectric behaviour of thin ilms of b-PVDF/PZT and b-PVDF/BaTiO3 composites. Journal of Materials
Science. 1996; 31 (11): 2925-2930.
14. Beroual A, Brosseau C. Comparison of dielectric properties determined from a computational approach and experiment for anisotropic and
periodic heterostructures. IEEE Transactions on Dielectrics and Electrical
Insulation. 2001; 8(6): 921-929.
15. Deken B, Pekarek S, Dogan F. Minimization of Field Enhancement in
Multilayer Capacitors. Computational Materials Science. 2006; 37(3):