*e-mail: [email protected], [email protected]
Natural Gas Storage in Microporous Carbon Obtained from
Waste of the Olive Oil Production
Cecilia Solara*, Fabiana Sardellab, Cristina Deianab,
Rochel Montero Lagoc, Andrea Vallonea, Karim Sapaga*
a
Departamento de Física, Instituto de Física Aplicada INFAP, CONICET,
Universidad Nacional de San Luis – UNSL,
Chacabuco 917, San Luis, Argentina
b
Instituto de Ingeniería Química, Facultad de Ingeniería,
Universidad Nacional de San Juan – UNSJ,
Av. Libertador Gral. San Martín, 1109, oeste, San Juan. Argentina
c
Departamento de Química, Universidade Federal de Minas Gerais – UFMG,
Av. Antonio Carlos, 6627, Belo Horizonte - MG, Brazil
Received: December 12, 2007; Revised: December 11, 2008
A series of activated carbons (AC) were prepared from waste of the olive oil production in the Cuyo Region, Argentine by two standard methods: a) physical activation by steam and b) chemical activation with ZnCl2. The AC samples were characterized by nitrogen adsorption at 77 K and evaluated for natural gas storage purposes through the adsorption of methane at high pressures. The activated carbons showed micropore volumes up to 0.50 cm3.g–1 and total pore volumes as high as 0.9 cm3.g–1. The BET surface areas reached, in some cases, more than 1000 m2.g–1. The methane adsorption -measured in the range of 1-35 bar- attained values up to 59 V
CH4/VAC and total uptakes of more than 120 cm3.g–1 (STP). These preliminary results suggest that Cuyo’s olive oil waste is appropriate for obtaining activated carbons for the storage of natural gas.
Keywords: activated carbon, natural gas storage, agricultural wastes
1. Introduction
Activated carbon (AC) is a porous material prepared from the carbonization and activation of organic compounds, especially of vegetal origin; the substrates so obtained show high micropore volumes as well as important surface areas. AC is a versatile adsorb-ent, whose textural and surface characteristics depend on the raw material of departure and on the particular method employed for its preparation1-3.
There exist two recognized methods to prepare activated carbons: physical and chemical activation4,5,6,7. Physical activation involves, as a first step, the carbonization of the precursor by thermal processes and, in a second step, the activation in the presence of agents such as CO2 and steam, among others. On the other hand, chemical activation is a one-step method that involves the carbonization of the precur-sor in the presence of chemical agents such as KOH, NaOH, ZnCl2, MgCl2, and H3PO46,8,9, which are added to reach the desired porosity. The simplest and most commonly used methods in scientific research are physical activation with steam and chemical activation with zinc chloride4,7,10,11,12,. The activation with ZnCl
2 implies the degradation of cellulose following dehydration and carbonization in order to obtain a porous structure, in which the final carbon properties are conditioned not only by the nature of the precursor but also by the impregnation conditions, the carbonization temperature, etc4,13. In the physical activation process, a lignocellulose precursor is carbonized under an inert atmosphere with the aim of obtaining a char (i.e. a substrate of a low adsorption capacity) which is then subjected to a partial and controlled gasification at high temperatures in the pres-ence of steam. This gasification eliminates selectively, in first place, the most reactive carbon atoms, afterward the most disordered ones, and finally some of the structural carbons for generating (according
to the synthesis conditions) different textural characteristics of the obtained materials4,5.
A series of substances has been used as the raw material, among them some agricultural wastes14,15 that are abundant in the Cuyo re-gion such as kernels proceeding from several fruits. A waste that has considerably increased in quantity during the last years, is that derived from the olive oil industry by reason of the great profit increase that has experimented the olive oil industry in Argentine; this, involves concern for the excess of this waste without a specific application up till now. Therefore, the production of activated carbons from this kind of waste is an interesting proposal for this sector; moreover by taking into account that most of the AC consumed in Argentine is imported from other countries due to the insufficient local production.
can store more than 150 VCH4/VAC (i.e. 150 volumes of CH4 per unit volume of AC), equivalent to compress this gas at more than 160 bar. The AC micropore volume determines the capacity of this adsorbent to store methane at room temperature and pressures up to 40 bars23,24. The ideal pore size for storing methane is approximately 0.8 nm thus corresponding to a separation between adjacent pore walls of two times the diameter of the CH4 molecule; the experimental aim is to prepare materials with a high micropore volume25. AC obtained from olive oil fulfils this last requirement, while also showing some other interesting characteristics; in spite of these advantages, only a few works have been devoted to this subject, none of them involving olive oil waste from the Argentinian Cuyo region. The waste product that remains after the almost total extraction of oil from olive, after being compressed and exposed to solvent extraction, has been denominated as olive lex and its use as a precursor for AC preparation has been scarcely cited in bibliography.
In this work, it is described the development of AC from olive lex through either chemical activation by zinc chloride or physical activa-tion by steam and its performance at pressures up to 40 bars during the adsorption of methane, the main component of natural gas.
2. Experimental
2.1. Preparation of AC samples
2.1.1. Chemical activation by zinc chloride
Olive lex, the material of departure, was kindly provided by Olivi Hnos. Mendoza (Argentine); this raw product contained pieces of olive pulp, peel, and seed. The precursor was sieved into three fractions of different particle size according to the mesh opening that was employed: (–20) for particle sizes smaller than 0.84 mm; (–10+20) for particle sizes between 0.84 and 2 mm; and (+10) for particle sizes larger than 2 mm. Afterward, these samples were dried at 383K; a mass of 5 g of the dry product was impregnated with a ZnCl2 solution following the procedure described in the bibliogra-phy24. For the preparation of the samples utilized in this work, it was used a 1:1 weight/weight ratio of ZnCl2/precursor mass for each AC adsorbent set. For the (+10) sieved sample, two more samples were prepared by employing 0.5:1 and 2:1 ZnCl2/precursor ratios. 60 mL of distilled water were added to each particular mixture of ZnCl2 and the dry precursor. Then, they were subjected to continuous stirring at 353 K, until the complete evaporation of the remnant liquid. Next, the previous impregnated precursor was carbonized in a horizontal oven at 773 K for one hour under a N2 atmosphere, at a rate of 10 K/min and a flux of 180 mL/min, followed by a cooling process performed at the same pace under the inert atmosphere. Finally, the resultant material was put in contact with 60 mL of an 1:1 aqueous solution of HCl (38 vol. (%)) by one hour and washed several times with distilled water for removing the ZnCl2 excess as well as the residual organic matter up to neutral pH. To finish, the AC samples were dried at 333 K for 12 hours and labeled as Zn1/1 (–20), Zn1/1 (–10+20), Zn1/1 (+10), Zn0.5/1 (+10), and Zn2/1 (+10), according to the quantity of Zn salt used in the preparation and the mesh size.
2.1.2. Physical activation with steam (water vapor)
This experimental procedure involves two steps: first the carboni-zation of the precursory material at 773K for one hour in a retort oven. Initially, the oven is packed with the required amount of precursor and is sealed in order that the vapors given off during the early steps of the heating process can expel all remaining oxygen from the system. Next, the material is left cooling to room temperature ready for activation with steam at high temperatures. The activation step
was made inside an AISI 316 tubular stainless steel reactor (30 mm diameter, 300 mm length) located inside an electrical oven of hex-agonal section equipped with an electronic temperature controller. During the initial heating up to the selected activation temperature, the reactor is kept under an inert N2 atmosphere. The water vapor required for the reaction was flowed to the reactor by means of a Cole Parmer Masterflex peristaltic bomb working in conjunction with an electronically controlled temperature atomizer. Table 1 lists the experimental operation conditions chosen to prepare each of the AC samples, where F represents the steam flow (in mL per minute) that was employed during the activation process.
2.1.3. Methods and techniques
N2 Adsorption-desorption isotherms at 77 K were performed in an Autosorb-1MP (Quantachrome-USA) instrument in order to de-termine some textural properties of the AC samples. Each adsorbent was previously degassed at 523 K for 12 hours. Specific surface area were calculated by the BET equation and the pore size distribution by a Non-Local Density Functional Theory approach, NLDFT.
Methane adsorption analyses were performed at room tempera-ture by means of an HPVA 100 volumetric instrument (VTI Corpo-ration-USA) in a range of pressures extending from 1 to 40 bars. This instrument can measure adsorption isotherms up to 100 bars of pressure in a wide range of temperatures.
3. Results and Discussion
Figure 1 shows the N2 adsorption-desorption isotherms at 77 K corresponding to the AC samples prepared by chemical activation. The isotherms are Type IV, according to the Brunauer-Deming-Deming-Teller (BDDT)26 classification, and in the low pressure region a steep adsorption is observed thus proving the presence of micropores. The hysteresis loop confirms the presence of mesopores; the Type H4 loop
0 50 100 150 200 250 300 350 400
V
olume adsorbed at STP (cm
3.g 1)
Relative pressure, P/Po
Olive Lex Zn 1/1 ( 20) Zn 1/1 ( 10+20) Zn 1/1 (+10)
0 0.2 0.4 0.6 0.8 1.0
Figure 1. N2 adsorption-desorption isotherms for the samples sieved with different mesh sizes.
Table 1. Physical activation conditions.
Sample Activation conditions Raw
material
Precursor mass (g)
Temperature (K)
Time (min)
show adsorption and desorption branches parallel to each other and almost horizontal27,28,29. These characteristics correspond to materi-als having pores of slit-like shapes (commonly found for carbons). The sample (+10) mesh, i.e. the one with the largest particle size, shows the higher adsorption along all of the pressure range, thus possessing the highest specific surface area as well as the highest total pore volume.
The raw material contains pieces of olive pulp, peel and seed with a preponderant proportion of the last one. The contribution of the seed in the properties of the final substrate seems to guarantee a high specific surface area. In turn, the peel, i.e. the component with the smaller mesh granulometry, provides a contribution of an intermedi-ate surface area to the final substrintermedi-ate. Following this line of thought, the pulp, with the intermediate granulometry, appears to provide the smaller contribution to the final surface area of the AC.
Figure 2 shows the pore size distribution (PSD) of the AC sam-ples; this distribution was calculated by the NLDFT formalism. The PSD evidence the presence of mesopores (voids of more than 20 Å) in all AC samples, which quantity slightly grows with the increase of the precursory particle size. The Zn1/1 (–20) sample, mainly originated from peel, shows a large proportion of ultramicropores, i.e. voids of widths lesser than 0.7 nm, while the sample obtained from the precursory constituted of the bigger particle sizes presents a larger proportion of supermicropores, i.e. micropores larger than 0.7 nm and mesopores.
Since the activated carbon endowed with the largest specific sur-face is that synthesized from a precursory (+10) mesh, this carbon was selected for chemical activation from ZnCl2/raw material mixtures corresponding to 0.5:1 and 2:1 ratios. Figure 3 shows the N2 isotherms of these samples. It is noticed that the Zn0.5/1 (+10) sample, shows a Type I-isotherm, according to BDDT classification26, having no hysteresis cycle which is a characteristic of many microporous solids; a small external surface area is also evident where the adsorption capacity is related to a high internal surface area2. The Zn2/1 (+10) sample depicts a Type IV isotherm and present a type H4 hysteresis loop, according to the IUPAC classification, thus corresponding to pores with slit shape, characteristic of several activated carbons.
Figure 4 shows the pore size distribution (NLDFT) of the samples sieved at +10 meshes. It is observed that the AC sample, prepared with the smallest quantity of activating agent, scarcely display pores larger than 20 Å, thus the material is mostly formed by micropores as suggested by the isotherm shape. The porosity increases with the increase in the amount of the activating agent, and the Zn2/1 (+10) sample has the largest micro and mesopore volumes. It is noticeable in each PSD a bimodality effect in pores smaller and bigger than 0.8 nm (8 Å) of diameter, which can be associated to the raw material characteristics for this kind of activating agent.
Table 2 shows the textural parameters of the AC substrates pre-pared from chemical activation. The specific surface area (SBET) was calculated through the BET equation; the total pore volume (VT) was estimated by N2 adsorption at 0.98 relative pressure by the Gurvischt rule; the micropore volume was obtained from application of the Dubinin-Radushkevich method.
In the Table 2 it is corroborated what is seen in the Figure 4 where, for the same ratio of activating agent to precursory material, it appears a dependence of the specific surface on the granular size composition of the sample. With an increase in the quantity of the activating agent (AA/M), the pore total volume increases practically in a lineal way. However, this does not happen with the PSD values, where the tendency is to observe the presence of micropores up to a limit where mesopores start to grow up.
For the same relationship AA/M, VT values remain constant, but the PSD suggests a dependence on the sample composition (granule size).
In order to compare with a second activation method, which is cheaper and widely spread at industrial scale, the precursory samples were subjected to a physical activation. Figure 5 shows the N2
iso-0.00 0.01 0.02 0.03 0.04
0 10 20 30 40 50
0.00 0.01 0.02 0.03 0.04 0.00 0.01 0.02 0.03 0.04
Zn1/1 (+10)
Zn1/1 (20)
Pore Width (Å)
Zn1/1 (10+20)
Pore v
olume (cm
3Å 1g 1)
Figure 2. Pore Size Distribution by DFT method for the samples sieved at different mesh sizes.
Relative pressure, P/Po
0 0.2 0.4 0.6 0.8 1.0
0 50 100 150 200 250 300 350 400 450 500 550 600 650
Olive Lex Zn 0.5/1 (+10) Zn 1/1 (+10) Zn 2/1 (+10)
V
olume adsorbed at STP (cm
3.g
)
therms of the physically activated samples proceeding from carbon-ized olive lex as the raw material; the samples are labeled as LAAFn (Table 1). The increase in the agent/material per minute (F/mass) ratio employed for the preparation of the LAAF1 and LAAF2 samples resulted in not improvement of the specific surface area. However, the increase of the activation time for the LAAF3 sample provided an enlarged surface area. The sorption curves of Figure 5 are Type IV isotherms, according to the BDDT26 classification, with an associated hysteresis cycle of the H4 Type29.
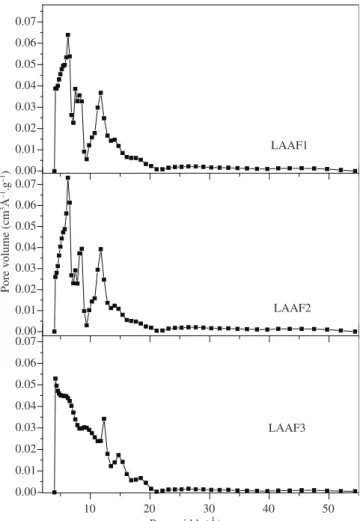
The specific surface areas of the physically activated carbon samples are high, and then interesting and their shape reveals that they mostly consist of micropores. In Figure 6, it is shown the pore size distribution, NLDFT, for these samples. It can be noticed that the samples exposed to the same activating time (LAAF1 and LAAF2) keep showing a bimodal distribution, which almost disappears when the activation time increases. The increase in the activating agent quantity
Table 2. Comparative data of the activated carbons using ZnCl2.
Sample Activating agent ZnCl2/precursor ratio (w/w) Precursor amount (g) SBET (m2.g–1) V
T (cm3.g–1) Vµ (cm3.g–1)
Zn1/1 (+10) ZnCl2 1/1 5 1052 0.58 0.51
Zn1/1 (–10+20) ZnCl2 1/1 5 816 0.56 0.40
Zn1/1 (–20) ZnCl2 1/1 5 977 0.56 0.44
Zn0.5/1 (+10) ZnCl2 0.5/1 5 542 0.27 0.22
Zn2/1 (+10) ZnCl2 2/1 5 1291 0.91 0.52
Pore v
olume (cm
3Å 1.g 1)
0.00 0.01 0.02 0.03 0.04
0.00 0.01 0.02 0.03 0.04
0 5 10 15 20 25 30 35 40 45 50 55
0.00 0.01 0.02 0.03 0.04
Zn 0.5/1 (+10)
Zn 1/1 (+10)
Pore width (Å)
Zn 2/1 (+10)
Figure 4. Pore Size Distribution by DFT method for the samples sieved at (+10) mesh size.
Relative pressure, P/Po
0 0.2 0.4 0.6 0.8 1.0
0 50 100 150 200 250 300 350
Amount adsorbed at STP (cm
3.g
)
Olive Lex LAAF1 LAAF2 LAAF3
Figure 5. N2 adsorption-desorption isotherms for the physically activated samples.
0.00 0.01 0.02 0.03 0.04 0.05 0.06 0.07
10 20 30 40 50
0.00 0.01 0.02 0.03 0.04 0.05 0.06 0.07 0.00 0.01 0.02 0.03 0.04 0.05 0.06 0.07
LAAF2
Pore v
olume (cm
3Å 1.g 1)
Pore width (Å)
LAAF3 LAAF1
makes no difference in the PSD shape and goes against the SBET, which is shown both in the table and in the isotherms. When the activating time increases new pores of about 8-10 Å are created in the microporous zone, without a significant variation in the total pore volume.
Table 3 shows the textural data for the physically activated sam-ples, there it can be noticed that the increase in the agent/material proportion per minute (R) only achieves a minor diminution of the SBET. However, by increasing the activation time in 30 minutes, an increase in the specific surface area is produced. The pore volumes show no important variations for the three samples in question.
In order to study the potential use of the variety of synthesized AC substrates for natural gas storage, methane adsorption was per-formed. CH4 adsorption isotherms were determined up to a pressure of 40 bar at 298 K. Figure 7 shows the resultant CH4 isotherms for the (+10) size samples (activated with ZnCl2) at different proportions of the Zn salt and the precursor. It can be observed that the samples with the larger pore volumes for micro, meso and macropores and bigger superficial area depict a higher adsorption capacity for meth-ane (See Table 2). Then, for these samples there exist a correlation in their adsorption capacity for both methane and nitrogen, reported also for other authors20,22,30.
Methane isotherms associated to the physically activated sam-ples are shown in Figure 8. At pressures up to 16 bars, the samsam-ples show minor differences and it again appears a correlation with that observed for the nitrogen adsorption, which evidences an anal-ogy in the methane and nitrogen adsorption behavior. At pressures higher than 16 bar, this behavior changes therefore confirming that the apparition of micropores smaller than 1.2 nm (12 Å) affects the methane adsorption.
Table 4 shows the ratio of the volume of adsorbed methane versus the adsorbent volume (Q’) calculated at 35 bar of pressure according to the following equation22:
4
CH AC app
Q' = V /V = Q M⋅ ⋅m ⋅δ (1)
Figure 8. Methane Adsorption isotherms for the physically activated samples. Table 3. Compared data for physically activated carbons.
Sample Activating agent
R (mL.g–1/min)
SBET (m2.g–1)
VT (cm3.g–1)
Vµ (cm3.g–1) LAAF1 H2O 0.0167 913 0.45 0.40 LAAF2 H2O 0.0284 852 0.42 0.38 LAAF3 H2O 0.0167 1015 0.48 0.40
Table 4. Methane storage.
Sample δap (g/cm3) Q´ = V/V
Zn0.5/1 (+10) 0.46 36
Zn1/1 (+10) 0.39 43
Zn2/1 (+10) 0.38 52
LAAF1 0.49 59
LAAF2 0.53 57
LAAF3 0.50 55
0 5 10 15 20 25 30 35 40
0 20 40 60 80 100 120 140
Amount adsorbed at STP (cm
3.g 1)
Pressure (bar)
Methane isotherms Zn0.5/1 (+10) Zn1/1 (+10) Zn2/1 (+10)
Figure 7. Methane isotherms for the samples activated with ZnCl2.
where Q is the molar storage capacity (mol of methane/kg of activated carbon), M is methane molecular weight (g/mol), m is the volume occupied by 1 gram of methane in STP (1.5 dm3.g–1) conditions, and
δapp apparent density of the CA (g/cm3).
Table 4 indicates that the physically activated samples corre-spond to the best CH4 storage values; also that these samples have a scarce amount of mesopores and depict large apparent densities. Moreover, these results suggest that samples including an important proportion of large micropores (supermicropores) produce the best results for the storage of methane at pressures around the reference value (35 bar).
4. Conclusions
Activated carbons of a very low cost were successfully prepared from olive pomace (a mixture of olive pulp, peel and seeds) follow-ing the almost total extraction of the oil. These materials showed surface areas up to 1000-1200 m2.g–1 with a micropore volume of about 0.50 cm3.g–1.
Three different precursors, according to the particle size of their constituting grains, were chemically activated by the annealing of a sample containing a 1:1 weight ratio of ZnCl2 /olive pomace precursor. The dry pomace sample containing the largest particle size (+10), which we assume is principally composed of olive seed, was the one that adsorbed more nitrogen than any other along all the pressure range, thus evidencing a high specific surface area and a large pore volume. The pore size distribution showed that all these carbon samples are principally microporous with a slight presence of mesopores that increases with the particle size of the precursory waste. For the same particle size (+10) of the precursory material, an increase in the amount of the activating agent enlarged the porosity of the final carbon. For methane adsorption, the carbon samples having
0 5 10 15 20 25 30 35 40
0 20 40 60 80 100 120
Amount adsorbed at STP (cm
3.g 1)
Pressure (Bar)
the largest porosities and the highest surface areas represented the best alternatives for CH4 storage.
The physically activated samples showed high specific surfaces and porosities in the microporous range. The increase of the activation time resulted in an increase in the quantity of the smaller micropores, something that was detrimental with respect to methane adsorption in the pressure value of reference (35 bar). The carbon samples contain-ing pores of widths between 1 and 2 nm showed the best methane adsorption characteristics.
All carbon samples showed a significant capacity for the adsorp-tion of methane, reaching saturaadsorp-tion values near to 120 cm3.g–1 (STP), equivalent to a VCH4/VAC ratio of about 59, which corresponded to a 35 bar pressure. This characteristic proved the potential that have these activated carbons to store natural gas in an efficient way with the incentive of their low production cost.
Further studies are necessary not only to optimize the synthesis process but also to achieve a more successful correlation between the textural characteristics and the storage capacity.
References
1. Tsai WT, Chang CY, Lee SL. Preparation and characterization of activated
carbons from corn cob. Carbon 1997; 35(8):1198-1200.
2. Olivares-Marín M, Fernández-González C, Macías-García A, Gómez-Serrano V. Preparation of activated carbon from cherry stones by
chemical activation with ZnCl2. Applied Surface Science 2006; 252(17):
5967-5971.
3. Önal Y, Akmil-Başar C, Sarici-Özdemir Ç, Erdoğan S. Textural
development of sugar beet bagasse activated with ZnCl2. Journal of
Hazardous Materials 2007; 142(1-2): 138-143.
4. Cartula F, Molina-Sabio M, Rodriguez-Reinoso F. Preparation of
activated carbon by chemical activation with ZnCl2. Carbon 1991; 29(7):
999-1007.
5. Rodriguez-Reinoso F, Molina-Sabio M. Activated carbons from lignocellulosic materials by chemical and/or physical activation: an
overview. Carbon 1992; 30(7): 1111-1118.
6. Ahmadpour A, Do DD. The preparation of active carbons from coal by
chemical and physical activation. Carbon 1996; 34(4): 471-479.
7. Rodriguez-Reinoso F, Molina-Sabio M, Gonzalez MT. The use of steam and CO2 as activating agents in the preparation of activated carbons.
Carbon 1995; 33(1): 15-23.
8. Moreno-Castilla C, Carrasco-Marín F, López-Ramón MV, Álvarez-Merino MA. Chemical and physical activation of olive-mill waste water
to produce activated carbons. Carbon 2001; 39(9): 1415-1420.
9. Hsu L, Teng H. Influence of different chemical reagents on the preparation
of activated carbons from bituminous coal. Fuel Processing Technology
2000; 64(1): 155-166.
10. Hu Z, Srinivasan MP. Mesoporous high-surface-area activated carbon.
Microporous and Mesoporous Materials 2001; 43(3): 267-275.
11. Kula I, Uğurlu M, Karaoğlu H, Çelik A. Adsorption of Cd(II) ions from
aqueous solutions using activated carbon prepared from olive stone by
ZnCl2 activation. Bioresource Technology 2008; 99(3): 492-501.
12. Baçaoui A, Yaacoubi A, Dahbi A, Bennouna C, Phan Tan Luu R, Maldonado-Hodar FJ, Rivera-Utrilla J, Moreno-Castilla C. Optimization
of conditions for the preparation of activated carbons from olive-waste
cakes. Carbon 2001; 39(3): 425-432.
13. Khalili NR, Campbell M, Sandi G, Golas J. Production of micro- and mesoporous activated carbon from paper mill sludge. I. Effect of zinc
chloride activation. Carbon 2000; 38(14): 1905-1915.
14. Heschel W, Klose E. On the suitability of agricultural by-products
for the manufacture of granular activated carbon. Fuel 1995; 74(12):
1786-1791.
15. Amaya A, Medero N, Tancredi N, Silva H, Deiana C. Activated carbon
briquettes from biomass materials. Bioresource Technology 2007; 98(8):
1635-1641.
16. MacDonald JAF, Quinn DF. Carbon adsorbents for natural gas storage.
Fuel 1998; 77(112): 61-64.
17. Inomata K, Kanazawa K, Urabe Y, Hosono H, Araki T. Natural gas
storage in activated carbon pellets without a binder. Carbon 2002; 40(1):
87-93.
18. Prauchner MJ, Rodríguez-Reinoso F. Preparation of granular activated
carbons for adsorption of natural gas. Microporous and Mesoporous
Materials, 2008; 109:581-584.
19. Menon VC, Komarneni S. Porous Adsorbents for Vehicular Natural Gas
Storage: A Review. Journal of Porous Materials 1998; 5: 43-58.
20. Lozano-Castelló D, Alcañiz-Monge J, de la Casa-Lillo MA, Cazorla-Amorós D, Linares-Solano A. Advances in the study of methane
storage in porous carbonaceous materials. Review. Fuel 2002; 81(14):
1777-1803.
21. Biloe S, Goetz V, Mauran S. Characterization of adsorbent composite
blocks for methane storage. Carbon 2001; 39: 1653-1662.
22. Celzard A, Albiniak A, Jasienko-Halat M, Mareché JF, Furdin G. Methane storage capacities and pore textures of active carbons undergoing
mechanical densification. Carbon 2005; 43(9): 1990-1999.
23. Azevedo DCS, Araújo JCS, Bastos-Neto M, Torres AEB, Jaguaribe EF, Cavalcante CL. Microporous activated carbon prepared from coconut
shells using chemical activation with zinc chloride.Microporous and
Mesoporous Materials 2007; 100(1-3): 361-364.
24. Almansa C, Molina-Sabio M, Rodríguez-Reinoso F. Adsorption of
methane into ZnCl2-activated carbon derived discs. Microporous and
Mesoporous Materials 2004; 76(1-3): 185-191.
25. de la Casa Lillo, MA. Fibras de Carbones Activados: Caracterización
y Aplicaciones en separación y Almacenamiento de Gases. [Tesis de Doctorado]. Alicante, España: Univ. de Alicante; 1999. Cap. VII, p. 171-173.
26. Gregg SJ, Sing KSW. Adsortion, Surface Area and Porosity. Second Ed.
London: Academic Press; 1982.
27. Hua Z, Srinivasanb MP, Nia Y. Novel activation process for preparing
highly microporous and mesoporous activated carbons. Carbon 2001;
39(6): 877-886.
28. Rouquerol F, Rouquerol J, Sing K. Adsortion by powders and porous
solids. Principles, methodology and application. London.Academic Press; 1999.
29. Martín Martínez JM. Adsorción física de gases y vapores por carbones.
España: Imprenta de la Universidad de Alicante; 1990.
30. Lozano-Castello D, Cazorla-Amorós D, Linares-Solano A, Quinn DF. Influence of pore size distribution on methane storage at relatively low
pressure: preparation of activated carbon with optimum pore size. Carbon