Evaluation of the Photocatalytic Potential of TiO
2and ZnO Obtained by Diferent Wet
Chemical Methods
Patrícia Gonçalvesª*, Roberto Bertholdoª, Jeferson Almeida Diasb, Sylma Carvalho Maestrelliª,
Tania Regina Giraldiª
Received: December 07, 2016; Revised: May 18, 2017; Accepted: May 22, 2017
This paper describes the development of TiO2 and ZnO particles by a chemical route, using two
diferent wet synthesis methods: polymeric precursor (PP) and sol-gel (SG). This study aimed to shed a light on how the synthesis method afects the photocatalytic activity of these oxides. Rhodamine B (RhB) degradation was used as a probe reaction to test the as-synthesized TiO2 and ZnO photoactivity.
It was observed that surface availability, which is related to the presence of synthesis residue, is the
key parameter to determine photoactivity. ZnO PP and ZnO SG presented degradation of 88% to RhB. Both samples presented synthesis residue on the surface. On the other hand, TiO2 PP presented a better
performance than TiO2 SG, once 90% of RhB was degraded, while TiO2 SG degraded 80% of the dye. In this case, TiO2 PP was free of synthesis residue on the surface, while TiO2 SG presented residues.
Keywords: TiO2, ZnO, Rhodamine B, photocatalysis
* e-mail: [email protected]
1. Introduction
Water contamination generated by dyes originating
from the textile industries is a growing problem1–4 since
these pollutants typically show color and toxicity even in
low concentration5-6. Several processes have been used to promote the water decontamination, among them physical
and chemical processes. Physical processes including adsorption, coagulation, and locculation7-9. These processes allow the removal of pollutants from the environment but do
not promote their degradation. On the other hand, chemical
processes can be used to promote water treatment by the
oxidation of organic molecules (pollutants). Among those, a
particular case is the photocatalysis, where a semiconductor
surface is activated by UV-light to generate free radicals from OH• adsorbed species. These radicals are responsible for the
degradation of contaminants such as organic molecules10. The
more eicient semiconductors that promote photocatalysis
are TiO2 and ZnO11-14. These semiconductors present band gap suitable for such process, which allows for degrading of
100% of dyes in a short time15,16. However, several factors
can interfere with the catalytic activity of these materials17,18,
e.g., the method of synthesis19, the presence of surface contaminants20-22, particle shapes23, etc.
Han et al.24 synthesized TiO
2 at low temperatures,
by varying the pH and the ions present in the synthesis
environment. The photocatalytic tests with these samples showed the inluence of the morphology on the photocatalytic
eiciency of the material, being this result justiied in terms of the speciic surface area of each morphology. Xie et al.25
studied morphological control reports on TiO2 nanocrystals
synthesized via the solvothermal method, with the introduction of ethylenediamine (EDA). In this synthesis, EDA acts as a growth inhibitor, since without EDA nanowires were obtained, and after its introduction into the synthesis, nanoibers were also obtained. McLaren et al.23 investigated the photocatalytic
activity in the decomposition of methylene blue in aqueous
solution as a function of average ZnO morphology. The authors veriied a correlation of the properties of the shape
factor, despite not having observed any apparent dependence
on particle size. Similar results were reported by Yu et al.26
in studies on the decolorization of RhB aqueous solutions photocatalyzed by ZnO hollow spheres with porous crystalline shells. Zheng et al.27 synthesized hydrothermally uniform
single-crystalline ZnO nanodisks and nanowires with well-deined crystal planes. It was demonstrated that the ZnO nanodisks with a high population of (0001) facet show higher
catalytic activity by the comparison of photodegradation of
RhB with ZnO nanowires used as the catalyst. The authors suggest that catalysts may be designed and synthesized to optimize the catalytic activity of nanocrystalline with well-deined active facets.
Despite the comprehensive literature about TiO2 and
ZnO properties, as well as several studies about the efect
of synthesis parameters on the formation of these materials, the role of synthesis parameters in the evolution of TiO2 and
ZnO photocatalytic properties is still not entirely understood. aUniversidade Federal de Alfenas, campus Poços de Caldas, Rod. José Aurélio Vilela, BR 267, Km 533,
11999, Zip Code 37715-400, Poços de Caldas, MG, Brazil
In this context, this study investigated the synthesis of titanium oxide and zinc oxide by diferent soft chemical
methods and correlated the synthesis parameters with the
material’s photocatalytic activity, using RhB degradation as a probe reaction. Two diferent wet methods, sol-gel, and
polymeric precursor methods28,29, were studied regarding
the photoactivity of the products. The aim of this study was
to gain a better understanding of how the synthesis method
afects the photocatalytic activity of TiO2 and ZnO.
2. Experimental
2.1. Particle synthesis
ZnO and TiO2 samples were prepared by the two diferent
routes of ceramic processing: polymeric precursor (PP) and sol-gel (SG) methods. For the polymeric precursor method29,
in a typical procedure, citric acid (HOC(CO2H)(CH2CO2H)2,
Alfa Aesar) was dissolved in 50 mL of distilled water preheated to 70 ºC under constant stirring. Then, titanium precursor or zinc precursor, titanium isopropoxide (Sigma-Aldrich) and zinc acetate (Ecibra), respectively, were added to this solution to promote the formation of a metal complex. The molar ratio of citric acid to metal (zinc or titanium) was set at 3:1. A proportion of 40:60 (wt%) of ethylene glycol (HOCH2CH2OH, Ecibra) to citric acid was then added to the
solution to trigger a polymerization type reaction, which is desirable to improve the stability of the resulting complex.
The solution was heated under constant stirring until a viscous
resin was formed. This resulting solution was calcined at 300 ºC for 2 h to eliminate organic phase and volatile ions, followed by a crystallization treatment at 600 ºC, at a heating and cooling rate of 10 ºCmin-1. For the precipitation route28, samples were prepared by precipitating particles in
a 0.025 molL-1 solution of each precursor separately, using
ammonium hydroxide (NH4OH P.A., Isofar) to pH control.
Both solutions (zinc and titanium) were stabilized at pH equal 8. This reaction yielded in a white precipitate, which
was isolated by centrifugation and washed with distilled
water to remove residual reagents. Finally, the dry powder was calcined at 500 ºC for 2 h, using a heating and cooling rate of 5 ºCmin-1.
2.2. Particles characterization
X-Ray difraction was performed by the Shimadzu XRD 6000 equipment (Cu Kα) between 10 and 100°. The
TiO2 (JCPDS card n°. 21‒1272) and ZnO (JCPDS card n°.
36‒1451) lattice parameters were estimated by the Rietveld Reinement procedure30. The GSAS‒EXPGUI software was
utilized; and micrometric yttrium oxide (Sigma‒Aldrich, 99.99%) was utilized as the pattern. In order to estimate the powders’ crystallite size and lattice strain, The Williamson‒
Hall methodology was used31. The speciic surface area (S.A.)
by nitrogen physisorption, using the Brunauer, Emmett, and Teller (BET) method, was measured in a Micromeritics Gemini VII equipment. About 500 mg of the powder was previously prepared in Micromeritics Vap Prep 061, Sample Degas System. A degas was done at 100 ºC, with a heating at 10 ºC/min, with evacuation range in 5.0 mmHg/s at 60 min. The morphology was characterized by Field Emission Scanning Electron Microscopy (JEOL, JSM-6701F). KBr-pellets were examined by infrared spectroscopy technique in a Perkin-Elmer Spectrum 1000 spectrophotometer, with
range to 4000 at 450 cm-1.
2.3. Photocatalytic essays
RhB (Synth) was used as a probe dye for the photocatalytic essays. Suspensions containing 5.0 mgL-1 of RhB and
400 mgL-1 of ZnO or TiO
2 particles were prepared and
irradiated during 90 min. The photocatalytic assays were performed in a batch reactor equipped with four Philips 15 W mercury lamps (UV-C, 254 nm). The reduction in dye
concentration was estimated based on color removal, which
was determined by spectrophotometry (Cary 60 UV-Vis, da Agilent spectrophotometer). Blank experiments carried out in RhB solution without particles (direct photolysis) showed the no occurrence of dye degradation in those conditions.
3. Results and discussion
3.1. Characterization
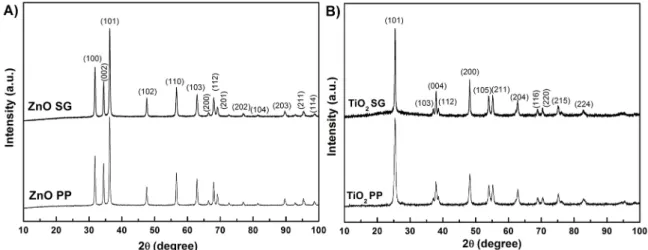
The X-Ray difractograms are shown in Figure 1. No secondary phase was observed in the difractograms. Thus, both synthesis methods evaluated in this work, PP and SG, were eicient to produce ZnO and TiO2 with high levels
of purity.
Moreover, regarding TiO2 powders, only anatase phase
was observed in the difractograms. This result is desirable
because it is the main TiO2 polymorph applied to photocatalysis.
Figure 2 shows a comparison between the X‒Ray experimental data and the proile adjusted by the Rietveld Reinement. These proiles were quite similar for all the samples, and the diferences between them are close to a continuous line. Furthermore, all values for the convergence
criterion χ2 were close to the unity (ideality)32. Therefore,
these results indicate that the quality of reinements was satisfactory for all the samples.
Table 1 shows the values of reined lattice parameters a,b (Å) and c (Å) compared to the theoretical ones from the crystallographic cards previously cited. In addition, the unit
cell volumes V (Å3) were also presented. It is noticed that the
Figure 1. X‒Ray difractograms for A) ZnO powders and B) TiO2 powders obtained by diferent methodologies.
Figure 2. Comparison between the X-Ray experimental data and Rietveld proile for A) ZnO SG; B) ZnO PP; C) TiO2 SG; and D) TiO2 PP.
from ionic defects created during the synthesis, which can
afect the values of lattice parameters and unit cell volume, consequently.
The values of average crystallite size D (nm) and lattice strain ε (%) estimated by means of Williamson-Hall
methodology31 are shown in Figure 3. All the samples showed
nanometric crystallite sizes, which can be an indicative of
small particles33,34. The samples obtained by the PP method
have shown low values of lattice strain when compared to the
Table 1. Reined lattice parameters and unit cell volume for the ZnO and TiO2 powders.
Sample a , b c V a , b c V
(A) (A) (Å3) (Å) (Å) (Å3)
ZnO SG 3.2495 5.2056 47.603 Pattern from JCPDS card (ZnO)
ZnO PP 3.2502 5.2072 47.639 3.2492 5.2054 47.593
TiO2 SG 3.7877 9.5236 136.634 Pattern from JCPDS card (TiO2)
TiO2 PP 3.7840 9.5111 136.190 3.7840 9.5140 136.228
Figure 3. Values of crystallite size and lattice strain for the ZnO
and TiO2 powders.
be related to the creation of a smaller number of structural defects during the stage of synthesis, which tends to stress
less the structure compared to the SG method.
Comparing the synthesis methods utilized to produce ZnO, the SG methodology has produced particles with smaller crystallite size (near 37%). Concerning samples composed by
TiO2, the powders obtained by polymeric precursors showed
both lower crystallite sizes and lower lattice strain. Therefore,
these results indicate that the TiO2 particles produced by PP showed a lower quantity of structural defects, besides lower
values of crystallite sizes.
Table 2 shows speciic surface area data. ZnO SG and
TiO2 PP presented larger surface area.
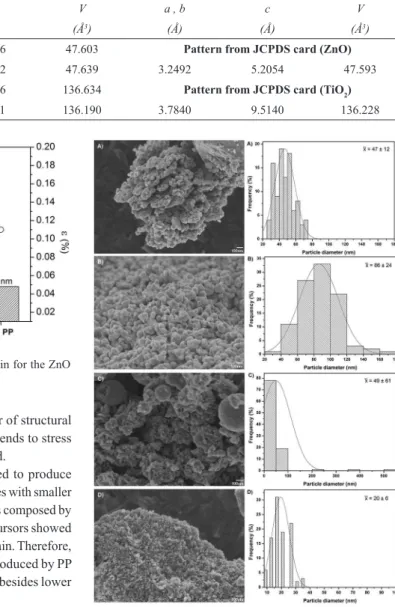
The dimensions, morphology, and particle size distribution
of ZnO and TiO2 particles analyzed by FEG-SEM are presented
in the images of Figure 4. Such images show nanometric particles for all samples and smaller particle size for ZnO SG and TiO2 PP.
The ZnO SG particles (Figure 4A) were agglomerated
but ordered and with a slightly faceted behavior, typical of
the hexagonal structure of the wurtzite phase, found in X-ray difraction (Figure 1A). This behavior was also observed
Table 2. Crystalline phase, surface area, and average particle size.
Sample Crystalline phase (mS.A. 2.g-1) Average particle size (nm)
ZnO SG Wurtzite 5.55 47
ZnO PP Wurtzite 4.35 86
TiO2 SG Anatase 9.57 49
TiO2 PP Anatase 10.91 20
Figure 4. FEG-SEM microscopy and particle size diameter of A)
ZnO SG, B) ZnO PP, C) TiO2 SG, and D) TiO2 PP.
in other studies, such as Nascimento et al.35.Most of the
particles had dimensions in the order of 40 nm, according
to the histogram of particle size distribution represented by Figure 4A. In the study of Azam et al.36, ZnO SG particles
presented almost spherical shape and agglomeration, with
diameters of about 20 nm. Arshad et al.37, in turn, found pure
ZnO SG particles, also of spherical morphology, but with larger sizes, with an average diameter of 55 nm, which are closer to those found in this work.
ZnO PP particles (Figure 4B) were structured in the same way as the ZnO SG particles, mostly with sizes of 80 nm approximately (Figure 4B). Guo et al.38 found particles
of pure ZnO PP, also of approximately spherical shape and
diameters of 10 to 60 nm, relatively smaller but close to
By analyzing comparatively the histograms present in Figure 4A and 4B, it can be identiied that in the case of ZnO SG, the particle size distribution is more uniform and presents smaller size variation, from 25 to 75 nm, whereas the particle size of ZnO PP ranges from 20 to 180 nm. In addition, according to these histograms, the particle size of ZnO PP is larger, which corresponds to the fact that it has a smaller surface area (Table 2).
The TiO2 SG particles had a size of about 45 nm (Figure
4C), irregular form and formation of spherical agglomerates (Figure 4C). TiO2 PP particles, as shown in Figure 4D, were
irregular, with apart agglomerations and smaller diameters than TiO2 SG, with an average size of 20 nm (Figure 4D).
From the images of Figure 4C and 4D, it is possible to
observe that TiO2 SG presented morphology with a higher porosity than TiO2 PP.
According to the graphs presented in Figure 4C and 4D, the size variation of the TiO2 SG particles is much larger
than TiO2 PP. TiO2 SG presents two populations of the
particle sizes: the main one with sizes from 20 to 100 nm (97%) and another around 500 nm. The latter correspond
to agglomerates probably originated from nucleation and growth process of these particles during the synthesis and
heat treatment. The particle sizes of TiO2 PP appear much
smaller, varying from 8 to 38 nm, which is consistent with
its larger surface area.
Bahadur, Jain, and Pasricha39 obtained values of average
particle sizes for TiO2 SG, in the range of 16 to 19 nm, diferent
from this work. The average particle diameter of the TiO2
PP found in Nascimento et al.35 was 15 nm, a dimension
quite compatible with those obtained in this work. Vargas et al.40 detected TiO
2 PP particles of irregular shapes, with
smooth edges and sizes of approximately 10 nm, also close to those of this study.
The average particle size of the synthesized oxides was directly related to their respective surface areas. According
to the considerations made and the results presented, it is
possible to observe this relation, in which the oxides that
presented the higher surface area, TiO2 PP and ZnO SG,
presented smaller particle size.
Figure 5A shows the FTIR spectra of ZnO SG and ZnO PP. In these spectra, the intense bands observed are attributed to the stretching vibrations of the Zn-O bond appearing in
the region of 445 and 465 cm-141. The wide bands located in the region of 3450 cm-1 and also the bands around 1625 cm-1 can be attributed to the vibrations of the O-H group.
The bands at 2960 and 2930 cm-1 can be attributed to the
symmetric stretching of the C-H groups. The other bands
observed are relatively more intense in the spectra of the ZnO
PP than in the ZnO SG. The O-C=O stretching is detected
in 802 cm-1 and the bands around 1026, 1091, 1098, 1258,
and 1379 cm-1 can be attributed to C-O or C-O-C vibration.
Figure 5B shows the spectra of TiO2 SG and TiO2 PP.
The intense bands at 500 and 600 cm-1 correspond to the
O-Ti-O bond42. The band observed at 1380 cm-1 corresponds
to the C-H bond, which is relatively more intense in the
TiO2 PP sample.
According to the FTIR results, ZnO SG, ZnO PP, TiO2
SG and TiO2 PP showed, besides the functional groups
characteristic of each oxide, other groups containing carbon and oxygen, except TiO2 SG, which indicates the presence
of organic residues of the precursors used in both synthetic
methods. These residues persist even after heat treatment.
The presence of adsorbed species on the surface of the
particles may inluence their growth, since these species,
due to steric hindrance, may prevent a greater contact between the particles and, consequently, they may have their growth prevented43, resulting in a smaller particle size
and larger surface area. This fact can be evidenced in the
sample TiO2 PP, which presented residual organic group
in the FTIR spectrum (1380 cm-1) at the same time that it
exhibited smaller particle size and larger surface area than
TiO2 SG. In the case of the ZnO PP and ZnO SG samples,
both presented organic residues in their spectra.
It is worth mentioning that a presence of organic residues
that may inluence particle growth, they can still compete
with active sites on the surface of the nanoparticles, resulting
in a lower catalytic activity.
For ZnO, the zinc acetate precursor proved to be a favorable precursor in obtaining the wurtzite phase, both in SG and PP. In the case of SG synthesis, the dissociation
of the salt in the alcoholic medium allowed the complete formation of Zn2+, and, with a controlled amount of water,
the occurrence of hydrolysis and polycondensation with
consequent formation of crystallites in the 53 nm range. In the case of PP method, the homogeneous distribution of
the cations in the polymeric structure allowed, after heat
treatment, crystallites formation with greater size than ZnO SG, 73 nm. However, the particles obtained by PP presented larger size than those obtained by SG. This result is justiied
by the higher heat treatment temperature in which the particles
obtained by PP were submitted when compared to the SG method. This leads to the occurrence of the sintering process.
In fact, the literature reports the phenomenon of sintering of
nanoparticles of ZnO thermally treated at 500 ºC41, which
shows that the thermal treatment temperature promotes this
phenomenon. In addition, the ZnO SG exhibited a larger surface area, which is consistent with its smaller particle size.
The titanium isopropoxide precursor was favorable in
obtaining the anatase phase in both methods of synthesis for the TiO2. However, it is believed that in the SG process
it has uncontrolled hydrolysis, i.e. addition of excess water,
which has probably provided abrupt precipitation, which
may have turned the synthesis of diicult control of particle size. Consequently, the control of crystallite size and particle morphology becomes diicult. In fact, when comparing the size of crystallites and particles of TiO2 obtained by SG
Figure 5. FTIR spectra of A) ZnO and B) TiO2.
crystallites and particles than the same material obtained by
SG. This is because the PP method promotes the complexation of the metal (in the case Ti4+), which allowed greater control
of the synthesis and consequently the formation of smaller
crystallites. The formation of these smaller crystallites, in
turn, allowed the formation of smaller particles, despite the
higher heat treatment temperature in relation to the SG. In
addition, TiO2 PP presented higher surface area, which is consistent with the fact that it had a smaller average particle
size, and organic residues on its surface (Figure 5B).
3.2. Photocatalysis
The synthesized nanoparticles were used in the photodegradation of RhB under UV-C irradiation. A similar experiment was also carried out in darkness in order to evaluate the RhB adsorption, however, no color removal was observed, indicating that adsorption could be neglected.
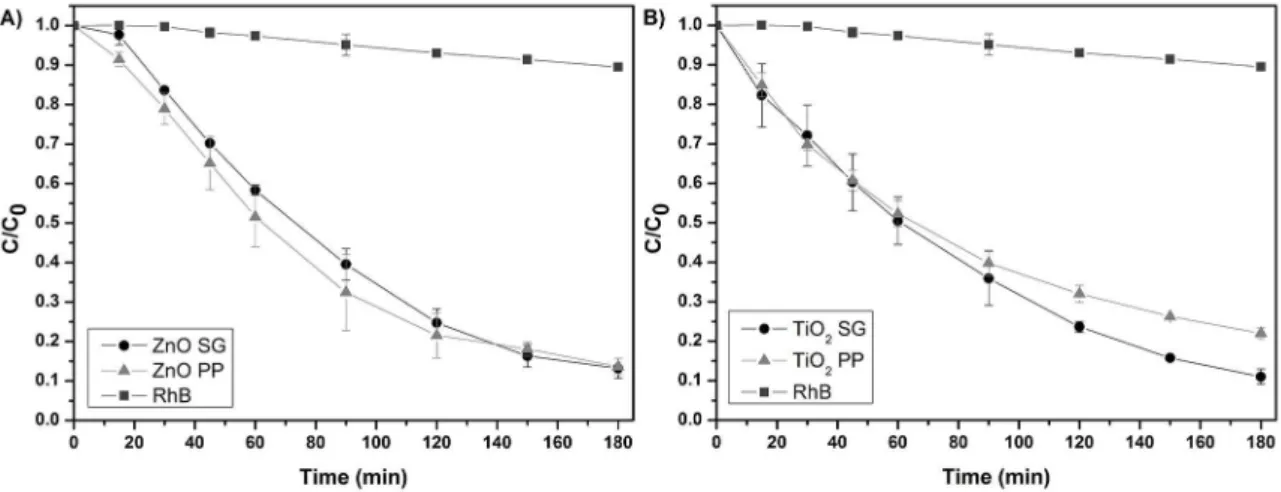
Figures 6 presents the photocatalytic tests results using the synthesized oxides, TiO2 and ZnO, under UV-C irradiation.
ZnO and TiO2 promoted color removal of the RhB solutions. These semiconductors are appropriate in photocatalytic reactions15,44, promoting the kinetic represented in Figure 7.
According to Figure 6A, ZnO SG and ZnO PP promoted degradation of 88% of RhB within 180 minutes. Considering previously discussed data, ZnO SG had a much smaller particle size and a slightly larger surface area than ZnO PP (Table 2). However, these factors were not major in
the photocatalytic properties, since, despite these discrete
diferences, both have the same photocatalytic eiciency. In addition, the results obtained by FTIR (Figure 5A) show that
both samples have residues of synthesis adsorbed on their
surface. These residues can compete with the active sites
of the photocatalyst43, and then impair the photocatalysis
eiciency. Thus, although photocatalytic eiciency was signiicant, it could have been even better if the surface of the particles were free of residues of synthesis.
In the case of TiO2 (Figure 6B), within 180 minutes, TiO2 SG
promoted degradation of 90% of RhB, while TiO2 PP degraded
80%. Despite TiO2 PP presenting smaller particle size and larger
surface area than TiO2 SG, this material had C-H species adsorbed
on its surface (Figure 5B), possibly corresponding to residues of synthesis. This fact may have caused lower photocatalytic activity since these residues are competitors of active sites.
Once the discoloration of the dye was monitored in relation to the time, it was possible to calculate the reaction constant
and the half-life time of the processes under study. Equation 1 relates the degradation time to the RhB concentration:
’ , ( ) ln RhBRhB ln CC k t 1
0 0
- T Y=- T Y=
where k’= k [SA], k is the velocity constant of the reaction, [SA] is the concentration of active sites on the catalyst surface, t is the irradiation time, and RhB is equal to C, which represents the concentration of RhB dye15.
The formation of radicals responsible for dye degradation
is correlated to high velocity constant of the reaction (k’) and low half-life time. However, for the constant k’ to be
high, which will inluence the kinetics of degradation, the
concentration of available active sites must also be high, since
they are directly proportional, as can be seen in Equation 1. Equation 2 allows the calculation of the time required to
reduce by half of the concentration of organic compounds:
’ ,
( )
ln
t
k
2
2
/ 1 2
=
where t1/2 is the half-life time15.
According to Equation 1, -ln(C/C0) versust represents
a line with an angular coeicient equal to the velocity
constant of the reaction, k’15. In Figures 7A and 7B, there is
Figure 6. Evolution of the relative concentration of RhB as a function of the irradiation time relative to A) ZnO and B) TiO2.
Figure 7. First order kinetics referent to the Rhodamine B degradation in diferent catalysts: A) ZnO and B) TiO2.
Table 3 contains the values of k’ obtained from Figures 7A and 7B, and their respective half-life times, calculated by Equations 1 and 2, respectively. For ZnO, the reactions
presented values of k’ and t1/2 quite close. On the other
hand, the values of k’ and t1/2 of TiO2 have been shown to be relatively distinct, with TiO2 SG being highlighted with the highest k’ and consequently smaller t1/2, and therefore
with the higher velocity of photodegradation. This is because
TiO2 PP presents organic residues adsorbed on its surface, as evidenced previously, thus causing less photocatalytic
activity even with smaller particle size and greater surface area. In addition, it is worth mentioning that TiO2 SG
presented identical values of k’ and t1/2 to those of ZnO PP. Both oxides are therefore equally eicient in the degradation of the dye under study.
4. Conclusions
The methods of synthesis of PP and SG allowed obtaining
ZnO and TiO2. Both methodologies resulted in the same crystalline phases for TiO2 and ZnO, despite diferent thermal
treatments. TiO2 PP and ZnO SG had a higher surface area
and a smaller average particle size. Furthermore, in both methods, organic residues were identiied, indicating that
higher heat treatment temperatures would be adequate to
eliminate these residues since they inluence the photocatalysis by competing with active sites on the surface of the materials.
TiO2 SG was outstanding in the photocatalytic tests
due to the greater degradation of the RhB dye. TiO2 PP,
even having a larger surface area and smaller particle size,
provided lower degradation and photocatalytic activity due
to the presence of organic residues on its surfaces.
Table 3. Values of k', R2, and t
1/2 of the samples under UV-C irradiation.
Sample UV-C irradiation k' (min-1) R2 t
1/2 (min)
ZnO SG 1.19.10-2 0.985 58
ZnO PP 1.23.10-2 0.988 56
TiO2 SG 1.23.10-2 0.998 56
TiO2 PP 8.4.10
5. Acknowledgments
The authors gratefully acknowledge the Brazilian research funding programs and agencies CNPq (proc. 444117/2014-8), CAPES, and FAPEMIG for their inancial backing. We are also grateful to the Federal University of Alfenas and Embrapa Instrumentação Agropecuária, São Carlos.
6. References
1. Lončarević D, Dostanić J, Radonjić V, Živković L, Jovanović DM.
Simultaneous photodegradation of two textile dyes using TiO2
as a catalyst. Reaction Kinetics, Mechanisms and Catalysis.
2016;118(1):153-164. DOI: 10.1007/s11144-016-0990-0
2. Li Y, Zhang WP, Li X, Yu Y. TiO2 nanoparticles with high ability
for selective adsorption and photodegradation of textile dyes
under visible light by feasible preparation. Journal of Physics
and Chemistry of Solids. 2014;75(1):86-93. DOI: 10.1016/j.
jpcs.2013.08.012
3. Kaur J, Kumar V, Gupta K, Bansal S, Singhal S. A facile strategy for the degradation of recalcitrant textile dyes using highly
robust ZnO catalyst. Journal of Chemical Technology and
Biotechnology. 2016;91(8):2263-2275. DOI: 10.1002/jctb.4812
4. Bhatia S, Verma N, Bedi RK. Optical application of Er-doped ZnO nanoparticles for photodegradation of direct red - 31
dye. Optical Materials. 2016;62:392-398. DOI: 10.1016/j.
optmat.2016.10.013
5. Brites FF, Santana VS, Fernandes-Machado NRC. Efect of Support on the Photocatalytic Degradation of Textile Eluents
Using Nb2O5 and ZnO: Photocatalytic Degradation of Textile
Dye. Topics in Catalysis. 2011;54(1):264-269. DOI: 10.1007/
s11244-011-9657-2
6. Prado AGS, Bolzon LB, Pedroso CP, Moura AO, Costa LL. Nb2O5
as eicient and recyclable photocatalyst for indigo carmine
degradation. Applied Catalysis B: Environmental.
2008;82(3-4):219-224. DOI: 10.1016/j.apcatb.2008.01.024
7. Xu H, Zhang Y, Jiang Q, Reddy N, Yang Y. Biodegradable hollow zein nanoparticles for removal of reactive dyes from wastewater.
Journal of Environmental Management. 2013;125:33-40. DOI:
10.1016/j.jenvman.2013.03.050
8. Carneiro PA, Osugi ME, Sene JJ, Anderson MA, Zanoni MVB. Evaluation of color removal and degradation of a reactive
textile azo dye on nanoporous TiO2 thin-ilm electrodes.
Electrochimica Acta. 2004;49(22-23):3807-3820. DOI: 10.1016/j.
electacta.2003.12.057
9. Gupta VK, Ali I, Saleh TA, Nayak A, Agarwal S. Chemical Treatment Technologies for Waste-Water Recycling - An
Overview. ChemInform. 2012;43(45):6380-6388. DOI: 10.1002/
chin.201245270
10. Alzahrani E. Zinc Oxide Nanopowders Prepared by the Sol-Gel Process for the Eicient Photodegradation of Methyl Orange.
Current Analytical Chemistry. 2016;12(5):465-475. DOI: 10.
2174/1573412912666160104234348
11. Tolosana-Moranchel A, Casas JA, Carbajo J, Faraldos M,
Bahamonde A. Inluence of TiO2 optical parameters in a slurry
photocatalytic reactor: Kinetic modelling. Applied Catalysis
B: Environmental. 2016;200:164-173. DOI: 10.1016/j.
apcatb.2016.06.063
12. Paszkiewicz M, Luczak J, Lisowski W, Patyk P, Zaleska-Medynska
A. The ILs-assisted solvothermal synthesis of TiO2 spheres:
The efect of ionic liquids on morphology and photoactivity of
TiO2. Applied Catalysis B: Environmental. 2016;184:223-237.
DOI: 10.1016/j.apcatb.2015.11.019
13. Savastenko NA, Filatov II, Lyushkevich VA, Chubrik NI, Gabdullin MT, Ramazanov TS, et al. Enhancement of ZnO-Based Photocatalyst Activity by RF Discharge-Plasma Treatment*.
Journal of Applied Spectroscopy. 2016;83(5):757-763. DOI:
10.1007/s10812-016-0359-1
14. Kaur J, Bhukal S, Gupta K, Tripathy M, Bansal S, Singhal S.
Nanocomposite of CeO2 and ZnO: An active material for the
treatment of contaminated water. Materials Chemistry and Physics.
2016;177:512-520. DOI: 10.1016/j.matchemphys.2016.04.063
15. Rahman QI, Ahmad M, Misra SK, Lohani M. Efective photocatalytic
degradation of rhodamine B dye by ZnO nanoparticles. Materials
Letters. 2013;91:170-174. DOI: 10.1016/j.matlet.2012.09.044
16. Carneiro JO, Samantilleke AP, Parpot P, Fernandes F, Pastor M, Correia A, et al. Visible Light Induced Enhanced Photocatalytic Degradation of Industrial Eluents (Rhodamine B) in Aqueous
Media Using TiO2 Nanoparticles. Journal of Nanomaterials.
2016;2016:4396175. DOI: 10.1155/2016/4396175
17. Torbr̈gge S, Ostendorf F, Reichling M. Stabilization of Zinc-Terminated ZnO(0001) by a Modiied Surface Stoichiometry.
Journal of Physical Chemistry C. 2009;113(12):4909-4914.
DOI: 10.1021/jp804026v
18. Wang L, Chang L, Zhao B, Yuan Z, Shao G, Zheng W. Systematic Investigation on Morphologies, Forming Mechanism, Photocatalytic and Photoluminescent Properties
of ZnO Nanostructures Constructed in Ionic Liquids. Inorganic
Chemistry. 2008;47(5):1443-1452. DOI: 10.1021/ic701094a
19. Perez-Lopez OW, Farias AC, Marcilio NR, Bueno JMC. The catalytic behavior of zinc oxide prepared from various precursors and by diferent methods. Materials Research Bulletin.
2005;40(12):2089-2099. DOI: 10.1016/j.materresbull.2005.07.001
20. Cao LX, Spiess FJ, Huang AM, Suib SL, Obee TN, Hay SO, et al. Heterogeneous Photocatalytic Oxidation of 1-Butene on SnO2 and TiO2 Films. The Journal of Physical Chemistry B.
1999;103(15):2912-2917. DOI: 10.1021/jp983860z
21. Amorim C, Keane MA. Efect of surface acid groups associated
with amorphous and structured carbon on the catalytic
hydrodechlorination of chlorobenzenes. Journal of Chemical
Technology & Biotechnology. 2008;83(5):662-672. DOI:
10.1002/jctb.1846
22. Xiong G, Wang X, Lu L, Yang X, Xu Y. Preparation and Characterization of Al2O3–TiO2 Composite Oxide Nanocrystals. Journal of Solid State Chemistry. 1998;141(1):70-77. DOI:
23. McLaren A, Valdes-Solis T, Li G, Tsang SC. Shape and Size
Efects of ZnO Nanocrystals on Photocatalytic Activity. Journal
of the American Chemical Society. 2009;131(35):12540-12541.
DOI: 10.1021/ja9052703
24. Han S, Choi S, Kim SS, Cho M, Jang B, Kim DY, et al.
Low-Temperature Synthesis of Highly Crystalline TiO2 Nanocrystals
and their Application to Photocatalysis. Small.
2005;1(8-9):812-816. DOI: 10.1002/smll.200400142
25. Xie RC, Shang JK. Morphological control in solvothermal
synthesis of titanium oxide. Journal of Materials Science.
2007;42(16):6583-6589. DOI: 10.1007/s10853-007-1506-0 26. Yu J, Yu X. Hydrothermal Synthesis and Photocatalytic Activity
of Zinc Oxide Hollow Spheres. Environmental Science &
Technology. 2008;42(13):4902-4907. DOI: 10.1021/es800036n
27. Zeng JH, Jin BB, Wang YF. Facet enhanced photocatalytic efect with uniform single-crystalline zinc oxide nanodisks.
Chemical Physics Letters. 2009;472(1-3):90-95. DOI: 10.1016/j.
cplett.2009.02.082
28. Bahnemann DW, Kormann C, Hofmann MR. Preparation and characterization of quantum size zinc oxide: a detailed
spectroscopic study. The Journal of Physical Chemistry.
1987;91(14):3789-3798. DOI: 10.1021/j100298a015
29. Rodrı́guez-Paéz JE, Caballero AC, Villegas M, Moure C, Durán P, Fernández JF. Controlled precipitation methods: formation
mechanism of ZnO nanoparticles. Journal of the European
Ceramic Society. 2001;21(7):925-930. DOI:
10.1016/S0955-2219(00)00283-1
30. Rietveld HM. Line proiles of neutron powder-difraction peaks
for structure reinement. Acta Crystallographica.
1967;22:151-152. DOI: 10.1107/S0365110X67000234
31. Williamson GK, Hall WH. X-ray line broadening from iled
aluminum and wolfram. Acta Metallurgica. 1953;1(1):22-31.
DOI: 10.1016/0001-6160(53)90006-6
32. Toby BH. R factors in Rietveld analysis: How good is good
enough? Powder Diffraction. 2006;21(01):67-70. DOI:
10.1154/1.2179804
33. Lu K, Manjooran N, Radovic M, Pickrell G, Medvedovski E, Olevski E, et al. Advances in nanomaterials and nanostructures.
Hoboken: Wiley; 2011. 206 p.
34. Akbari B, Tavandashti MP, Zandrahimi M. Particle size characterization of nanoparticles – a practical approach. Iranian Journal of Materials Science & Engineering. 2011;8(2):48-56.
35. Nascimento GS, Mambrini GP, Paris EC, Peres JA, Colnago LA, Ribeiro C. Evaluation of the catalytic activity of oxide nanoparticles synthesized by the polymeric precursor method
on biodiesel production. Journal of Materials Research.
2012;27(23):3020-3026. DOI: 10.1557/jmr.2012.349
36. Azam A, Ahmed F, Arshi N, Chaman M, Naqvi AH. Formation and characterization of ZnO nanopowder synthesized by sol–gel
method. Journal of Alloys and Compounds.
2010;496(1-2):399-402. DOI: 10.1016/j.jallcom.2010.02.028
37. Arshad M, Azam A, Ahmed AS, Mollah S, Naqvi AH. Efect of Co substitution on the structural and optical properties of ZnO
nanoparticles synthesized by sol–gel route. Journal of Alloys
and Compounds. 2011;509(33):8378-8381. DOI: 10.1016/j.
jallcom.2011.05.047
38. Guo BL, Han P, Guo LC, Cao YQ, Li AD, Kong JZ, et al. The Antibacterial Activity of Ta-doped ZnO Nanoparticles.
Nanoscale Research Letters. 2015;10:336. DOI: 10.1186/
s11671-015-1047-4
39. Bahadur N, Jain K, Pasricha R, Govind, Chand S. Selective gas sensing response from diferent loading of Ag in sol–gel
mesoporous titania powders. Sensors and Actuators B: Chemical.
2011;159(1):112-120. DOI: 10.1016/j.snb.2011.06.058
40. Vargas MA, Franco Y, Ochoa Y, Ortegón Y, Rodriguez Paez
JE. TiO2 sintetizado por el método de precursor polimerico
(Pechini): estructura de la resina intermedia. Boletín de la
Sociedad Española de Cerámica y Vidrio. 2011;50(5):267-272.
DOI: 10.3989/cyv.352011
41. Giraldi TR, Santos GV, Mendonça VR, Ribeiro C, Weber IT. Annealing Efects on the Photocatalytic Activity of ZnO
Nanoparticles. Journal of Nanoscience and Nanotechnology.
2011;11(4):3635-3640. DOI: 10.1166/jnn.2011.3801
42. Costa ACFM, Vilar MA, Lira HL, Kiminami RHGA, Gama L. Síntese e caracterização de nanopartículas de TiO2. Cerâmica.
2006;52(324):255-259. DOI: 10.1590/s0366-69132006000400007 43. Giraldi TR, Santos GVF, de Mendonca VR, Ribeiro C,
Weber IT. Efect of synthesis parameters on the structural
characteristics and photocatalytic activity of ZnO. Materials
Chemistry and Physics. 2012;136(2-3):505-511. DOI: 10.1016/j.
matchemphys.2012.07.018
44. Wang L, Li J, Wang Y, Zhao L, Jiang Q. Adsorption capability
for Congo red on nanocrystalline MFe2O4 (M=Mn, Fe, Co,
Ni) spinel ferrites. Chemical Engineering Journal.