Corruption, income, and rule of law:
empirical evidence from developing
and developed economies
HELDER FERREIRA DE MENDONÇA ANDRÉ OLIVEIRA DA FONSECA*
This article presents an empirical analysis based on cross-country data con-cerned with two points regarding corruption: (i) its effects on income; and (ii) how to mitigate corruption. The indings can be highlighted in two points. Firstly the idea that corruption is intrinsically connected with income is conirmed. Secondly, the traditional argument that an increase in rule of law represents a good strategy in the ight against corruption is valid for developing countries. Furthermore, this study reveals that the search for increasing the human development index represents a rule of thumb for high levels of income and to control corruption.
Keywords: corruption; rule of law; human development index; income; develop-ing countries; developed countries.
JEL Classiication: N. D73.
INTRODUCTION
In the last years the empirical analysis regarding the effects of corruption on economic performance gained the attention of several researchers. The main argu-ment is that corruption is a symptom of institutional weakness and thus reduces economic growth (Mauro, 1995). The relevance of the subject is unquestionable, as pointed out by Akçay (2006, p. 32), “corruption is mainly a governance issue and is widespread around the world”. Particularly, the negative effects caused by Brazilian Journal of Political Economy, vol. 32, nº 2 (127), pp. 305-314, April-June/2012
corruption have motivated studies for identifying elements that can avoid them. In brief, nowadays there are two fronts that cannot be neglected when the literature regarding corruption is considered: (i) the effects of corruption on income; and (ii) how to mitigate corruption.
This article is concerned with the two above-mentioned points and makes a contribution to the literature through an empirical analysis based on a sample of 80 countries for the average of the period 1995 to 2004 (see Appendix – Table A.1). In a manner different from the usual found in the empirical literature regarding corruption, besides the analysis for the total sample, developed and developing countries are considered separately with the objective of capturing some particu-larities inherit to these group of countries1.
CORRUPTION AND INCOME
According to Svensson (2005), there exists a strong relationship between cor-ruption and income. With the objective of attesting this relation, the correlation between real gross domestic product per capita (GDP) available from PWT 6.2 and the corruption perceptions index (CPI) disclosed by Transparency International (the index varies between zero — highest corruption — and 10 — lowest corruption) was made. The simple regression lines in all scatter plots (see Figure 1) reveals that corruption is strongly correlated with GDP for both developed and developing countries, 0.58 and 0.63, respectively.
Due to the fact that the correlations in Figure 1 do not permit to assure the existence of a causality relation among variables, the use of another methodology is necessary. The method applied for this evaluation is a cross-country analysis (Ordinary Least Squares – OLS). Furthermore, in order to investigate the relevance of corruption for GDP, the following independent variables which are tradition-ally used in empirical analysis regarding economic growth are considered in the estimation2:
1 The division is made taking into consideration the classification made by the International Monetary
Fund (IMF).
2 Except for HDI (2004), the time span for the variables under estimation is the same (average 1995 to
Figure 1: Corruption and income 6.5 7.0 7.5 8.0 8.5 9.0 9.5 10.0
1 2 3 4 5 6 7 8 corruption re al G D P p er c ap ita (i n lo gs ) Developing countries 6 7 8 9 10 11
1 2 3 4 5 6 7 8 9 10 corruption re al G D P p er c ap ita (i n lo gs ) Total sample 9.4 9.6 9.8 10.0 10.2 10.4 10.6 10.8
4 5 6 7 8 9 10
corruption re al G D P p er c ap ita (i n lo gs ) Developed countries
(i) Government share GDP (GOV) — data from PWT 6.2 — this variable re-veals the participation of the government in an economy. A high participation of the government denotes a low incentive for private investments and thus may contribute to a lower GDP.
(ii) Trade openness (OPEN) — exports plus imports divided by GDP — data gathered from PWT 6.2 — this variable captures the idea that an economy with great openness has the advantage of increasing the volume of commerce, which in turn, is capable of promoting an increase in country income.
(iii) Inflation (INF) — measured by Consumer Price Index — this information is collected from International Financial Statistics — IMF. The justification for the use of this variable is that inflation corrodes the purchasing power of economic agents which cannot be protected from the effects caused by inflation tax. Moreover, the use of high interest rates for reducing inflation implies a credit constraint which in turn has the potential for decreasing the economic activity. On the other hand, taking into consideration the trade-off present in the traditional Phillips curve, an increase in inflation promotes an increase in output.
Therefore the relationship between corruption and GDP is estimated using the following regression equation:
(1) lnGDPi = a0 + a1CPI + a2GOV + a3OPEN + a4INF + a5HDI +ei, ei ~ N(0,s2)
where i indexes the countries in the sample.
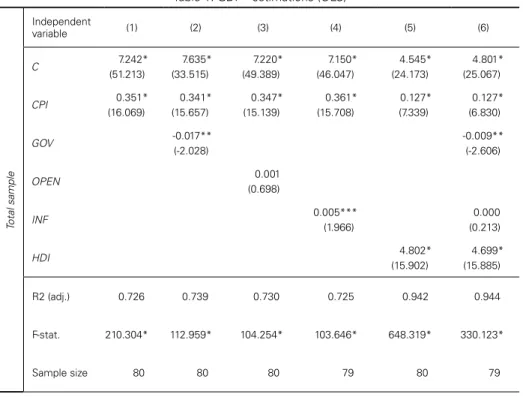
The regression outcomes are reported in Table 13. The outcomes denote that
there is no doubt regarding the relevance of corruption for real gross domestic product per capita. In all specifications and samples CPI has a strong statistical significance. Notwithstanding, the magnitude of the coefficient is quite different when developing and developed countries are considered in distinct samples. The coefficient is considerably greater in the case of developing countries than developed countries. Hence, an improvement in CPI has the power of promoting a positive effect on income per capita in developing countries greater than developed countries.
Table 1: GDP - estimations (OLS)
Tot
al sample
Independent
variable (1) (2) (3) (4) (5) (6)
C 7.242*
(51.213)
7.635* (33.515)
7.220* (49.389)
7.150* (46.047)
4.545* (24.173)
4.801* (25.067)
CPI 0.351*
(16.069)
0.341* (15.657)
0.347* (15.139)
0.361* (15.708)
0.127* (7.339)
0.127* (6.830)
GOV -0.017**
(-2.028)
-0.009** (-2.606)
OPEN 0.001
(0.698)
INF 0.005***
(1.966)
0.000 (0.213)
HDI 4.802*
(15.902)
4.699* (15.885)
R2 (adj.) 0.726 0.739 0.730 0.725 0.942 0.944
F-stat. 210.304* 112.959* 104.254* 103.646* 648.319* 330.123*
Sample size 80 80 80 79 80 79
De
v
eloping countries
C 7.075*
(32.383) 7.303* (28.659) 7.044* (31.844) 6.949* (31.139) 4.721* (23.107) 4.869* (22.208)
CPI 0.383*
(7.042) 0.400* (6.494) 0.368* (6.276) 0.391* (7.318) 0.135* (3.363) 0.152* (3.466)
GOV -0.013
(-1.266)
-0.007 (-1.557)
OPEN 0.001
(0.658)
INF 0.007**
(2.377)
0.001 (0.908)
HDI 4.486*
(12.612)
4.378* (11.720)
R2 (adj.) 0.388 0.397 0.378 0.406 0.867 0.864
F-stat. 33.938* 18.183* 16.830* 18.404* 170.137* 82.018*
Sample size. 53 53 53 52 53 52
De
v
eloped countries
C 9.441*
(49.452) 9.643* (44.149) 9.431* (48.999) 9.766* (64.741) 4.450** (2.298) 4.870* (3.699)
CPI 0.084*
(3.460) 0.092* (3.579) 0.076* (3.236) 0.062* (3.190) 0.058** (2.429) 0.053* (2.561)
GOV -0.016*
(-2.878)
-0.014** (-2.089)
OPEN 0.001
(1.351)
INF -0.069*
(-3.805)
-0.039 (-1.345)
HDI 5.520**
(2.569)
5.445* (3.632)
R2 (adj.) 0.310 0.430 0.354 0.725 0.387 0.533
F-stat. 12.666* 10.819* 8.134* 103.646* 9.196* 8.426*
Sample size 27 27 27 27 27 27
Note: White (1980) t-statistic between brackets. Asterisks denote significance at the 1% (*), 5% (**) and 10% (***) levels, respectively.
There is also observed a distinct behavior when the variable GOV is present in the estimations. Although the sign of the variable is negative for both cases, for developed countries it has statistical significance, while for developing countries it has not. This result agrees with the idea that limited government in the wealth is an appropriate strategy for developed countries. Another considerable difference between the groups of countries is regarding inflation. In spite of the non-statistical significance in specification (6) for both cases, the sign of the coefficient is contrary between them. While for developing countries it is positive, for developed countries it is negative. In other words, there is a possible inflation-output trade-off in the case of developing economies.
As expected, an improvement of the living conditions is crucial for promoting an increase in income.
RULE OF LAW AND CORRUPTION
The analysis concerning corruption is intrinsically related with rule of law. The perspective that a weak rule of law implies a high level of corruption is supported since Leff (1964) and Huntington (1968). Nowadays, the World Bank considers rule of law one important dimension of governance in the control of corruption. In brief, the idea is that in the countries with a high rule of law ensure that no one is above the law and thus the corruption may decrease. Hence, based on the same framework and period used for analyzing the relation between corruption and income in the previous section, an analysis of the effect of rule of law on corruption is realized.
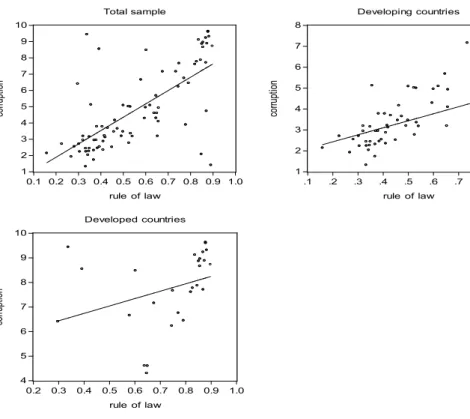
Based on the corruption perceptions index and the indicator of rule of law (RL), gathered from Worldwide Governance Indicators (World Bank), scatter plots for total sample, developed countries, and developing countries were made (see Figure 2). The results confirm the argument that there exists a positive correlation between RL and CPI for both developed (0.33) and developing countries (0.46). In other words, a higher level of rule of law is associated with a lower level of corruption.
Figure 2: Rule of law and corruption
4 5 6 7 8 9 10
0.2 0.3 0.4 0.5 0.6 0.7 0.8 0.9 1.0 rule of law
co
rru
pt
io
n
Developed countries 1
2 3 4 5 6 7 8 9 10
0.1 0.2 0.3 0.4 0.5 0.6 0.7 0.8 0.9 1.0 rule of law
co
rru
pt
io
n
Total sample
1 2 3 4 5 6 7 8
.1 .2 .3 .4 .5 .6 .7 .8 .9 rule of law
co
rru
pt
io
n
With the objective of estimating the impact of RL on CPI, the following vari-ables were also considered in the estimations4:
(i) Gini index 2004 (GINI) — available from the Central Intelligence Agency World Factbook. GINI is a measure of inequality of income distribution. The index varies between zero (everyone having exactly the same income) and 1 (where one person has all the income, while everyone else has zero income). The justification for the use of this variable in this study is based on the argument that a high in-equality may discourage certain basic norms of behavior among economic agents such as trust and commitment.
GOV —The use of this variable is connected with the occurrence of corrup-tion. As pointed out by Rose-Ackerman (1997, p. 31), “corruption occurs at the interface of the public and private sectors. Whenever a public official has discretion-ary power over distribution to the private sector of a benefit or cost, incentives for bribery are created. Thus corruption depends upon the magnitude of the benefits and costs under the control of public officials”.
INF — In a general way, countries that have very high rates of inflation typi-cally have weak institutions (Poole, 2007). As a consequence, there exists an inad-equate environment for efficient governance.
HDI — According to the United Nations Human Settlements Programme, generally, higher levels of human development are associated with lower levels of corruption.
Hence, the relationship between rule of law and corruption is estimated taking into account the equation:
(2) CPIi = b0 + b1RL + b2GINI + b3GOV + b4INF + b5HDI +ei,ei ~ N(0,s2)
where i indexes the countries in the sample.
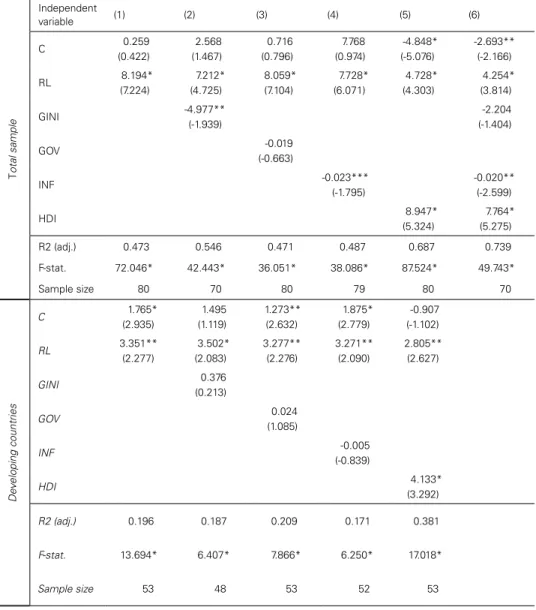
The regression outcomes are reported in Table 2 and denote that rule of law is an important variable for controlling corruption when total sample and develop-ing countries are considered. Therefore, an increase in rule of law for the case of emerging countries represents a powerful instrument for inhibiting corruption. The absence of statistical significance for developed countries is justified due to the fact that the rule of law in these countries is already high. Notwithstanding, such as present in the other samples, the sign of the coefficient regarding RL is also positive. Based on the outcomes in Table 2, it is observed that HDI is a very important variable in the estimations for corruption in all samples. The outcome is consonant with the argument of the United Nations that higher levels of human development are crucial in the fight against corruption. On the other hand, the GOV is not sig-nificant in any case. As a consequence the participation of the government in an economy is not relevant to explaining corruption.
4 The definition of GOV, INF, and HDI, as well as, the source of data are defined in the previous
Table 2: Corruption – estimations (OLS)
T
ot
al sample
Independent
variable (1) (2) (3) (4) (5) (6)
C 0.259
(0.422)
2.568 (1.467)
0.716 (0.796)
7.768 (0.974)
-4.848* (-5.076)
-2.693** (-2.166)
RL 8.194*
(7.224)
7.212* (4.725)
8.059* (7.104)
7.728* (6.071)
4.728* (4.303)
4.254* (3.814)
GINI -4.977**
(-1.939)
-2.204 (-1.404)
GOV -0.019
(-0.663)
INF -0.023***
(-1.795)
-0.020** (-2.599)
HDI 8.947*
(5.324)
7.764* (5.275)
R2 (adj.) 0.473 0.546 0.471 0.487 0.687 0.739
F-stat. 72.046* 42.443* 36.051* 38.086* 87.524* 49.743*
Sample size 80 70 80 79 80 70
De
v
eloping countries
C 1.765*
(2.935)
1.495 (1.119)
1.273** (2.632)
1.875* (2.779)
-0.907 (-1.102)
RL 3.351**
(2.277)
3.502* (2.083)
3.277** (2.276)
3.271** (2.090)
2.805** (2.627)
GINI 0.376
(0.213)
GOV 0.024
(1.085)
INF -0.005
(-0.839)
HDI 4.133*
(3.292)
R2 (adj.) 0.196 0.187 0.209 0.171 0.381
F-stat. 13.694* 6.407* 7.866* 6.250* 17.018*
De
v
eloped countries
C 5.538*
(3.370)
3.832 (1.541)
4.398** (2.119)
7.267* (3.817)
-37.692 (-1.554)
-29.878 (-1.526)
RL 3.008
(1.501)
5.007** (2.101)
0.076 (1.558)
2.223 (1.119)
0.880 (0.373)
0.538 (0.233)
GINI -0.228
(-0.041)
GOV 0.060
(1.269)
INF -0.514***
(-1.834)
-0.429 (-1.561)
HDI 47.640***
(1.762)
40.621*** (1.838)
R2 (adj.) 0.074 0.180 0.077 0.180 0.194 0.261
F-stat. 3.081*** 3.298*** 2.084 3.860** 4.123** 4.055**
Sample size 27 22 27 27 27 27
Note: White (1980) t-statistic between brackets. Asterisks denote significance at the 1% (*), 5% (**) and 10% (***) levels, respectively.
Although the literature regarding corruption highlights the relevance of Gini index in the empirical analysis (see Dincer and Gunalp, 2008), the outcome in the estimations cannot be considered unmistakable. The statistical significance is ob-served only for total sample and the sign of the coefficient is different for developed and developing economies. Taking into account the result for total sample, a wors-ening in the income distribution implies an increase in the corruption.
In relation to the effects of inflation on corruption, the analysis indicates that this variable is not significant for developing countries. In spite of this, when total sample and developed countries are considered the effect cannot be neglected. In a general perspective, an increase in inflation contributes to an increase in corruption. As a consequence, it is possible that the use of strategies for controlling inflation, such as the adoption of central bank independence and inflation targeting can be useful for avoiding corruption.
CONCLUSION
REFERENCES
AKÇAy, S. (2006) “Corruption and human development.” Cato Journal 26(1), pp. 29-46.
DINCER, O.C. and GUNALP, B. (2008) “Corruption, Income, Inequality, and Poverty in the United States”, Working Papers 2008.54, Fondazione Eni Enrico Mattei.
HUNTINGTON, S.P. (1968) Political Order in Changing Societies, New Haven: yale University Press. LEFF, N. H. (1964) “Economic development through bureaucratic corruption.” American Behavioral
Scientist, 82(2), pp. 337-41.
MAURO, P. (1995) “Corruption and rowth.” Quarterly Journal of Economics, 110(3), pp. 681-712. POOLE, W. (2007) “Inlation, inancial stability and economic growth,” Speech, Federal Reserve Bank
of St. Louis.
ROSE-ACKERMAN, S. (1997) “The political economy of corruption.” In K.A. Elliot (ed.) Corruption and the Global Economy, pp. 31-60. Washington: Institute for International Economics. SVENSSON, J. (2005) “Eight questions about corruption.” Journal of Economic Perspectives, 19(3),
pp. 19-42.
WHITE, H. (1980) “A heteroskedasticity-consistent covariance matrix estimator and a direct test for heteroskedasticity”. Econometrica, 48(4), pp. 817-838.
APPENDIX
Table A.1 Countries
Albania, Argentina, Australia, Austria, Bangladesh, Belgium, Bolivia, Brazil, Bulgaria, Canada,
Cameroon, Chile, China, Colombia, Costa Rica, Czech Republic, Denmark, Dominican
Republic, Ecuador, Egypt, El Salvador, Estonia, Finland, France, Germany, Ghana, Greece,
Guatemala, Honduras, Hong Kong, Hungary, Iceland, India, Indonesia, Iran, Iraq, Ireland,
Israel, Italy, Jamaica, Japan, Jordan, Kenya, Korea (South), Luxembourg, Malaysia, Mexico,
Morocco, Namibia, Netherlands, Nicaragua, Niger, Norway, New Zealand, Pakistan, Paraguay,
Peru, Philippines, Poland, Portugal, Romania, Russian Federation, Senegal, Singapore, South
Africa, Spain, Sweden, Switzerland, Thailand, Tanzania, Tunisia, Turkey, Uganda, Ukraine,