A Study on Out-of-Phase Current Pulses of the Double Wire MIG/MAG Process with ...
J. of the Braz. Soc. of Mech. Sci. & Eng. Copyright 2007 by ABCM April-June 2007, Vol. XXIX, No. 2 / 207
Marcelo F. Motta
[email protected] Federal University of Ceará - UFC Materials and Metallurgical Eng. Department 60455-760 Fortaleza, CE. Brazil.
Jair Carlos Dutra
[email protected]Raul Gohr Jr
[email protected] Federal University of Santa Catarina - UFSC Mechanical Engineering Department 88040-900 Florianópolis, SC. BrazilAmérico Scotti
Member, ABCM[email protected] Federal University of Uberlândia - UFU Faculty of Mechanical Engineering 38400-902 Uberlândia, MG. Brazil
A Study on Out-of-Phase Current
Pulses of the Double Wire MIG/MAG
Process with Insulated Potentials on
Coating Applications – Part II
This paper presents a continuation of a study carried out on the use of the out-of-phase current pulses technology applied to the Double Wire MIG/MAG welding process with Insulated Potentials on welded coatings. In the first part it was reported how the level of out-phase pulsed current acts on arc configuration, droplet paths, bead finishing and arc stability. The objective now is to show the effect on the bead geometry caused by changes in arc and metal transfer. Beads were deposited on plate in a flat position and out-of-phase levels were varied. The results showed that, with the electrodes positioned side by side and mean currents below the transition current, the lag time between out-of-phase current pulses have a remarkable influence on the penetration profile of the weld bead.
Keywords: welding, MIG/MAG; double wire; out-of-phase pulsed current
Introduction
A study conducted in part 1 of this work (MOTTA et al., 2006) verified the effects caused by out-of-phase current pulses on the arcs and, consequently, on metal transfer. Amongst others, it was concluded that: a) for levels of mean welding current below the transition current, the lag time between current pulses reduces the arc deviations, as expected; and b) the drops transferred from the electrodes to the melting pool also deviate from their paths, in conformity with the deviations of the voltaic arcs.1
The weld penetration in the MIG/MAG process is directly related to the arc pressure on the welding pool, since this pressure displaces the liquid metal, opening a channel, which improves the transfer of heat to the base metal. This pressure is a direct result of the jet of plasma gas, along with the axial component of the Lorentz force on the welding pool. Some authors believe that the momentum transfer from the drops that collide on the welding surface also directly influences the penetration of the MIG/MAG welds (LANCASTER, 1986, ESSERS & WALTER, 1981). Matsuwana & Nishiguchi (1980) attribute to this effect the finger penetration of the deposits. These authors’ works showed that both the action of the arc and the impact of the drops could influence the penetration in MIG/MAG welding. The results of Part 1 of this study showed that the point where the arc and metal drops reach the weld pool can be altered with the out-of-phase current pulses and, consequently, it is expected that the weld penetration profile can be also altered.
Thus, the second part of the work is aimed to study the effects that the out-of-phase current pulses can have upon the geometric profile of weld beads.
Nomenclature
Ar = argon
CO2 = carbon dioxide
Paper accepted December, 2006. Technical Editor: Anselmo Eduardo Diniz.
DC = direct current Ib = background current, A Im = mean current, A Ip = pulse current, A lt = lag time, ms
MIG/MAG = Metal Inert Gas/Metal Active Gas tb = background time, ms
tp = pulse time, ms
TS = welding travel speed, cm/min WFS = wire feed speed, m/min R = bead reinforcement, mm L = bead width, mm ICV = convexity index, mm,
Plm = mean penetration in the bead sides, mm PC = penetration in the center of the weld bead, mm Pp = penetration profile
ANOVA = analyses of variance P1 = penetration 1, mm P2 = penetration 2, mm Greek Symbols
= level of significance
Experimental Procedure
Effect of the Arc Deviation on the Weld Bead Geometric Characteristics
Marcelo F. Motta et al
/ Vol. XXIX, No. 2, April-June 2007 ABCM
208
Figure 1. Schematic oscilograms of the welding current signal imposed by the two power sources, where lt = lag time between pulses and tp = pulse duration: a) Out-of-phase current pulses, in which lt > tp; b) Out-of-phase current pulses, in which lt < tp; c) In phase current pulses, i.e., lt = 0 ms.
The deposits were made in the flat position on plain carbon steel plates (SAE/AISI 1010 - DIN St 34), cut in the dimensions of 12.5 x
100 x 200 mm. This test plate dimensions allowed testing two
conditions on each plate. The two electrodes were positioned one beside the other in relation to the welding direction (“side by side”).
The electrodes used were 1.0-mm-diameter AWS ER70S-6 class and
the distance between contact-tip and the surface plate was 16 mm. A shielding mixture with 96% of Ar and 4% of CO2 was used at a flow
of 10 l/min in each torch. Table 1 presents the sequence of
experiments made, in which columns 4 and 5 introduce the wire feed speeds set in order to result in arc lengths of approximately 5 mm(2) for the given parameter combinations. In this stage, travel speed was varied in each experiment to maintain the same volume of material deposited per unit of time for each tested condition. By following this procedure, it is believed that all trials received a similar heat input and, therefore, deposits, welded with different levels of mean current, could be compared.
The geometric characteristics of the weld bead profile, considered as dependent variables, were: convexity index (ICV); mean penetration in the bead sides (Plm); penetration in the center of the weld bead (PC); and penetration profile (Pp) (Fig. 2). Two samples of the cross sections of each weld bead were prepared metalographically for the measurements.
Table 1. Welding conditions.
WFS (m/min) Im/wire (A) lt (ms) TS (cm/min)
Wire 1 Wire 2
80 10.2 32 3.3 3.3
120 2.0 50 5.2 5.4
160 0.0 70 7.1 7.5
120 0.0 50 5.2 5.5
80 2.0 32 3.2 3.3
160 5.5 70 7.1 7.4
160 2.0 70 7.2 7.4
80 0.0 32 3.3 3.3
120 7.8 50 5.2 5.4
80 10.2 32 3.3 3.3
120 2.0 50 5.2 5.5
160 0.0 70 7.1 7.5
120 0.0 50 5.1 5.3
80 2.0 32 3.2 3.3
160 5.5 70 7.1 7.4
160 2.0 70 7.2 7.4
80 0.0 32 3.3 3.4
120 7.8 50 5.2 5.4
(2) Different melting rates between the wires were observed in all welding
done in this work. It was suspected that a small difference of electric resistance among electrodes, due to a dimensional difference of the wires diameters, caused the different melting rates. A specific study was accomplished on the subject and the results indicated that small differences in the wire diameters resulted in differences of up to 4% in the melting rate (NETO et al., 2002).
.
ICV = R/L;
Plm = (P1+P2)/2;
Pp = Plm/PC
Figure 2. Schematic representation of the geometric profile of a weld bead.
Results and Discussions
Effects of the arc deviation on the weld bead geometric characteristics
Columns 3 to 6 of Table 2 present the measured values of the geometric characteristics of the weld beads. Analysis of Variance (ANOVA) were applied to these values to verify if the experimental factors (current lag time and mean current) would have effects on the geometric profile of the weld beads (Table 3). Levels of Significance ( ) lower than 0,05 (underlined values) indicate statistically significant effects, i.e., there is a probability of error lower than 5% in admitting that the factors and/or their interaction are influencing the dependent variables analyzed.
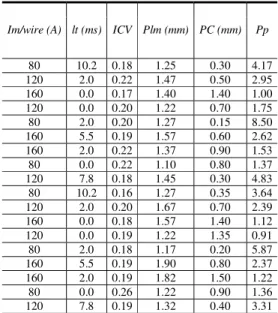
Table 2. Measured values of the weld bead profiles (mean of two samples).
Im/wire (A) lt (ms) ICV Plm (mm) PC (mm) Pp
80 10.2 0.18 1.25 0.30 4.17
120 2.0 0.22 1.47 0.50 2.95
160 0.0 0.17 1.40 1.40 1.00
120 0.0 0.20 1.22 0.70 1.75
80 2.0 0.20 1.27 0.15 8.50
160 5.5 0.19 1.57 0.60 2.62
160 2.0 0.22 1.37 0.90 1.53
80 0.0 0.22 1.10 0.80 1.37
120 7.8 0.18 1.45 0.30 4.83
80 10.2 0.16 1.27 0.35 3.64
120 2.0 0.20 1.67 0.70 2.39
160 0.0 0.18 1.57 1.40 1.12
120 0.0 0.19 1.22 1.35 0.91
80 2.0 0.18 1.17 0.20 5.87
160 5.5 0.19 1.90 0.80 2.37
160 2.0 0.19 1.82 1.50 1.22
80 0.0 0.26 1.22 0.90 1.36
120 7.8 0.19 1.32 0.40 3.31
Table 3. Levels of significance ( ) of the effects of the factors and interactions on the geometric characteristics.
Effects ICV=R/L Plm PC Pp=Plm/PC
Lag time (lt) 0,042 0,132 0,002 0,0006
Mean current (Im) 0,551 0,005 0,002 0,001
Interaction (lt X Im) 0,012 0,548 0,386 0,003
A Study on Out-of-Phase Current Pulses of the Double Wire MIG/MAG Process with ...
J. of the Braz. Soc. of Mech. Sci. & Eng. Copyright 2007 by ABCM April-June 2007, Vol. XXIX, No. 2 / 209
dependent on the interaction between the cited factors. It is important to point out that the increase of the mean current corresponded to a proportional increase in travel speed in such a way that the volume of material deposited was the same. Thus, it can be expected that the energy imposed on all the parameter combinations is similar and bead welds at different mean current levels can be geometrically compared.
The first geometric aspect to be analyzed is the convexity of the weld bead, assessed by the ICV index (the smaller the index, the smoother the weld bead). The second aspect would be the penetration profile of the weld beads, assessed by the Pp relationship (the closer is to one, the more uniform the penetration profile is). An increase in the Pp ratio implies a tendency to form a profile with double penetration ("double finger"). Finally, penetration itself should be considered, assessed by the Plm = (P1 + P2)/2 index (the larger the Plm, the larger the penetration of the weld bead in their sides). The Pc index indicates the penetration in the center of the weld bead (the larger the Pc, the larger the penetration in the center of the weld bead).
(a)
(b)
(c)
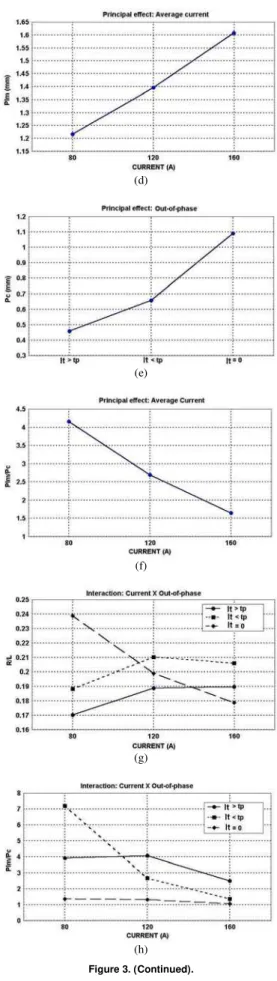
Figure 3. Factor versus responses relationship: a) lag time on the convexity index; b) mean current on the penetration in the center of the weld beads; c) lag time on the penetration profile; d) mean current on the lateral penetration; e) lag time on the penetration in the center of the weld beads; f) mean current on the penetration profile of the weld bead; g) interaction of mean current and lag time on the convexity index; h) interaction of mean current and lag time on the penetration profile of the weld bead.
(d)
(e)
(f)
(g)
(h)
Marcelo F. Motta et al
/ Vol. XXIX, No. 2, April-June 2007 ABCM
210
Generally, it can be affirmed that the current lag time favors the formation of a less convex weld bead (Fig. 3a), but it provides for a less uniform penetration (Fig. 3c), with a smaller penetration in the center of the weld bead (Fig. 3e). These results are coherent with those obtained from the deviations of the arcs and drops in the previous paper (MOTTA, 2006).
For the welding conditions in which lt > tp, arcs and drops that deflected less, which concentrated them on the sides of the weld bead, resulting in smaller penetrations in the center of the weld bead and in wider weld beads. Fig. 3e shows that, the largest penetration in the center of the weld bead is obtained for the condition lt = 0. For this same condition, accentuated deviations of the arc and drops towards the central area of the weld were verified in part 1 of this work. Fig. 3b and 3d show that the variables related to the penetration of the weld bead (Pc and Plm) increase proportionally with the mean current. Fig. 3f shows that the penetration profile tends to be more uniform with the increase of the mean current.
The effects of the interactions of the lag time and mean current on the ICV (R/L) and Pp (Plm/PC) indexes can be seen in Fig. 3g and 3h, respectively. In the lowest level of the mean current factor (80 A/wire), the lag time effect on the indexes is more evident; the welding condition lt > tp results in less convex weld beads (Fig. 3g) and the condition lt < tp is less uniform (Fig. 3h). However, with the increase of the mean current (120 and 160 A/wire), the lag time effect is no longer so evident and the weld beads show indexes of similar smoothness, ranged between 0.18 and 0.21 (Fig. 3g). Accordingly, in higher levels of average current factor (160 A/wire), the resulting weld beads presented profiles of more uniform penetration profile, independently of the lag times (Fig.3h).
The results reached in this work suggest that, even with similar imposed energy, a larger background current increases the penetration. The effect of the interaction between mean current and lag time on the weld bead geometry should be considered, because, if a user wants to apply the double wire in welded coating operations (little penetration and smoother weld bead), he should use low levels of mean current in each arc, as well as short lag time. However, if one wants to weld joints, even with electrodes “side by
side”, he should set higher mean current levels in each arc and lt = 0. This condition provides a weld bead with greater regularity (Plm/Pc near to 1) and greater penetration in the center of the weld bead, although with a greater convexity. It should be pointed out that, as the welds were made as simple deposition on plate (nearer to the coating operation condition), one should use these tendencies with reservation for welding in joints with groove.
Conclusions
For plain carbon steel, with electrodes located “side by side”, with mean current below the transition current and other welding conditions adopted in this work, it can be concluded that:
•The lag time current pulses influence the profile of the weld
penetration. The welding conditions with out-of-phase pulses resulted in characteristics of double penetration in the weld. The condition of the in-phase pulses permitted a higher penetration in the center of the weld, independently of the level of the mean current;
•The lag time is not necessarily beneficial for the formation of
the weld bead, since it leads to double penetration profile, in spite of a smaller convexity. This might be beneficial for welded coating, but may not be for joints with groove
.
References
Lancaster, J. F., 1986, “The Physics of Welding”, Pergamon Press, 2nd edition, IIW/IIS.
Matsunawa, A. & Nishigushi, K., 1980, “Arc Characteristics in High Pressure Argon Atmospheres. International Conference on Arc Physics and Weld Pool Behaviour”, The Welding Institute Cambridge, 1980, pp. 67-77.
Motta, M.F., Dutra, J.C., Gohr Jr., R. & Scotti, A., “A Study on Out-of-Phase Current Pulses of the Double Wire MIG/MAG Process with Insulated Potentials on Coating Applications – Part I” (submitted to publishing).
Neto, A. O; Motta, M. F. & Dutra, J. C., 2002, “Influence of Variations of the Electrode-wire Manufacturing Characteristics, with the same Nominal
diameter, on Fusion Rate”, 57o ABM ANNUAL CONGRESS, ABM, São