Universidade de Aveiro 2014
Departamento de Engenharia de Materiais e Cerâmica
Allu Amarnath Reddy Selantes vítreo e vitrocerâmico à base de
aluminosilicatos alcalino-terrosos para aplicações
funcionais
Alkaline-earth aluminosilicate-based glass and
glass-ceramic sealants for functional applications
Universidade de Aveiro 2014
Departamento de Engenharia de Materiais e Cerâmica
Allu Amarnath Reddy
Selantes vítreos e vitrocerâmicos à base de
aluminosilicatos alcalino-terrosos para aplicações
funcionais
Alkaline-earth aluminosilicate-based glass and
glass-ceramic sealants for functional applications
Tese apresentada à Universidade de Aveiro para cumprimento dos requisitos necessários à obtenção do grau de Doutor em Ciência e engenharia de materiais, realizada sob a orientação científica do Doutor José Maria da Fonte Ferreira, Professor Associado com Agregação do Departamento de Engenharia de Materiais e Cerâmica da Universidade de Aveiro e do Doutor Dilshat U. Tulyaganov, Professor do Turin Polytechnic University in Tashkent (Tashkent, Uzbequistao).
Apoio financeiro da FCT e do FSE no âmbito do III Quadro Comunitário de Apoio.
o júri
Presidente Prof. Doutor Fernando Joaquim Fernandes Tavares Rocha
Professor Catedrático da Universidade de Aveiro
Vogais Prof. Doutor Jorge Ribeiro Frade
Professor Catedrático, Universidade de Aveiro
Prof. Doutor Rui Manuel Amaral de Almeida
Professor Catedrático, Instituto Superior Técnico, Universidade de Lisboa
Prof. Doutor José Maria da Fonte Ferreira
Professor Associado com agregação, Universidade de Aveiro (orientador)
Prof. Doutora Maria Margarida Rolim Augusto Lima
Professora Auxiliar, Faculdade de Ciências e Technologia, Universidade Nova de Lisboa
Prof. Doutor Luís Filipe da Silva dos Santos
Professor Auxiliar, Instituto Superior Técnico, Universidade de Lisboa
Acknowledgements
First of all, I would like to express my sincere thanks to Professor José M.F. Ferreira, who has been the best possible guide I could ever hope to have, not only scientifically also I am grateful for his encouragement, guidance and support from the initial level to final level which enabled me to develop an understanding of the subject. Without his support and encouragement during tough times it would not be possible to complete this PhD dissertation in time. I appreciate all his contributions of time and ideas to make my PhD experience productive and stimulating.
I gratefully acknowledge my co-supervisor Professor Dilshat U. Tulyaganov, who taught me the fundamentals of glass and glass-ceramics and design of glass compositions, investigating and analysing the properties of glass and glass-ceramics and his moral support throughout my PhD dissertation time. In the absence of his scientific guidance, it would have been really difficult to complete this Odyssey with success.
I would like to thank to Dr. Ashutosh Goel, who introduced me to Professor José M.F. Ferreira. He has always been my role model as a researcher since I met him first time in 2011, University of Aveiro. His valuable suggestions and constructive discussions at different stages of my PhD improved the quality of my thesis. His moral support has never failed to give me hope.
Sincere thanks are extended to Dr. V.V. Kharton for his superb experimental work on electrical conductivity measurements, thermal shock resistance studies and oxygen leakage measurements discussed in this dissertation. These studies would not have been possible without his support and his research group. I very much appreciate their enthusiasm, intensity and willingness to perform these experiments for me in their laboratory.
I am much indebted to Dr. María Jesús Pascual Francisco for hot-stage microscopy measurements which are helped in understanding the sintering and crystallization behaviour of studied glasses in this dissertation. Thanks are also extended to her strong support in getting JECS-trust 2012 (201242-2) project. Sincere thanks are also going to Glenn C. Mather and Francisco for valuable suggestions and constructive discussion in understanding the glass science during my stay at Campus de Cantoblanco, Madrid.
I would like to thank Professor Luis Mafra, Department of Chemistry, University of Aveiro, for his great help concerning Magic Angle Spinning-Nuclear Magnetic Resonance (MAS-NMR) measurements.
I am much indebted to Professor Gaddam Vijaya Prakash for introducing me to the fascinating field of glass science and research. It was during my stay at Indian Institute of Technology (IIT) Delhi, that I learnt the basics of materials science which further played a significant role while accomplishing my PhD work.
I am grateful to Dr. Surendra Babu who taught me the fundamentals of rare-earth spectroscopy in phosphate glasses during my stay at IIT Delhi.
I would like to thank Dr. Pradeesh Kannan who taught me the basics and making of glass. I strongly appreciate his continuous moral support, not only scientifically, since 2008. Sincere thanks are also extended to Dr. Subratha Das for his moral support during my PhD dissertation.
A special thanks to all the technical staff in Department of Materials and Ceramic Engineering, University of Aveiro for their unceasing support. Without them it would not have been possible to finish my experimental task.
I thank to all my colleagues with whom I worked for the last six years.
Financial support of the Portuguese Foundation for Science and Technology for the fellowship grant SFRH/BD/89915/2012 is gratefully acknowledged. Support by the JECS-trust (201242-2) is also gratefully acknowledged.
palavras-chave Vidros; Vitrocerâmicos; Selantes; SOFCs, Bi-camadas; Auto-reparação.
Resumo A concepção planar de células de combustível de óxido sólido (SOFC) é a
mais promissora devido a sua fabricação mais fácil, um melhor desempenho e uma densidade de potência relativamente elevada. Nas SOFCs planares e outros dispositivos de electrólitos sólidos são necessárias vedações estanques ao gás ao longo das arestas de cada uma das células e entre os tubos de distribuição de gás e de pilha. Materiais vítreos e vitrocerâmicos (GC), em particular com composições baseadas em aluminosilicatos alcalino-terrosos, estão entre os materiais mais promissores para aplicações de vedação à prova de gás em SOFCs. Além do desenvolvimento de novos materiais à base de vidros e vitrocerâmicos, são também necessários novos conceitos para superar os desafios enfrentados pela tecnologia selante atualmente existente. O presente trabalho visa dar um contributo nesse sentido, propondo soluções de vedação para SOFCs e outras aplicações electroquímicas. Para o efeito, foram sintetizados vários vidros e GCs à base de diópsido, os quais foram caracterizados por recurso a uma grande variedade de técnicas. Todos os vidros foram preparados por fusão, enquanto os GCs foram produzidos por sinterização (tratamento térmico) de compactos de pó de vidro nas faixas de temperatura de 800 − 900 ºC por 1 − 1000 h. Além disso, foram estudados os efeitos de diversas substituições iónicas, especialmente de CaO por SrO, e de MgO + SiO2 por Ln2O3 (Ln = La, Nd, Gd, e Yb), em composições de
aluminosilicatos à base de diópsido na estrutura, sinterização e cristalização dos vidros e nas propriedades dos GCs resultantes com particular relevância para as propriedades de vedação em SOFCs. Com base nos resultados obtidos neste estudo, foi possível propor um novo conceito de selante vritrocerâmico em bi-camadas que visa ultrapassar os desafios enfrentados pelos vedantes actualmente usados em SOFCs. Os sistemas designados por Gd−0,3 (em % molar: 20,62 MgO−18,05 CaO−7,74 SrO−46,40 SiO2−1,29
Al2O3−2,04 B2O3−3,87 Gd2O3) e Sr−0,3 (em % molar: 24,54 MgO−14,73
CaO−7,36 SrO−0,55 BaO−47,73 SiO2−1,23 Al2O3−1,23 La2O3−1,79 B2O3−0,84
NiO) foram seleccionados para realizar o conceito de bi-camada. Ambos os GCs exibem propriedades térmicas semelhantes, e excelente estabilidade térmica ao longo de um período de 1.000 horas, mas diferem nas suas fracções vítreas/cristalinas. Eles revelaram também elevada aptidão para se ligarem à interconexão metálica (Crofer22APU) e ao electrólito sólido (zircónia estabilizada com 8 mol% de ítria (8YSZ) sem a formação de camadas interfaciais indesejáveis entre os diferentes componentes das SOFCs. Duas camadas separadas compostas pelos vidros (Gd−0,3 e Sr−0.3) foram preparadas e depositadas sobre as interconexões metálicas através de uma abordagem tape casting. As bi-camadas vitrocerâmicas mostram boa capacidade de molhamento e ligação à placa Crofer22APU, coeficientes de expansão térmica adequados (9,7−11,1 × 10⁻⁶ K−1), confiabilidade mecânica,
elevada resistividade eléctrica, e uma forte adesão aos componentes da SOFC. Todas estas características confirmam a boa adequação do sistema selante bi-camadas investigado para aplicações em SOFCs.
Keywords Glasses; Glass-ceramics; Sealants; SOFCs; Bi-layer; Self-healing.
abstract The planar design of solid oxide fuel cell (SOFC) is the most promising one due
to its easier fabrication, improved performance and relatively high power density. In planar SOFCs and other solid-electrolyte devices, gas-tight seals must be formed along the edges of each cell and between the stack and gas manifolds. Glass and glass-ceramic (GC), in particular alkaline-earth alumino silicate based glasses and GCs, are becoming the most promising materials for gas-tight sealing applications in SOFCs. Besides the development of new glass-based materials, new additional concepts are required to overcome the challenges being faced by the currently existing sealant technology. The present work deals with the development of glasses- and GCs-based materials to be used as a sealants for SOFCs and other electrochemical functional applications. In this pursuit, various glasses and GCs in the field of diopside crystalline materials have been synthesized and characterized by a wide array of techniques. All the glasses were prepared by melt-quenching technique while GCs were produced by sintering of glass powder compacts at the temperature ranges from 800−900 ºC for 1−1000 h. Furthermore, the influence of various ionic substitutions, especially SrO for CaO, and Ln2O3 (Ln=La, Nd,
Gd, and Yb), for MgO + SiO2 in Al-containing diopside on the structure,
sintering and crystallization behaviour of glasses and properties of resultant GCs has been investigated, in relevance with final application as sealants in SOFC. From the results obtained in the study of diopside-based glasses, a bi-layered concept of GC sealant is proposed to overcome the challenges being faced by (SOFCs). The systems designated as Gd−0.3 (in mol%: 20.62MgO−18.05CaO−7.74SrO−46.40SiO2−1.29Al2O3 − 2.04 B2O3−3.87Gd2O3)
and Sr−0.3 (in mol%: 24.54 MgO−14.73 CaO−7.36 SrO−0.55 BaO−47.73 SiO2−1.23 Al2O3−1.23 La2O3−1.79 B2O3−0.84 NiO) have been utilized to realize
the bi-layer concept. Both GCs exhibit similar thermal properties, while differing in their amorphous fractions, revealed excellent thermal stability along a period of 1,000 h. They also bonded well to the metallic interconnect (Crofer22APU) and 8 mol% yttrium stabilized zirconium (8YSZ) ceramic electrolyte without forming undesirable interfacial layers at the joints of SOFC components and GC. Two separated layers composed of glasses (Gd−0.3 and Sr−0.3) were prepared and deposited onto interconnect materials using a tape casting approach. The bi-layered GC showed good wetting and bonding ability to Crofer22APU plate, suitable thermal expansion coefficient (9.7–11.1 × 10⁻⁶
K−1), mechanical reliability, high electrical resistivity, and strong adhesion to the SOFC componets. All these features confirm the good suitability of the investigated bi-layered sealant system for SOFC applications.
Contents Acknowledgements Abstract List of tables List of figures List of abrevations List of symbols List of publications 1. Introduction 1
2. State of the art 5
2.1 Key requirements for seals in SOFCs and other devices ... 5
2.2 Families of glass and glass−ceramic sealants ... 8
2.3 Aluminosilicate based glass and glass−ceramic sealants ... 9
2.3.1 Alkali containing aluminosilicate glass/ glass−ceramic sealants ... 10
2.3.2 Alkaline earth aluminosilicate glass/ glass−ceramic sealants ... 17
2.4 The problem and the possible solution ... 23
3. Experimental 25 3.1 Glass preparation ... 25
3.1.2 Density and Molar volume... 25
3.2. Thermal analysis of glasses ... 26
3.2.1 Sintering behaviour − hot stage microscope (HSM) ... 26
3.2.2 Differential thermal analysis (DTA) ... 26
3.2.3 In situ−hot stage scanning electron microscopy ... 27
3.2.4 In situ High Temperature X–ray diffraction (HT–XRD) ... 27
3.3 Structural characterization of glass ... 28
3.3.1 Magic angle spinning − Nuclear magnetic resonance (MAS−NMR) ... 28
3.4 Glass−ceramic preparation ... 28
3.5 Characterization of glass−ceramics ... 29
3.5.1 Linear shrinkage, density and Mechanical strength ... 29
3.5.2 Qualitative and quantitative crystalline phase evaluation ... 29
3.6 Joining behaviour and chemical interactions between electrolyte/seal and interconnect/seal diffusion couples ... 30
3.7 Microstructural characterization− SEM and EDS ... 30
3.8 Electrical characterization ... 31
3.9 Ion transference number (electro motive force method) ... 31
3.10 Oxygen leakage measurements ... 32
3.11 Thermal shock resistance ... 33
3.12 Bilayer Synthesis ... 34
3.13 Raman spectroscopy ... 34
4. Results and Discussion 35 4.1 Diopside − Ba disilicate glass−ceramics for sealing applications in SOFC: sintering and chemical interactions studies ... 37
4.1.1 Introduction ... 37
4.1.2 Results ... 38
4.1.3 Discussion ... 47
4.2 Diopside – Ba disilicate glass–ceramic sealants for SOFCs: enhanced adhesion and thermal stability by Sr for Ca substitution ... 49
4.2.1 Introduction ... 49
4.2.2.1 XRD analysis and thermal properties ... 50
4.2.2.2 Structure of glass: MAS–NMR ... 52
4.2.2.3 Sintering and crystallization behaviour: DTA and HSM ... 53
4.2.2.4 Stability of crystalline phases ... 58
4.2.2.5 Glass–ceramic properties ... 61
4.2.2.6 Interaction studies ... 63
4.2.2.7 Electrical properties of the sealants ... 65
4.2.2.8 Thermal shock resistance and oxygen leakage measurements ... 68
4.3 Effect of strontium−to−calcium ratio on the structure, crystallization behaviour and functional properties of diopside−based glasses ... 73
4.3.1 Introduction ... 73
4.3.2 Results ... 73
4.3.2.1 Sintering/crystallization behaviours of glass−powder compacts by DTA and HSM ... 73
4.3.2.2 Evolution of crystalline−phase composition on heat treatement ... 76
4.3.2.3 MAS−NMR study of sintered glass−powder compacts ... 78
4.3.2.4 Thermal, mechanical and electrical properties of sintered glass−ceramic samples ... 81
4.3.2.5 Wetting and chemical interaction ... 85
4.3.3 Discussion ... 87
4.4 Sintering behaviour of lanthanide−containing glass−ceramic sealants for solid oxide fuel cells ... 91
4.4.1 Introduction ... 91
4.4.2.1 Glass forming ability... 93
4.4.2.2 Coefficient of thermal expansion ... 94
4.4.2.3.1 In situ hot−stage scanning electron microscopy ... 96
4.4.2.3.2 HSM−DTA ... 98
4.4.2.4 Crystalline phase evolution ... 105
4.4.2.5 Electrical conductivity of glass−ceramics ... 108
4.4.3. Discussion ... 109
4.5 Thermal and mechanical stability of lanthanide–containing glass–ceramic sealants for solid oxide fuel cells ... 113
4.5.1 Introduction ... 113
4.5.2. Results and Discussion ... 114
4.5.2.1 Structural transformations and shape deformation during sintering of glass powders ... 114
4.5.2.2. Structural transformations in glasses during long term thermal treatments ... 117
4.5.2.2.1 X–ray diffraction ... 117
4.5.2.2.2 Solid–state NMR ... 122
4.5.2.3. Thermomechanical behaviour of sintered GCs ... 129
4.5.2.3.1 Linear shrinkage, mechanical properties and thermal expansion .... 130
4.5.2.3.2 Electrical and thermal shock resistances ... 136
4.5.2.4 Chemical compatibility ... 139
4.6 Bi−layer glass−ceramic sealant for solid oxide fuel cells ... 143
4.6.1 Introduction ... 143
4.6.2 Results and Discussion ... 144
5. Conclusions 155 5.1 Diopside − Ba disilicate glass−ceramics for sealing applications in SOFC: sintering and chemical interactions studies ... 155
5.2 Diopside–Ba disilicate glass–ceramic sealants for SOFCs: enhanced adhesion and thermal stability by Sr for Ca substitution ... 156 5.3 Effect of strontium−to−calcium ratio on the structure, crystallization behaviour and functional properties of diopside−based glasses ... 158 5.4 Sintering behaviour of lanthanide−containing glass−ceramic sealants for solid oxide fuel cells ... 159 5.5 Thermal and mechanical stability of lanthanide–containing glass–ceramic sealants for solid oxide fuel cells ... 160 5.6 Bi−layer glass−ceramic sealant for solid oxide fuel cells ... 161
Future directions 163
List of tables
Table 2.1: Some alkali alkaline earth aluminosilicate glass compositions (%) investigated
for SOFCs. ... 11
Table 2.2: Properties of some aluminosilicate glass and glass−ceramic compositions ... 12
Table 2.3: Some alkaline earth aluminosilicate glass compositions (%) investigated for
SOFCs ... 19
Table 2.4: Boron-containing alkaline earth aluminosilicate glass compositions (%)
investigated for SOFC ... 20
Table 4.1.1: Nominal batch compositions of the glasses ... 38 Table 4.1.2: Thermal parameters of the glasses obtained from DTA and HSM at β=5
Kmin−1. ... 41
Table 4.1.3: Properties of sintered glass−ceramics produced from glass-powder compacts after heat treatment at different temperatures for 1h. ... 42
Table 4.1.4: CTE (±0.1) × 10−6 K−1 (200 − 700 ºC) of the glass−ceramics produced at different conditions. ... 43
Table 4.1.5: Activation energies for the total conductivity of glass−ceramic sealants in
air, and their statistical errors ... 45
Table 4.2.1: Chemical composition of glasses ... 50 Table 4.2.2: Density (gcm–3), molar volume (MV) (cm3mol–1), and CTE (±0.1×10⁻⁶ K–1)
(200–500 ºC) of glasses ... 51
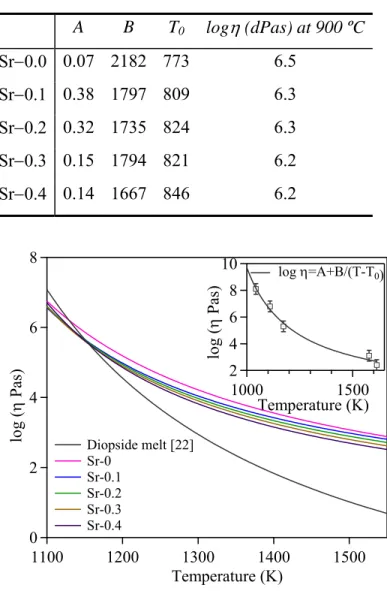
Table 4.2.3: Thermal parameters measured from DTA and HSM (ºC) ... 56 Table 4.2.4: A, B and T0 constants of the VFT equation, calculated from linear
regression analysis, and viscosity at 900 ºC. ... 58
Table 4.2.5: Results of Rietveld R.I.R. technique ... 60 Table 4.2.6: Shrinkage (%), density (gcm–3), bending strength (MPa) and CTE (±0.1) × 10–6 K–1 (200–700 ºC) data measured for the glass–powder compacts after sintering at 900 ºC for 1 h, 250 h, 500 h and 1,000 h. ... 63
Table 4.2.7: Average CTEs of solid oxide electrolyte (SOE) ceramics and thermal shock
stability of SOE / GC / YSZ assemblies sealed by Sr–0.3 GCs at 900 ºC. ... 70
Table 4.3.1: Nominal batch compositions of the glasses (mol. %) ... 73 Table 4.3.2: Thermal parameters measured from DTA and HSM. (TFS=First shrinkage,
TMS=Maximum shrinkage; TC=onset of crystallization; TP= peak temperature of
crystallization; SC=sintering ability) ... 76 Table 4.3.3: Results of quantitative Rietveld refinement of glasses treated at 850 ºC for
500 h (wt.%)... 78
Table 4.3.4: Quantification of the deconvoluted silicon components ... 80 Table 4.3.5: Bending strength (MPa) and CTE (±0.1) × 10–6 K–1 (200–700 ºC) data
measured for the glass–powder compacts after sintering / heat treated at 900 ºC for 1 h, 500 h and 1000 h. ... 82
Table 4.4.1: Glass compositions (Ln refers to lanthanide cation present in the glass). ... 92 Table 4.4.2: Glass composition (wt.%) of some glasses as determined by ICP-OES
analysis ... 94
Table 4.4.3: CTE (× 10−6 K−1) of glasses (200 – 500 ºC) and glass-ceramics (200 – 700 ºC). ... 95
Table 4.4.4: Quantitative crystalline phase analysis of glass−ceramics from Rietveld-R.I.R. analysis (wt.%) ... 107
Table 4.5.1: XRD - Rietveld refinement results (wt%) ... 120 Table 4.5.2: Shrinkage (%) and CTE (× 10−6) K−1 measured for the glass-powder
compacts after sintering at 850 ºC for 1 h, 250 h, 500 h and 1000 h. ... 134
Table 4.5.3: Weibull modulus (m) and Weibull strength (σ0, MPa) extracted from the
flexural strength data for the glass-powder compacts sintered at 850 ºC for 1 h, 250 h, 500 h and 1000 h. ... 134
List of figures
Fig. 2.1: Typical sealing configurations in planar SOFCs. ... 6 Fig. 2.2: Examples of seal configurations: (a), planar SOFCs; (b) tubular SOFCs; (c) cell
for sealant testing. ... 7
Fig. 2.3: Variation of glass transition (Tg) and glass softening point (Ts) with respect to
(a) (Na2O+K2O)/(CaO+MgO) (b) (BaO+SrO)/(CaO+MgO) molar ratio in some alkali
alkaline earth aluminosilicate glass compositions (see Tables 2.1,2.2 and 2.3). ... 14
Fig. 2.4: Variation of the coefficients of thermal expansion (CTE) as function of the
(Na2O+K2O)/(CaO+MgO) molar ratio in some alluminosilicate glass compositions and
(BaO+SrO)/(CaO+MgO) ratio in alluminosilicate compositions investigated for SOFCs (based on the data from Tables 2.2, 2.3 and 2.4). ... 15
Fig. 3.1: Schematic diagram of experimental set−up for oxygen leakage measurements. ... 32
Fig. 4.1.1: Comparison of DTA and HSM curves on the same temperature scale for
compositions (a) Di−Ba−1 (b) Di−Ba−2 and (c) Di−Ba−3 ... 40
Fig. 4.1.2: XRD spectra of the investigated glass powders at different temperatures (a)
800 ºC for 1 h, (b) 850 ºC for 1 h, (c) 900 ºC for 1 h, (d) 900 ºC for 300 h ... 41
Fig. 4.1.3: (a) Microstructure (SEM) and EDS element mapping of Cr, Mn, and Si at
interface between (a) Di−Ba−1glass & Crofer22APU and (b) Di−Ba−1glass and Crofer22APU. Down figures represents EDS line profile for diffusion of Cr, Fe, Ca, Mg, Si, La, Al and Ba at the interface between glass Di−Ba−1 & Crofer22APU and glass Di−Ba−2 & Crofer22 APU developed after heat treatment at 900 ºC for 1 h. (White dotted line indicates the interface between the Croffer22APU and the glass−ceramic). .. 44
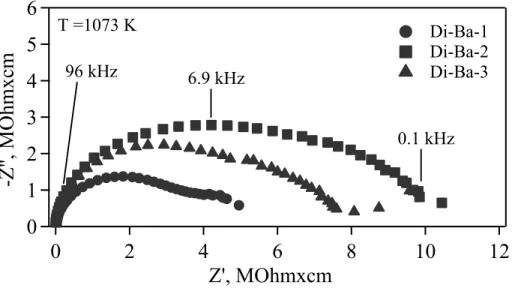
Fig. 4.1.4: The impedance spectra of the studied glass−ceramic materials ... 46 Fig. 4.1.5: The temperature dependencies of electrical conductivity of the studied
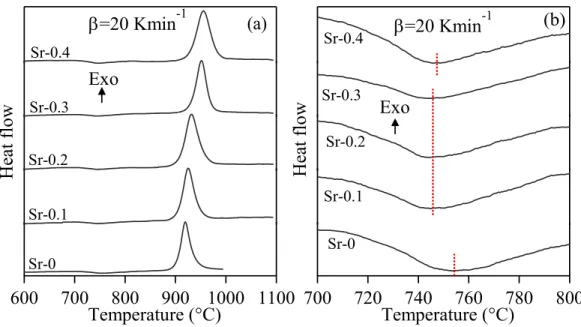
Fig. 4.2.1: DTA thermographs of investigated glasses at 20 Kmin–1 within different temperature intervals: (a) 600–1100 ºC; (b) 700–800 ºC... 52
Fig. 4.2.2: MAS–NMR Spectra for (a) 29Si; (b) 27Al; and (c) 11B nuclei ... 53
Fig. 4.2.3: DTA–HSM thermo graphs of the investigated glasses at 5 Kmin−1: (a) Sr–0.1; (b) Sr–0.2; (c) Sr–0.3; and (d) Sr–0.4. ... 55
Fig. 4.2.4: HSM images of cylindrical glass–powder compact on alumina substrate at
various stages of heating cycles. ... 57
Fig. 4.2.5: Comparison of viscosity curves with diopside melt viscosity curve (logη= – 4.27 +3961 K/(T–751K) [22]). Inset figure represents the viscosity curve derived from HSM characteristic viscosity points for Sr–0 glass. ... 58
Fig. 4.2.6: XRD pattern of glass–ceramics sintered at 900 ºC for: (a) 1 h; (b) 250 h; (c)
500 h; and (d) 1,000 h. ... 59
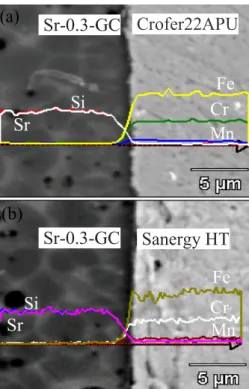
Fig. 4.2.7: SEM image and EDS element mappings for Cr, Fe, Mn and Sr at the interface
between Sr–0.3 and Sanergy HT after heat treatment at 900 ºC for 1 h. ... 64
Fig. 4.2.8: SEM image and EDS element mappings for Y, Zr, Sr, and Si at the interface
between Sr–0.3 and 8YSZ after heat treatment at 900 ºC for 1 h. ... 65
Fig. 4.2.9: (a) SEM image and elemental line profile at the interface of Sr−0.3 and Crofer22APU. And (b) SEM image and elemental line profile at the interface of Sr−0.3 and SanergyHT. ... 66
Fig. 4.2.10: Temperature dependencies of the total electrical conductivity in atmospheric
air. ... 66
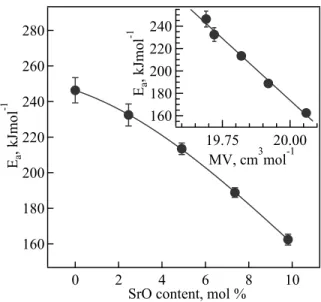
Fig. 4.2.11: Activation energy for the electrical conductivity of the studied glass–
ceramics. Inset shows the relationship between the total conductivity activation energy and molar volume. ... 67
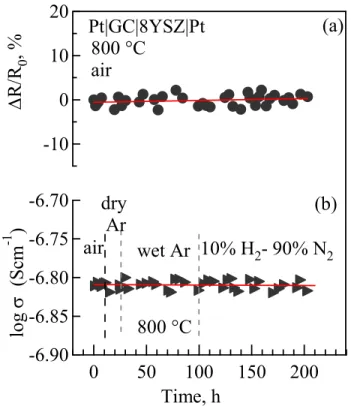
Fig. 4.2.12: Time dependencies of the relative variations of electrical resistance of Sr–
0.3/8YSZ couple (a) in air and (b) total conductivity of Sr–0.3 glass−ceramics in various atmospheres, at 800 ºC. ... 68
Fig. 4.2.13: (a)–(b) Typical SEM images of the interfaces between Sr−0.3 glass−ceramic sealant and various solid oxide electrolyte ceramics after 3 air-quenching cycles. The arrows show largest cracks developed at the interfaces. ... 69
Fig. 4.2.14: Time dependence of the relative changes in oxygen leakage flux during
thermal cycling of an electrochemical cell with dense YSZ membrane and Sr–0.3 sealant (a), and corresponding temperature variations (b). ... 70
Fig. 4.3.1: DTA and HSM thermographs of the investigated glasses. ... 74 Fig. 4.3.2: HSM images of various glass powder compacts of different Sr/Ca ratio on
alumina substrates at various stages of heating cycle. (FS= first shrinkage; MS=maximum shrinkage; D=deformation; HS=hemi sphere; S=sphere; F=flow). ... 75
Fig. 4.3.3: XRD patterns of glass–ceramics sintered at 850 ºC for: (a) 1 h; (b) 500 h; and
(c) 1000 h. ... 77
Fig. 4.3.4: (a) 29Si MAS–NMR spectra of glass–ceramics heat treated at 850 ºC for 1000 h. Spectral deconvolutions of the 29Si MAS spectra of glass–ceramics heat treated at 850 ºC for 1000 h: (b) Sr/Ca=5/4; (c) Sr/Ca=9/0. The red line represents experimental curve, (superposition of Gaussian shapes) and the green lines represent the Gaussian shapes. .. 79
Fig. 4.3.5: 27Al MAS–NMR spectra of glass–ceramics heat treated at 850 ºC for 1000 h. The inset compares the 27Al MAS–NMR spectra for Sr/Ca=9/0 glass and Sr/Ca=9/0 glass–ceramic heat treated at 850 ºC for 1000 h. ... 81
Fig. 4.3.6: Fracture surfaces of glass–powder compacts heat treated at 850 ºC (a)
Sr/Ca=9/0, 1 h; (b) Sr/Ca=9/0, 1000 h. ... 83
Fig. 4.3.7: Electrical conductivity at 800 ºC and the conductivity activation energy,
calculated by the standard Arrhenius equation in the temperature range 600–830 ºC, as a function of strontium content in the studied glass−ceramic materials. The inset shows the relationship between the activation energy and molar volume. ... 83
Fig. 4.3.8: Time dependencies of the total electrical conductivity of Sr/Ca–3/6 glass–
ceramics in various atmospheres at 700 and 800 ºC. ... 84
Fig. 4.3.9: a) SEM image and EDS element mappings for (b) Cr and (c) Mn, at the
XRD pattern of (d) glass + 10 wt.% Cr2O3 and (e) glass + 10 wt.% MnO mixtures after
100 h heat treatment at 850 ºC. ... 86
Fig. 4.3.10: Typical morphologies of the Sr/Ca–3/6 glass−ceramic layer deposited onto 8YSZ ceramics after heat treatment at 950 ºC: (a) glass−ceramic layer surface, (b) edge of glass−ceramic deposited on 8YSZ. ... 86
Fig. 4.4.1: X-ray diffractograms of as synthesized glasses depicting their amorphous
nature... 93
Fig. 4.4.2: HT−ESEM images for glass Nd−0.2 obtained in situ during heat treatment of glass powder in the temperature range of 600 – 680 ºC. ... 96
Fig. 4.4.3: HT−ESEM images for glass Gd−0.2 obtained in situ during heat treatment of glass powder in the temperature range of 600 – 720 ºC. ... 97
Fig. 4.4.4: HT−ESEM images for glass Yb−0.2 obtained in situ during heat treatment of glass powder in the temperature range of 600 – 750 ºC. ... 98
Fig. 4.4.5: Comparison of DTA and HSM curves on the same temperature scale for
glasses: (a) Ln−0, (b) La−0.3, (c) Nd−0.3, (d) Gd−0.2, and (e) Yb−0.2 at heating rate of 5
Kmin−1………97
Fig. 4.4.6: The variation in different thermal parameters for glasses obtained from DTA
and HSM ith respect to (a) La2O3, (b) Nd2O3,(c) Gd2O3,and (d) Yb2O3 content in glasses.
The error bars have been masked by the data points. ... 102
Fig. 4.4.7: HSM images of lanthanide free glass (Ln−0) along with La2O3 and Nd2O3
containing glass powder compacts on alumina substrates at various stages of heating cycle. ... 103
Fig. 4.4.8: HSM images of Gd2O3 and Yb2O3 containing glass powder compacts on
alumina substrates at various stages of heating cycle. ... 104
Fig. 4.4.9: X-ray diffractograms of glass powder compacts after sintering at 850 ºC for 1
h... 105
Fig. 4.4.10: Observed (red), calculated (blue), and difference curve from the Rietveld
Fig. 4.4.11: Total electrical conductivity (σ) of dense glass−ceramics in air in the temperature range of 625 – 800 ºC: (a) La-, (b) Nd-, (c) Gd, (d) Yb-containing glass-ceramics. ... 108
Fig. 4.5.1: In-situ XRD patterns observed from room temperature to 850 ºC temperature
for (a) La−0.2; (b) Nd−0.2; (c) Gd−0.3 and (d) Yb−0.3 glass. ... 115
Fig. 4.5.2: HSM images of glass-powder compacts upon holding at 850 ºC for 1 h. .... 116 Fig. 4.5.3: XRD patterns of (a) La−0.2 (b) Nd−0.2 (c) Gd−0.3 and (d) Yb−0.3 glass−ceramics sintered at 850 ºC for various periods of time. ... 117
Fig. 4.5.4: Observed, calculated, and difference curve from the Rietveld refinement of
the Yb-0.3 glass−ceramic heat treated at 850 ºC for 1000 h in air atmosphere. ... 118
Fig 4.5.5: MAS NMR spectra of (a) 29Si, (b) 27Al and (c) 11B nuclides for the La−0.2 glass (left) and glass−ceramics sintered at 850 ºC for 1 h (right). ... 123
Fig. 4.5.6: MAS NMR spectra of (a) 29Si, (b) 27Al and (c) 11B nuclides for the glass powders. ... 125
Fig. 4.5.7: MAS NMR spectra of (a) 29Si, (b) 27Al and (c) 11B nuclides for the glass−ceramics sintered at 850 ºC for 1 h. ... 126
Fig. 4.5.8: MAS NMR spectra of 29Si, 27Al and 11B nuclides of the glass−ceramics heat treated at 850 ºC for 500 h and 1000 h ... 127
Fig. 4.5.9: 11B 3QMAS spectra of the glass−ceramics heat treated at 850 ºC for 1000 h
(left) and the glass powder (right) corresponding to the La−0.2 sample ... 129
Fig. 4.5.10: Variation of mechanical strength with respect to the glass−ceramics heat treatment dwell time. ... 130
Fig. 4.5.11: Fractured surfaces of glass−powder compacts heat treated at 850 ºC for 500 h and 1000 h after the 3 point bending strength measurement. ... 132
Fig. 4.5.12: Weibull distribution of flexural strength for glass−powder compacts annealed at 850 ºC for various dwell times. (○−1h; □−250 h; Δ −500 h; ◊ −1000 h) ... 135
Fig. 4.5.13: Typical SEM images of the interface between Gd−0.3 glass−ceramic sealant and YSZ solid electrolyte ceramics after 7 air-quenching cycles and final quenching in water. Arrows show the largest cracks developed at the interface. ... 136
Fig. 4.5.14: (a) Time dependence of the relative changes in oxygen leakage flux during
thermal cycling of an electrochemical cell with dense YSZ membrane and Gd−0.3 sealant (i), and corresponding temperature variations (ii). (b) Time dependencies of total electrical conductivity (σe) of Gd–0.3 glass–ceramics (i) and relative variations of
electrical resistance of Gd–0.3/8YSZ couple (ii), at 850 ºC in air. The arrow shows the conductivity value obtained after heat treatment of Gd−0.3 compact during 1000 h at 850 ºC and subsequent deposition of Pt electrodes, followed by the measurement. ... 137
Fig. 4.5.15: Microstructure (SEM) and EDS element mapping of Cr, Fe, Mn, Si and Sr at
the interface between SanergyHT/La−0.2−glass−ceramic/SanergyHT after the heat treatment at 850 ºC for 500 h. ... 140
Fig. 4.5.16: Microstructure (SEM) and EDS element mapping of Cr, Fe, Mn, Si and Sr at
the interface between Sanergy HT/Nd−0.2−glass−ceramic/Sanergy HT after the heat treatment at 850 ºC for 500 h. ... 142
Fig. 4.6.1: Interface between Gd−0.3 and Sr−0.3 glass−ceramics after heat treating at 850 ºC for 1 h: (a) and (b) SEM images; (c) Raman spectra; (d) elemental mapping. ... 145
Fig. 4.6.2: Interface between Gd−0.3 and Sr−0.3 glass−ceramics after heat treating at 850 ºC for 100 h: (a) and (b) SEM images; (c) Raman spectra; (d) elemental mapping. ... 146
Fig. 4.6.3: SEM image and micro-Raman spectra collected in the square area (identified
in the SEM image) at the interface between Gd−0.3 glass−ceramic /Sr−0.3 glass−ceramic after heat treatment at 850 ºC for 100 h. The figures (1) and (2) below show Raman spectra at 3 different places with 5 μm interval along the interface. ... 147
Fig. 4.6.4: Comparison of Raman spectra for Sr−0.3 and Gd−0.3 glass−ceramics with the pure diopside crystalline phase (Ref. [204]). ... 148
Fig. 4.6.5: (a) Weibull distributions of flexural strength values for the Gd−0.3/Sr−0.3 bi-layered glass−ceramics heat treated at 850 ºC for 1 h, and (b) Impedance spectra obtained
at 800 ºC in air of bi-layered glass−ceramics. The inset in (b) shows the temperature dependence of the electrical conductivity. ... 149
Fig. 4.6.6: SEM image and elemental mappings at the interfaces between Gd-0.3
glass−ceramic/Sr−0.3 glass−ceramic/Crofer22H after heat treatment at 850 ºC for 1 h. 150
Fig 4.6.7: SEM image and elemental mappings at the Interface between Gd−0.3 glass−ceramic/Sr−0.3 glass−ceramic/Crofer22H after heat treating at 850 ºC for 100 h. ... 151
List of abbreviations
BO Bridging oxygen
CCD Charge coupled device
CTE Coefficient of Thermal Expansion
DC Diffusion coefficient
Di Diopside
DTA Differential thermal analysis Ea Electrical activation energy
EDS Energy dispersive spectroscopy
emf Electro motive force
ESEM Environmental scanning electron microscopy
FC Fuel Cell
GC Glass-ceramic
HSM Hot-stage-microscope
HT High temperature
Ln Lanthanide
MAS-NMR Magic angle nuclear magnetic resonance
NBO Non bridging oxygen
RF Radio frequency
RIR Reference intensity ratio Sc Sintering ability parameter
SD Standard deviation
SE Solid-electrolyte
SEM Scanning electron microscopy
SH Self-healing
SMA Shape memory alloy
SOFC Solid Oxide Fuel Cell
XRD X-ray diffraction
List of Symbols α CTE β Heating rate Vm Molar volume ρ Density ∅ Diameter F Probability of failure j Flux density m Weibull modulus R Resistance σ Mechanical strength σe Electrical conductivity
σO Weibull characteristic strength
Tg Glass transistion temperature
Tc Onset of crystallization temperature
Tp Peak crystallization temperature
Ts Softening temperature
TFS First shrinkage temperature
TMS Maximum sintering temperature
TD Deformation temperature
THB Half-Ball temperature
List of publications
1. Sintering behaviour of lanthanide-containing glass-ceramic sealants for solid oxide fuel cells.
Ashutosh Goel, Allu Amarnath Reddy, Maria J. Pascual, Laurent Gremillard, Annie Malchere, José M.F. Ferreira.
Journal of Materials Chemistry 22 (2012) 10042-10054
2. Diopside - Mg orthosilicate and Diopside - Ba disilicate glass-ceramics for sealing applications in SOFC: sintering and chemical interactions studies.
Allu Amarnath Reddy, Dilshat U. Tulyaganov, Ashutosh Goel, Maria J. Pascual,
Vladislav V. Kharton, Ekaterina V. Tsipis, José M.F. Ferreira.
International Journal of Hydrogen Energy 37 (2012) 12528-12539
3. Study of melilite based glasses and glass-ceramics nucleated by Bi2O3 for
functional applications.
Allu Amarnath Reddy, Dilshat U. Tulyaganov, Saurabh Kapoor, Ashutosh Goel,
Maria J. Pascual, Vladislav V. Kharton, and José M.F. Ferreira.
RSC Advances 2 (2012) 10955–10967
4. Diopside–Ba disilicate glass–ceramic sealants for SOFCs: enhanced adhesion and thermal stability by Sr for Ca substitution.
Allu Amarnath Reddy, Dilshat U. Tulyaganov, Maria J. Pascual, Vladislav V.
Kharton, Ekaterina V. Tsipis, Vladislav A. Kolotygin, José M.F. Ferreira.
International Journal of Hydrogen Energy 38 (2013) 3073-3086
5. Study of calcium–magnesium–aluminum–silicate (CMAS) glass and glass– ceramic sealant for solid oxide fuel cells.
Allu Amarnath Reddy, Ashutosh Goel, Dilshat U. Tulyaganov, Saurabh Kapoor,
K. Pradeesh, Maria J. Pascual, andJosé M.F. Ferreira.
Journal of Power Sources 231 (2013) 203-212.
6. Sintering and devitrification of glass-powder compacts in the akermanite - gehlenite system.
Allu Amarnath Reddy, Dilshat U. Tulyaganov, Ashutosh Goel, Saurabh Kapoor,
Maria J. Pascual, José M.F. Ferreira.
Journal of Materials Science 48 (2013) 4128–4136
7. Melilite glass–ceramic sealants for solid oxide fuel cells: effects of ZrO2 additions
assessed by microscopy, diffraction and solid-state NMR.
Allu Amarnath Reddy, Dilshat U. Tulyaganov, Ashutosh Goel, Mariana Sardo,
Paul V. Wiper, Maria J. Pascual, Vladislav V. Kharton, Ekaterina V. Tsipis, Vladislav A. Kolotygin, Luís Mafra, José M.F. Ferreira.
8. Aluminosilicate-based sealants for SOFCs and other electrochemical applications - A brief review.
Dilshat U. Tulyaganov, Allu Amarnath Reddy, Vladislav V. Kharton, José M.F. Ferreira.
Journal of Power Sources 242 (2013) 486-502.
9. SrO–Containing Diopside Glass–Ceramic Sealants for Solid Oxide Fuel Cells: Mechanical Reliability and Thermal Shock Resistance.
Allu Amarnath Reddy, Dilshat U. Tulyaganov, Maria J. Pascual, Vladislav V.
Kharton, Ekaterina V. Tsipis, Vladislav A. Kolotygin, José M.F. Ferreira.
Fuel Cells 13 (2013) 689–694.
10. Effect of strontium to calcium ratio on the structure, crystallization behaviour and functional properties of diopside based glasses.
Allu Amarnath Reddy, Dilshat U. Tulyaganov, Maria J. Pascual, Vladislav V.
Kharton, Sergey I. Bredikhin, Vladislav A. Kolotygin, José M.F. Ferreira.
International Journal of Hydrogen Energy 39 (2014) 3552-3563.
11. Thermal and mechanical stability of lanthanide–containing glass–ceramic sealants for solid oxide fuel cells.
Allu Amarnath Reddy, Ashutosh Goel, Dilshat U. Tulyaganov, Mariana Sardo,
Luís Mafra, Maria J. Pascual, Vladislav V. Kharton, Ekaterina V. Tsipis, Vladislav A. Kolotygin, and José M.F. Ferreira.
Journal of Materials Chemistry A 2 (2014) 1834-1846.
12. Bi-layer glass-ceramic sealant for solid oxide fuel cells.
Allu Amarnath Reddy, Neda Eghtesadi, Dilshat U. Tulyaganov, Maria J.
Pascual, Luis F. Santos, Surendran Rajesh, Fernando M.B. Marques, and José M. F. Ferreira.
Journal of European Ceramic Society 34 (2014) 1449–1455
Others
13. KCa4(BO3)3:Ln3+ (Ln=Dy, Eu, Tb) phosphors for near UV excited
white-light-emitting diodes.
Allu Amarnath Reddy, Subrata Das, Ashutosh Goel, Rupam Sen, Renée Siegel,
Luís Mafra, G Vijaya Prakash, José M.F. Ferreira.
AIP Advances 3 (2013) 022126.
14. Structure, biodegradation behaviour and cytotoxicity of alkali-containing alkaline-earth phosphosilicate glasses.
Ishu Kansal, Allu Amarnath Reddy, Francisco Muñoz, Hae-Won Kim, Dilshat U. Tulyaganov, Seong-Jun Choi, José M.F. Ferreira.
1
1. Introduction
The depletion of fossil fuel reserves and the emission of greenhouse gases constitute a menace to the present and the future generations in terms of energy availability, environmental pollution, global warming and health hazards. Therefore, finding alternative energy resources and efficient production methods for electricity is a fundamental requirement for the modern world [1-3]. Among the various technologies, fuel cell (FC) is the most widely adopted one owing to a promising and viable alternative for large scale generation of electricity, with minimal undesirable chemical, thermal and acoustic emissions [4-7]. Therefore, the development of FC technology is one such attempt to cater the rising energy demands in the coming era.
A FC is an electrochemical device that converts the stored chemical energy directly into electrical energy. Simple FC essentially consists of an anode and a cathode separated by an electrolyte. There are several types of FCs, named after the type of material used for the electrolyte, currently under development, each with its own advantages, limitations, and potential applications [4-7]. Among various FCs, solid oxide fuel cells (SOFCs) offer important advantages: (i) the most electrically efficient one with 45–65% efficiency (total system efficiency ∼85%, including the thermal component – unheard of by any other technology) in the conversion of chemical energy to electricity; (ii) capable of operating with various fuels, for ex. natural gas, gasoline, hydrogen and bio–fuels; (iii) low cost and environmental friendly nature (e.g., low emissions NOx [<0.5
ppm)]; (iv) because of high operation temperatures SOFCs do not need highly expensive catalyst such as platinum; and (v) high stability of electrolyte, flexibility of cell design, and long stack−life because all the components are solid [2, 8-10]. All of the above advantages make SOFCs a “highly efficient future technology” that is currently in demand among different categories of FC. Because of these reasons and motivations, tremendous research and development efforts in this area have been made along the last two decades, especially through specific programs supported by various Governmental and private agencies across the world, solely dedicated towards finding feasible solutions to various technical challenges which acted as major roadblocks for the commercialization of SOFC technology. For example: In 1997 a pilot project started with
2
a 100 kW SOFC cogeneration plant in The Netherlands, which achieved 46% electrical efficiency and 25% thermal efficiency [11, 12]. Based on geometry, tubular and planar deigns are the two most popular SOFCs. However, the current path lengths are typically longer in tubular cells, compared to planar cells. This significantly limits their performance beyond a certain radial extension over planar cells. Planar design is the most promising due to its cheap and simple fabrication along with improved performance and power density relative to other designs. Among the various developments in planar−SOFCs (p–SOFC), advances in interconnect components have increased the SOFCs' electrical efficiency up to 65%. The use of metallic interconnects instead of ceramic bipolar plates makes it possible to lower the SOFC temperature from 1000 ºC to 700–800 ºC and to increase power density [1, 8, 13].
A single SOFC comprises, at least, one dense solid−electrolyte (SE) membrane in contact with porous cathode and anode, onto which a gaseous oxidant (usually atmospheric oxygen) and a fuel are continuously supplied; the power is generated due to oxidant reduction at the cathode and fuel oxidation by the O2− anions diffused through the electrolyte, at the anode. The SOFC performance is primarily governed by electrical and electrochemical properties of the electrodes and solid electrolyte, compositions of the fuel and oxidant gas mixtures and current collection. The ideal absence of gas leakages is also essential to grant its ingegrity and functioning [14-20]. In general, the ceramics used in SOFCs do not become electrically and ionically active until they reach relatively high temperatures and, as a consequence, the cell has to run at temperatures ranging from 600−1,000 ºC.
Of critical importance for the SOFC efficiency and durability are also the properties of sealants used to prevent gas mixing between the anode and cathode compartments, to bond the cell stacks, and also to provide electrical insulation. Whilst the negative impact of minor leakages in the SOFC stacks can often be neglected, any leak may critically increase the contamination of high−purity gases produced using the solid−electrolyte membranes and induce measuring errors in the electrochemical sensors. Therefore, one major hurdle that still proves to be an arduous task for the researchers worldwide is the development of a hermetic high temperature sealing [2, 21-26] .
3
To date, a number of sealants have been proposed and studied extensively for their physical, thermal, mechanical and electrical properties and also tested in real SOFCs stacks. Among the various types of sealant materials, glass and glass–ceramics (GCs) materials are considered as the most efficient and attractive sealing materials for SOFCs due to their ability to form hermetic seals at high temperatures, low costs and durability [21-26]. A principal advantage of the glass seals is that their chemical composition and molecular structure can be tailored to optimize properties like coefficient of thermal expansion (CTE), mechanical strength, sintering behaviour, chemical and electrical resistance, etc. A vast amount of specialised literature available in this area (reviewed in Chapter 2) reveals that currently used SOFCs sealant materials based glass and GC are not completely satisfactory towards their commercialization in open market. Therefore, still there is a need to develop suitable sealant materials along with new concepts and or proposals. The aim of this study was to develop new glass based sealant materials and to evaluate their suitability for application in different technological areas with emphasis on sealing in SOFCs. The aim of this study also includes the development of Bilayer sealant material in order to overcome the challenges being faced by the present glass based seal materials.
In the light of the above mentioned perspective, this dissertation comprises five chapters. The first chapter, i.e. Introduction provides the basics of SOFCs and highlights the necessity of an efficient sealant material. The second chapter provides an overview about the current status of sealing technology in SOFC, and draws attention towards the lacuna in the existing glass/GC seals. In other words, chapter two lays the foundation of our work. The third chapter deals with the experimental procedure and methodology used in accomplishing this work. It provides details about all the experimental techniques and procedures employed in order to synthesize, characterize and test our samples. Chapter four is the most important part of this work as it presents all the experimental results obtained on newly designed glass and GCs based sealant material developed for the realization of bi-layer seal during past 3−4 years along with pertaining discussion while, in chapter five we have tried to conclude all the results obtained during this work and provide future directions in order to produce technologically useful materials.
5
2. State of the art
2.1 Key requirements for seals in SOFCs and other devices
Fig. 2.1 and 2.2 present several typical examples illustrating the use of high-temperature sealants in various SOFCs [27-32]. The seal optimization requires always a multifactor analysis; in addition to the materials science−related aspects and sealing configuration, the variables include, at least, contact area with other components of the electrochemical device, compression, exposure to oxidizing and reducing atmospheres, seal formation conditions, and prospective startup/shutdown regimes. Nonetheless, the general requirements to the GC sealants, irrespective of the stack configuration and fabrication technologies, involve [15-17, 33-36]:
(i) Nearly zero gas permeability;
(ii) Good adhesion to the solid electrolyte interconnects, electrodes, current collectors and/or other interfacing materials;
(iii) Chemical inertness with respect to these materials under the stack fabrication and operation conditions;
(iv) Coefficients of thermal expansion (CTE) compatible with those of the electrochemical cell constituents and other construction materials;
(v) High electrical resistivity (>105 Ohm cm) under operating conditions;
(vi) Minimum volatilization and diffusion of the sealant components;
(vii) No tendencies to bulk reduction, oxidation, hydration, carbonate formation, and reactions with other gaseous species such as SOx and H2S;
(viii) Thermal and morphological stability at the cell operation temperatures and during startup/shutdown;
(ix) Compatibility of the characteristic temperatures, primarily glass transition, crystallization, softening and maximum shrinkage temperature, with the limitations arising from properties of the electrochemical device components and target operation regimes;
(x) Superior thermal shock resistance and high mechanical strength;
6
Fig. 2.1: Typical sealing configurations in planar SOFCs.
Fuel cells
Interconnectors Glass-ceramic
7
Fig. 2.2: Examples of seal configurations: (a), planar SOFCs; (b) tubular SOFCs; (c) cell
for sealant testing.
A
B C
Gas-tight ceramic seal
Venting
seal Fibrousalumina mat Electrodes Gas delivery opening
Solid electrolyte sheet Second
electrolyte baking sheet
Metal alloy vias
Seal Housing Oxidant plenum Fuel plenum Fuel cells Gas input Sealed tube Sealant gasket Support Heated at 750-950 °C
8 pores, bubbles or micro cracks;
(xii) Stability with respect to local heating, high applied voltage, flame, carbon deposition and other parasitic phenomena;
(xiii) Self−healing ability originating from viscous flow of the seal glass; (xiv) Availability of the seal components and low costs.
2.2 Families of glass and glass-ceramic sealants
Through literature survey has evidenced that the majority of SOFC seals are primarily glasses and GCs. A glass is a super cooled liquid having no periodicity and symmetry in the network. All oxide or fluoride materials will not form a glass. To identify a glass forming oxide material Zacharaisen has proposed selection rules [37]. According to Zacharaisen an oxide glass may be formed (1) if the sample contains a high
percentage of cations which are surrounded by oxygen tetrahedra or by oxygen triangles; (2) if these tetrahedra or triangles share only corners with each other and; (3)
if some oxygen atoms are linked to only two such cations and do not form further bonds
with any other cations. From these considerations one could conclude that the following
oxides should be glass formers: B2O3, SiO2, GeO2, P2O5, As2O3, Sb2O3, In2O5, Tl2O3,
SnO2, PbO2, and SeO2.
Most of the glass and GC based sealants proposed so far are silicate; borate, phosphate or borosilicates (e.g., [23, 38]). However, every material has some advantages which are coupled along with some drawbacks. Alkali silicate glasses or GCs, in principle are not suitable as sealants because alkali cations tend to react with other components of the electrochemical devices [39], form volatile oxides and stable hydroxides and carbonates, and can lead to chromium poisoning. Further, most of the researchers have searched sealing materials on Ba−aluminosilicate GC system and its derivatives [23, 39-42]. The majority of these glass compositions contain high amount of BaO (30−35 mol%), leading to the crystallization of monoclinic celsian (BaAl2Si2O8)
after long term heat treatments [23] and formation of detrimental crystalline phase BaCrO4 when interfacing with Cr−based metallic interconnect materials in air at
operating temperatures [43]. Significant content of BaO may also promote interaction with water vapour, leading to sealant degradation under SOFC operating conditions. For
9
example, Pacific Northwest National Laboratory (PNNL) patented a glass–based sealant named as G18 (15CaO–35BaO–5Al2O3–10B2O3–35SiO2 (mol%)) [44]; the proneness of
G18 glass for crystallizing the low thermal expansion monoclinic BaAl2Si2O8 phase
during long term SOFC operation, its high content of BaO that might also react with water vapour and Cr−containing gaseous species (CrO3 or CrO2(OH)2) diffused to the
glass surfaces to form BaCrO4, constitute the most serious drawbacks as SOFC sealant.
The large CTE differences between this chromate ((18–20) × 10−6 K−1), the sealing glass (CTE of (10–13) × 10−6 K−1) and the metallic interconnects ((11−13) × 10−6 K−1) lead to significant losses in bonding strength between SOFC glasses and interconnect materials or to their physical separation.
Also, B2O3 forms volatile compounds with water vapour leading to seal
degradation [23]. Glasses with B2O3 as the only glass former have shown up to 20%
weight loss in the humidified H2 environment and extensive interactions with cell
component materials both in air and wet fuel gas [45]. Thus, high amount of B2O3 in the
sealants is not seen with alacrity. Some P2O5−based glasses have also been investigated
for sealing purposes. Again, these compositions face a severe problem of volatilization of phosphate component leading to easy crystallization of pyro− or meta−phosphates. These phases show poor stability at high temperature in wet fuel gas atmosphere [38, 46]. The difficulties in meeting all the requirements in a given material stimulated many research groups throughout the world searching for alternative glass sealants [21, 25, 26, 34-36, 47-56]. Previous review articles on sealant materials for SOFCs have evidenced that aluminosilicate−based materials constitute the most promising family for the rigid GC sealants [21, 23, 25, 26, 57]. Therefore, in the current chapter an attempt was undertaken to analyse the compositional range and properties of aluminosilicate−based sealants aiming at their further improvements. Selection of the references for this review is focused on the last 10−15 years, with the main emphasis on the newly reported materials.
2.3 Aluminosilicate based glass and glass
−ceramic sealants
The thermodynamic properties of aluminosilicate glasses are mainly determined by their composition and the network connectivity. When introducing Al2O3 in the fully
10
connected corner−sharing tetrahedral network of amorphous silicates, the Al atoms substitute for the Si atoms in the centre of the tetrahedra thus leading to charged (AlO4)5−
units. In order to maintain local charge neutrality, (AlO4)5− units can be
charge−compensated by alkali cations (K, Li) which must be present in the vicinity of each such tetrahedron. Therefore, the (AlO4)5− tetrahedra substitute directly into the
network for silicon−oxygen tetrahedra, and simultaneously tend to suppress the immiscibility while raising the Tg and decreasing the CTE of glasses [58]. However, if
the concentration of these cations becomes larger than needed for a full compensation of the (AlO4)5− units, then the cations play the role of modifiers. Namely, these create
non−bridging oxygens (NBO) by breaking T–O–T linkages (T=Si/Al) and/or play the role of charge balancing, by neutralizing the AlO4 entities.
Considering the above mentioned features, alkali or alkaline earth oxides such as Na+, K+, Ca2+, Mg2+, Sr2+, Ba2+ etc., can serve both as charge compensators and/or as network modifiers in aluminosilicate glasses. These cations perturb silicate frameworks linked by bridging oxygen (BO) and by forming NBO, which play essential roles in many dynamic properties of melts. In principle, the number of NBO atoms in a glass is directly related to the viscosity of the glass forming liquid [59]. The types of cations in oxide glasses certainly can cause different states of disorder depending on their characteristics, such as ionic radius, charge, field strength, and on their local environments.
2.3.1 Alkali containing aluminosilicate glass/ glass−ceramic sealants
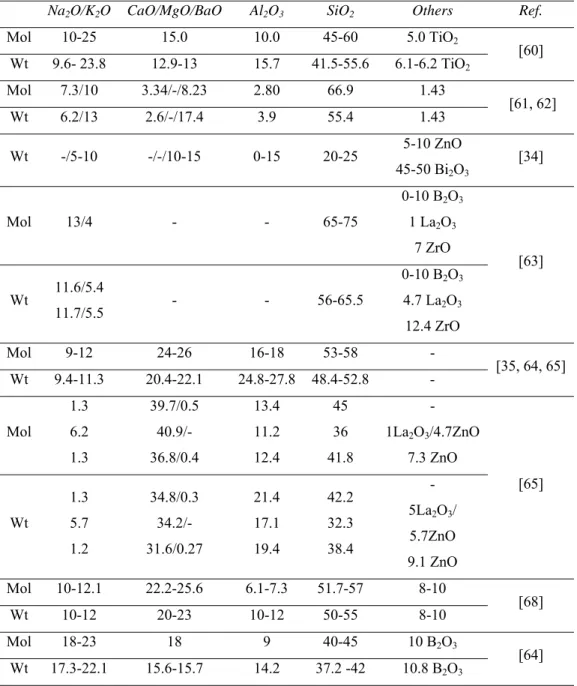
Alkali oxides involved in the batch as a modifier contribute to get homogeneous melt at moderate temperatures, to decrease the glass transition temperature, to adjust glass viscosity and to improve the wettability of glasses. Chemical compositions of some alkali containing glasses employed as sealants in SOFC are summarized in Table 2.1[34, 35, 60-67]. Alkali alkaline−earth aluminosilicate seal glasses generally contain 20−45 mol% of network modifiers with the molar ratio (Na2O+K2O)/(CaO+MgO) varied in the
range 0.03−1.8. Recently D. Coillot et al. [63] reported on alkali aluminosilicate glasses free from alkaline−earth oxides. Properties of some alkali containing aluminosilicate
11
Table 2.1: Some alkali alkaline earth aluminosilicate glass compositions (%) investigated
for SOFCs.
Na2O/K2O CaO/MgO/BaO Al2O3 SiO2 Others Ref.
Mol 10-25 15.0 10.0 45-60 5.0 TiO2 [60] Wt 9.6- 23.8 12.9-13 15.7 41.5-55.6 6.1-6.2 TiO2 Mol 7.3/10 3.34/-/8.23 2.80 66.9 1.43 [61, 62] Wt 6.2/13 2.6/-/17.4 3.9 55.4 1.43 Wt -/5-10 -/-/10-15 0-15 20-25 5-10 ZnO 45-50 Bi2O3 [34] Mol 13/4 - - 65-75 0-10 B2O3 1 La2O3 7 ZrO [63] Wt 11.6/5.4 11.7/5.5 - - 56-65.5 0-10 B2O3 4.7 La2O3 12.4 ZrO Mol 9-12 24-26 16-18 53-58 - [35, 64, 65] Wt 9.4-11.3 20.4-22.1 24.8-27.8 48.4-52.8 - Mol 1.3 6.2 1.3 39.7/0.5 40.9/- 36.8/0.4 13.4 11.2 12.4 45 36 41.8 - 1La2O3/4.7ZnO 7.3 ZnO [65] Wt 1.3 5.7 1.2 34.8/0.3 34.2/- 31.6/0.27 21.4 17.1 19.4 42.2 32.3 38.4 - 5La2O3/ 5.7ZnO 9.1 ZnO Mol 10-12.1 22.2-25.6 6.1-7.3 51.7-57 8-10 [68] Wt 10-12 20-23 10-12 50-55 8-10 Mol 18-23 18 9 40-45 10 B2O3 [64] Wt 17.3-22.1 15.6-15.7 14.2 37.2 -42 10.8 B2O3
12
Table 2.2: Properties of some aluminosilicate glass and glass−ceramic compositions
Tg, ºC Ts, ºC Tp, ºC Density (gcm−3): Glass/GC CTE (10−6 K−1): Glass/GC Ref.
Alkali alkaline earth silicate
562-654 589-709 Tp1:705-831 Tp2:864-965 - 8.19-8.88/8.27 (200-550) [60] 468-486 540-600 - - 11 [61, 62] 470-480 530-575 - - 9.41-11.2 (50-460) [34] 610-630 675-692 - - 7.5-8.3 [63] 670 740 Tp1:830 Tp2:940 - -/10.7 [35] [22,73,74] 700-780 - Tp1:780-1020 Tp2:900 - 7.8-9.7(200-400)/ 10 (RT-800) [65] 670 740 - 9.4-9.8(300-500)/ 10.7(RT-800) [68] 545-580 680-740 - 9.3-11.2 (200-400) [64]
Alkaline earth silicate
730 750 - -/3-3.10 11.2 [69] 619 682 - - 10.5 (RT-500 ºC) 11.8 (200-800 ºC) [47, 70-72] 666-699 - 780-833 - 8-8.3 [73] 627-730 657-765 844-903 - 7.9-8.3 (200-600) [74] 645 693 - - 11.76/11.68 [75] 685 741 - - 11.87/11.63 (RT-680) [76] 630 685 - - 11.80/12.40 (RT-630) [76] 685 741 - - 11.6/11.9 (RT-Ts) [77] 712-800 748-838 - 3.6-4.19 8.4-10.7/8.5-10.1 [78] 584-650 - 779-789 - 11.4-13/12-13 [79] 640-722 664-745 Tp1:820-890 Tp2:860-930 3.6-3.8 10.5-11.5 (200-650) [80]
13
635-653 673-683 730 - 9.9-11.8/11.3-12.5
(30-500) [81]
611-672 660-712 720-785 3.89 9.9-12.4 (RT-610) [39]
Boron containing alkaline earth silicate
678-718 701-748 775-858 3.69-3.86 -/9.1-10.8 (100-650) [82] 710-724 - 760 - 7.94-8.06/ 8.05-8.43 [83] 690-720 - 807-825 3.4-3.8 7.5-8.5 [84] 650-690 - 766-1074 - 6.84-7.71/ 7.67-8.10 [85] 620 620-735 - - 4.7-7.76 [86] 554-659 660-709 Tp1:821-913 Tp2 :1092-1021 2.67-3.32 8.29-9.72 [87] 775 815 965 - 10.8 [88] 635-775 670-815 10.8 (50-775) [89, 90] 668 745 Tp1:820 Tp2: 864 - 9-12/11 [36, 91-93] - 645-781 655-745 - 9.23-11.17 (200-650) [94] 595-620 - 760-808 3.4-3.8 -/9.5-13.2 (100-750) [95] - 912-937 - 3.24-4.54 4.1-8.1 [96] 601-622 - Tp1:762-838 Tp2:896-907 10.34-10.83 [97] - 656-854 - 2.61-3.92 4.92-10.98 [98] 575-633 628-685 - - 11.2-11.8 (RT-630)/ 10.8-12.5 (RT-1000) [41] Others 655 - 790 - - [55] 576 - - - 9.4 [99] 552 558 - - 11.9 ((275-550)/ 10.1-13.0 [100]
14
glass sealants are shown in Table 2.2 [34, 35, 60-68]. Values of Tg (545−780 ºC) and Ts
(680−740 ºC) were obtained when Na2O introduced in the amount of 1.3−18 mol% whilst
7 mol% K2O containing glasses demonstrated Tg of 470 ºC and Ts of 530 ºC [34].
Substitution of 5 mol% of Na2O for SiO2 in calcium aluminosilicate glass reduced Tg and
Ts by 35 and 60 ºC, respectively, and also increased CTE from 9.2 × 10⁻⁶ up to 11.2 ×
10−6 K−1 [64]. On the other hand, the substitution of 15 mol% Na2O for SiO2 in calcium
aluminosilicate glasses was found to increase Tg and Ts by 92 ºC and 120 ºC
respectively, whilst CTE decreased from 8.9 × 10⁻⁶ down to 8.2 × 10⁻⁶ K−1 [60]. Values
of Tg (468−630 ºC) and Ts (540−692 ºC) were obtained in Na2O (7.3−13 mol%) and K2O
(4−10 mol%)−containing glasses [61-63]. Additionally, lowest values of Tg and Ts were
revealed when low field strength K+ ion was incorporated in silicate glasses. Generally, it is well known that incorporation of alkali ions at the expense of glass formers resulted in disruption of silicate network owing to the increasing number of NBO. Fewer changes in silicate network will occur when alkali ions substitute for alkaline−earth ions. Nevertheless, network disorder increases with growing (Na2O+K2O)/(CaO+MgO) molar
ratio causing Tg and Ts diminishing (Fig. 2.3a). Consequently, with increasing
(Na2O+K2O)/(CaO+MgO) molar ratio Tg decreases from 780 to 562 ºC and Ts from 740
to 600 ºC.
Fig. 2.3: Variation of glass transition (Tg) and glass softening point (Ts) with respect to
(a) (Na2O+K2O)/(CaO+MgO) (b) (BaO+SrO)/(CaO+MgO) molar ratio in some alkali
alkaline earth aluminosilicate glass compositions (see Tables 2.1,2.2 and 2.3). 800 700 600 500 1.6 1.2 0.8 0.4 0.0
[Na2O+K2O]/[CaO+MgO] mol ratio
Temperature (ºC) Tg Ts 800 700 600 500 7 6 5 4 3 2 1
[BaO+SrO]/[CaO+MgO] mol ratio
Temperature (ºC)
Tg Ts
15
Fig. 2.4: Variation of the coefficients of thermal expansion (CTE) as function of the
(Na2O+K2O)/(CaO+MgO) molar ratio in some alluminosilicate glass compositions and
(BaO+SrO)/(CaO+MgO) ratio in alluminosilicate compositions investigated for SOFCs (based on the data from Tables 2.2, 2.3 and 2.4).
Fig. 2.4 shows the variation in CTE of alkali containing alkaline−earth aluminosilicate glasses with respect to (Na2O+K2O)/(CaO+MgO) molar ratio. CTE of
glasses increased from 7.8 to 10.7 × 10⁻⁶ K−1 when (Na
2O+K2O)/(CaO+MgO) ratio
changes in the range 0 to 0.4, and then decreased down to about 8.2 × 10⁻⁶ K−1. CTE
values are stabilized with the further increase in (Na2O+K2O)/(CaO+MgO) molar ratio,
between 0.6 to 1.7. This anomalous behaviour can be explained on the basis of mixed modifier ions presence and their distribution in the glasses. When mixing the high− and low−field−strength cations (e.g., Mg2+ and K+, respectively) to the aluminosilicate, the
high field−strength cation is consistently favoured to form the NBO’s while low field strength ions behave as charge compensators. On the other hand, when pair of cations with the similar ionic radii but different charges (e.g., Ca2+ and Na+, respectively) is mixed, the charge difference apparently plays an important role in the preference to the formation of dissimilar pairs primarily in order to maximize a homogeneous distribution of charges in the glasses. Non−random distributions of modified cations in Ca−Na silicate glasses due to the similar ionic radii affect the dynamics of Na+ and related
13 12 11 10 9 8 7 6 1.6 1.4 1.2 1.0 0.8 0.6 0.4 0.2 0.0 7 6 5 4 3 2 1
0 [BaO+SrO]/[CaO+MgO] mol ratio
[Na2O+K2O]/[CaO+MgO] mol ratio
CTE ( x 10 -6 K -1 ) 8YSZ Sanergy HT Crofer 22 APU
16
properties in the glass [101]. The desired CTEs, (9−11) × 10−6 K−1, have been obtained
when the glasses featured (Na2O+K2O)/(CaO+MgO) ratio in the range 0.1−0.5 (Fig. 2.4).
As a matter of fact, most of the glass/glass–ceramic candidates investigated up to now contain no alkali metals and the impact of alkali appears unclear. Some alkali metal−containing glasses used for sealants in SOFC enhance the chromium vaporization from metallic interconnects by the formation of very volatile Na2CrO4 and K2CrO4
species [23]. Chou et al. [61, 62] discussed the compatibility between Crofer22APU interconnects and potassium oxide containing glasses. The addition of K2O in the parent
glass sealant led to de−bonding of the sealant from Crofer22APU due to alkaline−earth chromates formation. No discussion about corrosion mechanism, like alkali chromates formation and their volatility, on as−received Crofer22APU has been presented. Kaur et al. [60] studied the microstructure at the interfaces of Crofer22APU and glass with varying Na2O content from 10 to 25 mol%. The diffusion couple between Crofer and
glass (10 mol % Na2O) was found to show a good and smooth interface; no traces of Na+
were observed. Several investigations [35, 60, 61, 63] stated that alkali metals role is still unclear, and thus their drawbacks may be smaller than expected and it may be advantageous to keep them in glass seal composition. For instance, Smeacetto et al. [67] have extensively studied alkali−containing alkaline earth aluminosilicate glasses and found that glasses containing a low amount of sodium oxide can be used as sealing material for SOFCs. Further, Smeacetto et al. [67] have also evaluated the performance of Na2O−containing GC sealant in two SOFC short stack configurations. The GC sealant
was reported to have a good chemical and thermo mechanical compatibility with both Crofer22APU and yttria−stabilized zirconia (YSZ) components. At the same time, one should note that potential effects of Na+ presence are not limited to the GC|YSZ and GC|interconnect interfaces. In particular, high surface diffusivity of Na+ may cause poisoning of the electrodes; sodium incorporation in the solid electrolyte grain boundaries may lead to worse mechanical strength and, often, higher electrical resistivity of stabilized zirconia (e.g., [102] and references cited). These effects associated with a slow degradation in the SOFC performance with time cannot be ignored in the seal developments and require long−term testing of such sealants.