Research Article
Raquel P. F. Guiné, Paula Correia, Marcela Leal, Ivana Rumbak, Irena C. Bari
ć,
Drazenka Komes, Zvonimir Satali
ć, Marijana M. Sarić, Monica Tarcea, Zita Fazakas,
Dijana Jovanoska, Dragoljub Vanevski, Elena Vittadini, Nicoletta Pellegrini, Viktória Sz
űcs,
Júlia Harangozó, Ayman EL
-Kenawy, Omnia EL-Shenawy, Erkan Yalçın, Cem Kösemeci,
Dace Klava, Evita Straumite, Manuela Ferreira, So
fia G. Florença*
Cluster analysis to the factors related to
information about food
fibers: A multinational
study
https://doi.org/10.1515/opag-2020-0060 received May 05, 2020; accepted June 18, 2020
Abstract: The adequate intake of dietary fibers is essential to human health. Hence, this study intended to evaluate the level knowledge of about foodfibers and investigate what factors might be associated with it. A descriptive cross-sectional study was conducted on a sample composed of 6,010 participants from ten different countries. The survey was based on a questionnaire of self-response, approved and complying with all ethical
issues. The data collected were subjected to the factor analysis (FA) and the cluster analysis (CA). Validation was done by splitting the data set into two equal parts for confirmation of the results. FA concluded that ten from the 12 variables used to measure the knowledge about dietary fibre (DF) should be grouped into two dimensions or factors: one linked to health effects of DF (α = 0.854) and the other to its sources (α = 0.644). CA showed that the participants could be divided into three groups: Cluster 1– good knowledge both about sources and health effects of DF; Cluster 2 – good knowledge about the sources of DF but poor knowledge about its health effects; Cluster 3 – poor knowledge both about
sources and health effects of DF. The data were
appropriate for the analysis by means of factor and CA, so that two factors and three clusters were clearly identified. Moreover, the cluster membership was found varying mostly according to the country, living environ -ment, and level of education but not according to age or gender.
Keywords: food fiber, factor analysis, cluster analysis, sources offiber, survey
1 Introduction
Dietaryfiber (DF) is originally present in plant foods and comprises polysaccharides and lignin, which resist hydrolysis processes by the enzymes present along the digestive system in humans. They include cellulose and hemicellulose or modified celluloses, gums, mucilages, lignin, and finally pectins and oligosaccharides (Nieto Calvache et al. 2015; Sumczynski et al. 2015). Previously, DF was classified as being soluble or insoluble according to the physiologic effects that were produced by different
Raquel P. F. Guiné, Paula Correia: CI&DETS/CERNAS Research Centres, Polytechnic Institute of Viseu, Viseu, Portugal
Marcela Leal: Faculty of Health Sciences, Maimonides University, CABA, Argentina
Ivana Rumbak, Irena C. Barić, Drazenka Komes: Faculty of Food Technology and Biotechnology, University of Zagreb, Zagreb, Croatia
Zvonimir Satalić, Marijana M. Sarić: Department of Health Studies, University of Zadar, Zadar, Croatia
Monica Tarcea, Zita Fazakas: University of Medicine and Pharmacy from Tirgu-Mures, Tirgu-Mures, Romania
Dijana Jovanoska, Dragoljub Vanevski: Public Health Institute, Centre for Public Health, Tetovo, Macedonia
Elena Vittadini, Nicoletta Pellegrini: Department of Food Science, University of Parma, Parma, Italy
Viktória Szűcs, Júlia Harangozó: National Agricultural R&I Centre– Food Science Research Institute, Budapest, Hungary Ayman EL-Kenawy: Genetic Engineering Institute, University of Sadat City, Sadat City, Egypt
Omnia EL-Shenawy: Department of Psychology, Faculty of Arts, Menofiya University, Shebin Elkom, Egypt
Erkan Yalçın, Cem Kösemeci: Department of Food Engineering, Abantİzzet Baysal University, Merkez/Bolu, Turkey
Dace Klava, Evita Straumite: LUA Latvia University of Agriculture, Jelgava, Latvia
Manuela Ferreira: UICISA:E-IPV Research Centre, Polytechnic Institute of Viseu, Viseu, Portugal
* Corresponding author: Sofia G. Florença, FCNAUP, University of Porto, Oporto, Portugal, e-mail: sofi[email protected]
Open Access. © 2020 Raquel P. F. Guiné et al., published by De Gruyter. This work is licensed under the Creative Commons Attribution 4.0 International License.
types of fibers. Nevertheless, the usage of such termi-nology was discouraged by many agencies and/or organizations such as the Institute of Medicine report and the National Academy of Sciences Panel on the Definition of DF (Slavin 2008, 2005). It has been shown that DF originating from diverse sources can have different physiological and metabolic effects. This is owing to the fact that DF comprises many different macromolecules, each one with distinctive physical and chemical characteristics. For example, the ion exchange capacity and the viscosity are intensely associated with the metabolism of sugars and lipids, while other properties such as particle size and granulometry, fermentation pathways, and bulking effects are power-fully associated with the functions in the colon(Guillon and Champ 2000).
Typically, foods like fruits and vegetables or whole grain cereals, seeds, and nuts are very rich in DF, being cereals undoubtedly the most relevant usual sources of DF. However, the recognition that the DF from fruits and vegetables is of higher quality has contributed for an increased consumption of these foods (Hincapié et al. 2014). The recommended daily intake of DF differs according to the organization(World Health Organization/
Food and Agricultural Organization [WHO/FAO],
American Health Foundation[AHF], American Diabetes Association [ADA], Dietary Reference Intake [DRI]); however, a joint communication from WHO/FAO recom -mends a minimum of 25 g/day of DF, which should, however, be obtained from different sources as much varied as possible(Carvalho et al. 2009; Martinho et al. 2013). Human diets have been changed over the time, and recently, there is an increased consumption of refined cereals, meats, added fats especially saturated fats, and refined sugars, while less consumption of proteins of vegetable origin and DF (Hall et al. 2010; Kendall et al. 2010; O’Neil et al. 2010). Furthermore, in general, diets poor in fiber are normally also poor in micronutrients essential for the human body (like vitamins, dietary minerals, or phytochemicals) and high in sugars, salt, rapidly digested starches, and fats, all factors that contribute for an unhealthy diet(Mann and Cummings 2009). This change in diet, associated with other factors, is greatly responsible for the increasing incidence of many diseases(Mann and Cummings 2009; Kendall et al. 2010).
DF has been recognized as being healthy for humans since long ago, so much that the European Food Safety Authority allows health claims about its proved benefits (Mackie et al. 2016). Several beneficial health effects have been attributed to an adequate intake of DF, as
demonstrated by countless scientific studies, both in vivo andin vitro, thus DF being an essential component of a healthy diet(Macagnan et al. 2015). The benefits of DFs are extended to the treatment and the prevention of diseases such as diverticular disease, inflammatory bowel disease (Crohn’s disease), constipation, cardio-vascular disease, obesity, hyperlipidemia, hypercholes -terolemia, hyperglycemia, and gastrointestinal-related types of cancer (Kendall et al. 2010; Kaczmarczyk et al. 2012; Stephen et al. 2017). Furthermore, DF demon-strated capacity to exchange many cations and espe -cially some toxic ones, thus helping to eliminate them in the feces and also absorbing some dangerous substances like heavy metals or pesticide residues associated with disease(Hong et al. 2012).
Notwithstanding the positive effects of DF men-tioned earlier, some studies also alert to possible negative effects associated with the ingestion of DF, for example, some possible interference with the absorption of compounds like minerals or vitamins (Hernández et al. 1995). Still, it is not probable that adults with a good health status who consume DF according to the recommendations might experience problems related to the absorption of nutrients(Slavin 2008).
Because the health benefits related to DF come directly from an adequate consumption, having in mind the recommended dosages, the people’s attitudes are fundamental to effectively consume diets that provide them with the correct amounts of the necessary nutrients and bioactive compounds or functional ingredients. However, the dietary patterns are not always the most adequate for many reasons, such as lack of time, stress, and social constraints or simply due to insufficient information. Therefore, it is believed that knowledge may alter people’s behaviors toward healthier food choices. Measuring the level of knowledge about DF may constitute a way of inferring about a better or worse global involvement in consuming higher amounts of healthier foods such as vegetables and fruits as well as whole cereals instead of refined ones. These attitudes may at long term produce good results in terms of better public health and lower the costs associated with some chronic diseases due to poor healthy eating habits (Martinho et al. 2013; Ferreira et al. 2016).
The objective of this study is to characterize the clusters that have the level of knowledge demonstrated about DF, assessed through correct or incorrect an -swering to questions related to DF, on a sample of people from 10 different countries from three continents (Europe, America, and Africa). The knowledge about DF was evaluated based on the following aspects:
animal/vegetable origin of DF, the richness in DF in foods made from whole cereals or in fruits with peel, the possible benefits of DF for an improved health in general or for some particular diseases such as cardiovascular diseases, obesity, diabetes, constipation, or some types of cancer. Furthermore, the variables related to knowl -edge about DF were grouped into some factors, which were subsequently used to aggregate the participants into different clusters according to their knowledge. The identification of the clusters and their characterization may give important guidelines for planning educational programs and promoting healthier food choices.
2 Methods
2.1 Instrument
The questionnaire that was used for the survey was structured into different parts, beginning with a first part about the sociodemographic characteristics(age, gender, level of education, country, and living environment) and then sections with questions about DF and its influences on human health. The respondents were asked to answer on a Likert scale with five points between one (corre-sponding to totally disagree) and five (corresponding to totally agree). The sentences included in the question-naire and considered for this study(some of them after inversion) are presented in Table 1. The instrument was previously validated by Guiné et al.(2016a).
2.2 Data collection
The methodological study was conducted through a survey by means of a questionnaire applied to a sample of over 6,000 participants from ten different countries from Europe, America, and Africa. The countries participating in the study were as follows: Argentina, Croatia, Egypt, Hungary, Italy, Latvia, Macedonia, Portugal, Romania, and Turkey, which had been working together on a multinational framework about foodfibers.
In each country, the data collection included people from both genders, with different levels of education and different living environments. It was intended to obtain a sample as munch diverse as possible in all countries to become representative of each reality and social involvement. Nevertheless, the selection was by convenience in all participating countries. The questionnaire was applied by direct interview only to adult citizens, and each participant answered the questionnaire voluntarily after giving verbal informed consent. It was taken care to include different sectors of the population, like age, level of education, sex, or marital status. In addition, geogra -phical area of residence was also considered, so that people from different cities and smaller villages were included from each participating country. All the answers provided by the participants were kept anonymous, and the personal data were not collected, so it would be impossible to relate answers with participants individually, thus protecting the privacy of the participants. All ethical concerns were taken into
account when planning the research and while
applying the questionnaire or when treating the data. The research was previously approved by the ethical committee(REF. 03/2015).
2.3 Statistical analysis
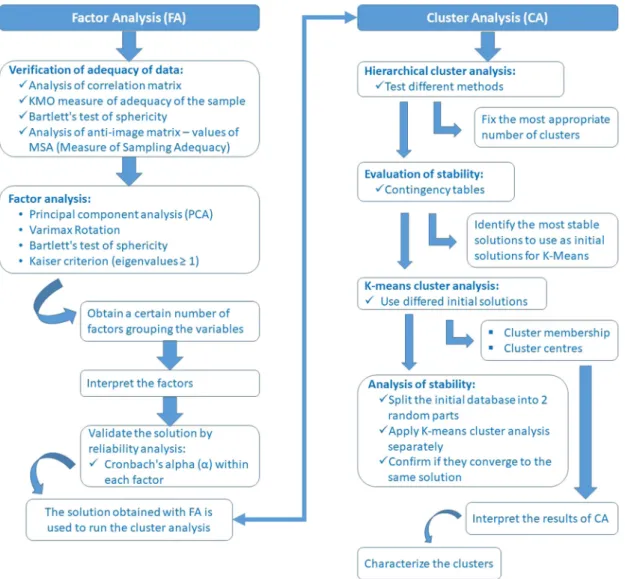
The techniques used in this study were factor analysis (FA) and cluster analysis (CA). First, exploratory FA was applied using the principal component analysis (PCA) methodology to observe if there was any kind of aggregation structure between different statements relating to the knowledge about DF. The factors identified were subjected to CA by different methods, some hierarchical and some partitive, to perceive if a cluster structure would come out to classify the participants surveyed.
Table 1: Statements relative to knowledge about dietaryfibre Variable Statement
V-1 Only plant foods havefibers
V-2 Foods from animal origin do not containfibers (unless added)
V-3 Whole foods have(made from whole cereals) are richer infiber
V-4 The fruits with the peel are richer infiber V-5 Eating adequate amounts of dietaryfiber can
prevent and treat diseases
V-6 Fibers can prevent and treat cardiovascular diseases V-7 Fibers can prevent and treat cholesterol
V-8 Fibers can prevent and treat bowel cancer V-9 Fibers can prevent and treat obesity V-10 Fibers can prevent and treat breast cancer V-11 Fibers can prevent and treat constipation V-12 Fibers can prevent and treat diabetes
2.3.1 FA
The data were tested to verify if it were appropriate for the application of FA by PCA. The correlation matrix between all the variables accounting for the statements in the questionnaire was analyzed to evaluate the strength of correlations. The Kaiser–Meyer–Olkin (KMO) measure of adequacy of the sample was also calculated, the Bartlett’s test was applied to confirm the possible intercorrelation between the studied variables (Broen et al. 2015). After having confirmed that the data were adequate for the application of FA, using extraction by the PCA method with Varimax rotation and the Kaiser normalization, the number of components is determined by the Kaiser criterion(eigenvalues ≥ 1) and also by the scree plot. In all cases, the percentage of variance explained by the factors extracted was assessed by the
communalities(Broen et al. 2015). The factor loadings for which the absolute value was less than 0.4 were excluded from the analysis, and variables with at least
16% of their variance were included (Rohm and
Swaminathan 2004; Stevens 2009). The internal consis-tency in each factor was determined by the Cronbach’s alpha(α) (Tanaka et al. 2000; Broen et al. 2015).
2.3.2 CA
Five hierarchical methods were used using the two factors obtained by FA (average linkage – between groups, average linkage– within groups, complete linkage– furthest neighbor, centroid, and ward). This procedure allowed estimating the most adequate number of clusters to form based on the evaluation of the
coefficients obtained in the agglomeration schedule. These solutions were subsequently compared by means of contingency tables to verify potential stability.
After fixing the number of clusters in three, the partitive method of k-means was used, because it is particularly recommended and frequently used in CA (Dolnicar 2002). The application of k-means was made to those solutions that appeared to be more stable, thus eliminating the solution obtained by the method complete linkage– furthest neighbor. The results showed that the four initial solutions tested converged all to the samefinal solution, and this was later analyzed for stability by dividing the initial database into two parts for repetition of the CA procedures. According to Dolnicar(2002), this repetition constitutes an easy way to evaluate the confidence in the results of CA.
Software SPSS, form IBM Inc, version 22 was used for all the analyses. Figure 1 presents aflowchart explaining schematically the statistical procedures followed in the analyses.
3 Results
3.1 Sample characterization
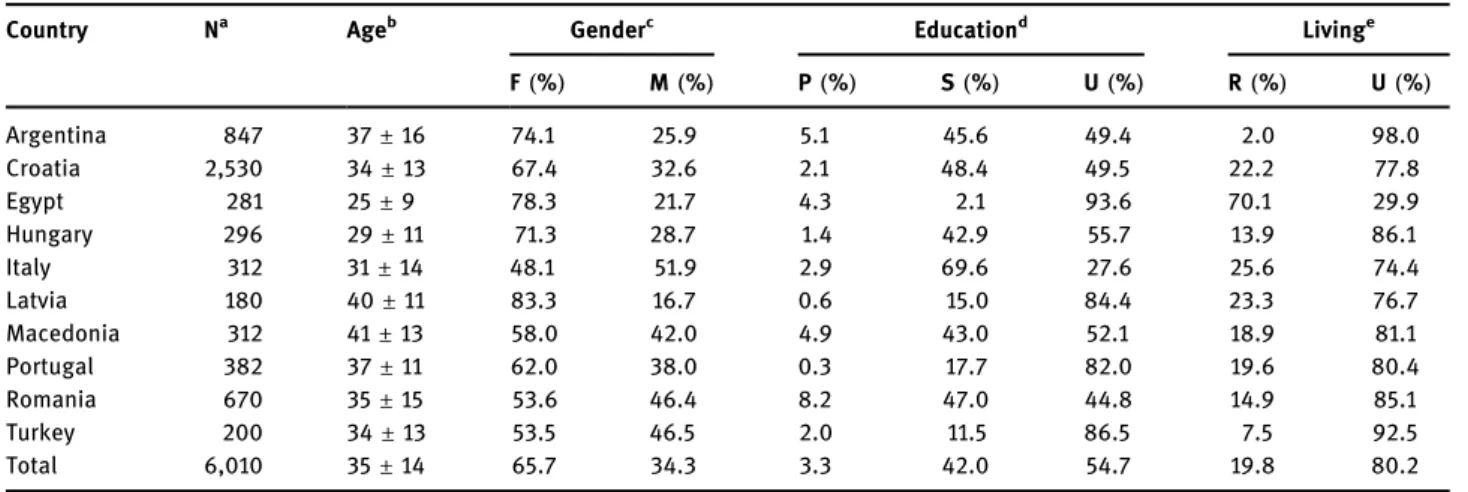
This study was carried out simultaneously in 10 countries situated in three continents (Europe, America, and Africa), presented in Table 2, which includes a character-ization of the sample per country.
The majority of the participants were women(65.7%), with 34.3% of men. The age of the participants varied from 18 to 84 years, being on average 35 ± 14 years, although the average age of the women was slightly lower (34 ± 13 years) when compared to the average age of the men (37 ± 14 years). The results presented in Table 2 further show that, in general, the participants from Egypt were younger(aged 25 ± 9 years), while the participants from Macedonia were of average age(41 ± 13 years).
Most of the participants evidenced a high level of education (55% had completed a university degree), whereas 42% had completed secondary school and only 3% had completed the lowest level of education(primary school). This trend was observed for most countries, with exception for Italy, where most of the participants (∼70%) had secondary school, followed by Romania, with 47% of participants with the secondary school.
Most of the participants lived in an urban environ -ment(80.2%), while 19.8% lived in rural areas. In most countries, the majority of the participants were from urban zones, but in the case of Egypt, most of the samples were from rural areas.
3.2 FA
3.2.1 Evaluation of adequacy of data
The correlation matrix confirmed that there were some associations between the variables, with 20 values higher than 0.4. The highest value was 0.627, which
Table 2: Characterization of participants by country
Country Na Ageb Genderc Educationd Livinge
F(%) M(%) P(%) S(%) U(%) R(%) U(%) Argentina 847 37± 16 74.1 25.9 5.1 45.6 49.4 2.0 98.0 Croatia 2,530 34± 13 67.4 32.6 2.1 48.4 49.5 22.2 77.8 Egypt 281 25± 9 78.3 21.7 4.3 2.1 93.6 70.1 29.9 Hungary 296 29± 11 71.3 28.7 1.4 42.9 55.7 13.9 86.1 Italy 312 31± 14 48.1 51.9 2.9 69.6 27.6 25.6 74.4 Latvia 180 40± 11 83.3 16.7 0.6 15.0 84.4 23.3 76.7 Macedonia 312 41± 13 58.0 42.0 4.9 43.0 52.1 18.9 81.1 Portugal 382 37± 11 62.0 38.0 0.3 17.7 82.0 19.6 80.4 Romania 670 35± 15 53.6 46.4 8.2 47.0 44.8 14.9 85.1 Turkey 200 34± 13 53.5 46.5 2.0 11.5 86.5 7.5 92.5 Total 6,010 35± 14 65.7 34.3 3.3 42.0 54.7 19.8 80.2 aN
= number of participants.bAge given as mean value
± standard deviation.cGender: F
= female, M = male.dEducation: P
= primary school, S= secondary school, U = university degree.eliving environment: R= rural, U = urban.
corresponded to the correlation between the variables V -6 and V-7. The values reflect some important correlations between the variables, thus making possible to apply the technique of FA. Also the results of the Bartlett’s test confirmed that FA could be applied to this problem because the p-value was significant (p < 0.001), hence leading to the rejection of the null hypothesis H0:“The correlation matrix is equal to the identity matrix.”
The KMO value was good (0.850) according to the classification proposed by Kaiser and Rice (1974), thus confirming the suitability of the data to be submitted to PCA and FA. The analysis of the anti-image matrix (Table 3) revealed that none of the values of measure of
sampling adequacy (MSA) was less than 0.5, which
implies that all the variables were adequate to be included in the analysis.
3.2.2 FA solution with Varimax rotation and extraction by PCA
The rotated solution obtained from the analysis by FA with PCA resulted in three components according to the Keiser criterion to include eigenvalues greater than 1 (3.642, 2.328, and 1.828 in the present case), and this was also confirmed by the scree plot (graph not shown). The percentages of total variance explained by the three factors were as follows: F1, 27.9%; F2, 17.8%; F3, 14.0%, with a total variance explained of 59.7%.
The variable V-1 had the largest fraction of its variance explained by the solution, corresponding to 79.7%, followed by variable V-4, with 75.1% of the variance explained. Only the variable V-10 had a lower communality (0.388), thus indicating that only about 40% of its variance was explained by the solution extracted by FA, and all other variables had commun -alities higher than 0.400.
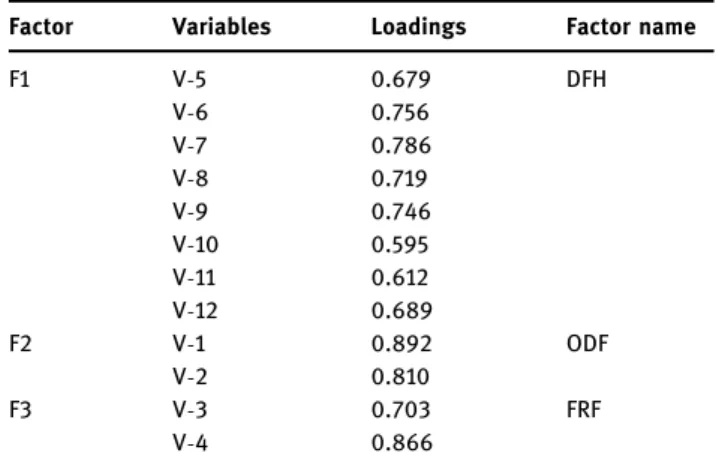
The rotation algorithm converged in four iterations and produced three factors(Table 4). One factor (F1) was
clearly linked to the associations between DF and different benefits for the human health; the other factor (F2) related to the statements about the origin of DF; and the third factor(F3) was associated with the statements that referred to the foods with higher content of DF. In relation to factor 1, all loadings were relatively high, with the lowest being 0.595 for variable V-10 followed by 0.612 for variable V-11, thus indicating that the answers obtained for the effects of DF on constipation and breast cancer did not contribute so strongly for the definition of this factor as those variables with higher loadings, such as the case of variables V-7, V-6, and V-9 (with loadings of 0.786, 0.756, and 0.746, respectively), thus factor 1 being more strongly associated with the effect of DF on cholesterol cardiovascular diseases and obesity. The results presented in Table 4 also reveal that the correla -tions of those variables most strongly linked to factor 2 are considerably higher(greater than 0.8) when compared to that of those variables most toughly linked to factor 1(less than 0.7), indicating that people were generally aware of the plant nature of DF. Finally, factor 3 also had variables with high loadings(0.703 and 0.866, corresponding to the content of DF in whole foods and in fruits with the peel, respectively). Since all the variables with loadings higher than 0.4 were encompassed in the solution, this is a satisfactory solution when including all the 12 variables (Stevens 2009). Finally, this solution produced a grouping pattern that can be easily interpreted.
3.2.3 Validation of the solution by Cronbach’s alpha The validation was achieved by calculating Cronbach’s alpha (α), which determines the internal consistency
Table 3: Anti-image MSA values for the 13 variables included in the study
Variable No. MSA Variable MSA
V-1 0.894 V-7 0.894 V-2 0.856 V-8 0.894 V-3 0.879 V-9 0.551 V-4 0.899 V-10 0.615 V-5 0.896 V-11 0.660 V-6 0.827 V-12 0.599
Table 4: Results of the FA solution with extraction by PCA and Varimax rotation
Factor Variables Loadings Factor name
F1 V-5 0.679 DFH V-6 0.756 V-7 0.786 V-8 0.719 V-9 0.746 V-10 0.595 V-11 0.612 V-12 0.689 F2 V-1 0.892 ODF V-2 0.810 F3 V-3 0.703 FRF V-4 0.866
within each of the factors(Broen et al. 2015). The value of Cronbach’s alpha for factor 1 (DFH) was 0.854, which is good(Davis 1964; Maroco and Garcia-Marques 2006; Hair et al. 2009). In addition, the elimination of any of the eight variables did not prove to increase the value of alpha, and so it is concluded that this factor presented a good internal uniformity. Regarding factor 2(ODF), the value of alpha was 0.644, which according to some authors could be acceptable (Davis 1964; Maroco and Garcia-Marques 2006; Hair et al. 2009) although a value equal to 0.7 or higher would be desirable (Maroco and Garcia-Marques 2006; Hair et al. 2009). With respect to factor 3 (FRF), the value of alpha was low (0.440), thus indicating that the internal consistency of this factor is weak.
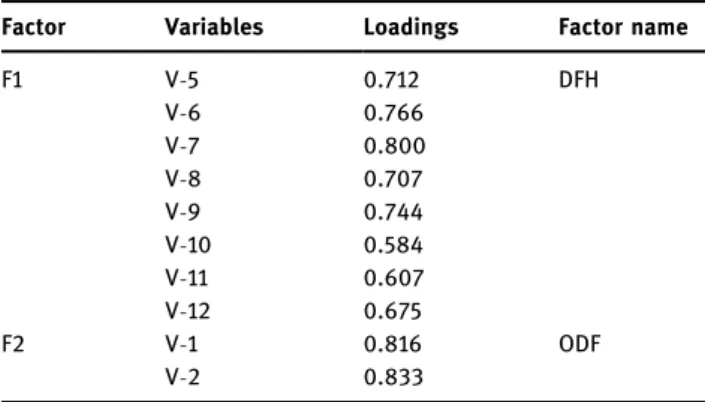
3.2.4 Final FA solution
In this way, a new FA was performed by eliminating the variables V-3 and V-4, by applying the same methods and options as described earlier. The value of KMO was
good(0.856), and the results of the Bartlett’s test lead to the rejection of the null hypothesis H0: “the correlation matrix is equal to the identity matrix” (p < 0.001). Based on the Keiser criterion to consider eigenvalues greater than 1, two components were retained (eigenvalues equal to 4.043 and 1.505). The percentages of total variance explained were as follows: F1, 39.6% and F2, 15.9%, summing 55.5% of total variance explained. The rotation converged in three iterations and resulted in two factors, as presented in Table 5, with acceptable or even strong loadings for all variables in both factors. The values of Cronbach’s alpha were 0.854 and 0.644, respectively, for factor 1(DFH) and factor 2 (ODF), being the first good and the second acceptable (Davis 1964; Maroco and Garcia-Marques 2006; Hair et al. 2009).
3.3 CA
3.3.1 Hierarchical clustering analysis (agglomeration methods)
The CA was applied to the data obtained by FA, but considering only factors 1 and 2, in view of the results obtained for Cronbach’s alpha for factor 3, which meant that this factor was not consistent. The CA was applied by different hierarchical methods to determine the most adequate number of clusters: average linkage– within groups, average linkage– between groups, complete linkage– furthest neighbor, centroid, and ward.
Figure 2 presents the coefficients (corresponding to the distances) as a function of the number of groups
obtained by two of the methods (centroid and the
average linkage within groups). The last 20 values obtained in the agglomeration schedule were used since
Table 5: Final FA solution with extraction by PCA and Varimax rotation
Factor Variables Loadings Factor name
F1 V-5 0.712 DFH V-6 0.766 V-7 0.800 V-8 0.707 V-9 0.744 V-10 0.584 V-11 0.607 V-12 0.675 F2 V-1 0.816 ODF V-2 0.833
others were considerably smaller and therefore negligible. Both graphs shown in Figure 2, as well as others corresponding to the others methods(not shown), suggest the formation of three groups because the coefficients after that already present a tendency to stabilize, thus con -cluding that the ideal numbers of clusters was three.
The solutions obtained with the five hierarchical methods for the case of three clusters were subsequently compared by means of contingency tables, being the results for the expected similarities between the solu -tions shown in Table 6. The values of the percentages indicated that the solutions obtained by the methods centroid and average linkage(between groups) were the most similar, with a very high percentage of the cases allocated to the same clusters(96%). Also the solutions WARD ad average linkage(within groups) present a high similarity(87%).
3.3.2 K-means clustering analysis
From the obtained results, it was concluded that the advised number of clusters was 3 and the possible initial solutions to use by the k-means method are centroid,
ward, average linkage (within groups), and average linkage (between groups) due to the high similarity, indicative of potential stability.
Conveniently, the k-means method applied to the four different initial solutions obtained by the hierarchical methods converged to an equal final solution after less than 25 iterations(Table 7), with the same cluster centers (Table 8; just with different cluster number). The fact that all four initial solutions converged into a same final solution is indicative of stability. The values of the statistic F in ANOVA are high, thus confirming the resemblance between the cases within the groups and the dissimilarities between groups. The values ofF further show that the two factors equally contribute for the discrimination of the groups because they are of the same order of magnitude for both factors: Factor 1: DFH– DF and health; Factor 2: ODF– Origin of dietary fiber (Table 7). In the final solution, two of the clusters gather approximately 2,000 members (2,069 and 2,044, more precisely), while a third cluster has slightly less members(1,743).
3.3.3 Analysis of stability
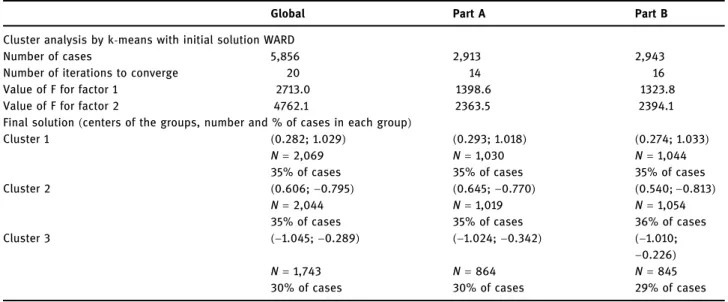
To evaluate if the solution was stable, the database was separated into two parts that were then treated sepa -rately, with a random selection of cases for each half. The techniques used were similar to the treatment applied to the global data set, but in this case, the number of cluster was already fixed as 3, and only one initial solution was used for the k-means (obtained by the method ward). Table 9 presents the results obtained for each of the halves together with those for the global solution to allow an easier comparison. The convergence was achieved for data sets, and the values ofF are high in all cases (varying from 1323.8 to 4762.1), being very similar between the two parts. Also the final solutions resulting from the analysis are considerably similar
Table 6: Comparison of the solutions obtained with the hierarchical methods Methoda AL-BG (%) AL-WG (%) CL-FN (%) CENT (%) WARD (%) AL-BG — — — — — AL-WG 61 — — — — CL-FN 78 48 — — — CENT 96 60 76 — — WARD 65 87 52 60 —
aAL-BG: average between groups; AL-WG: average
linkage-within groups; CL-FN: complete linkage-furthest neighbor; CENT: centroid.
Table 7: Results of the k-means applied to different initial solutions
Initial solutiona No. of iterations for converging ANOVA statistic
(F) Number of cases Factor 1(DFH)b Factor 2
(ODF)c Cluster 1 Cluster 2 Cluster 3
AL-BG 22 2713.0 4762.1 2,044 1,743 2,069
AL-WG 21 2713.0 4762.1 2,069 2,044 1,743
CENT 19 2713.0 4762.1 2,044 1,743 2,069
WARD 20 2713.0 4762.1 2,069 2,044 1,743
aAL
-BG: average linkage-between groups; AL-WG: average linkage-within groups; CENT: centroid. bDFH: Dietary
fiber and health.
taking into account the group central coordinates and the composition of each group(Table 9).
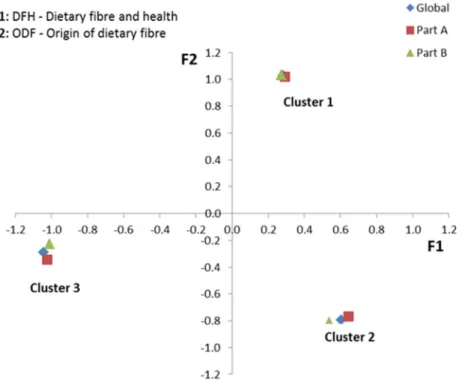
The graph shown in Figure 3 shows the location of the centers of the three clusters regarding the global data set as well as both parts, which are basically coincident. Thus, the splitting of the whole data set allowed
obtaining the same solution, thus confirming the
previously noticed trend for stability.
3.3.4 Interpretation of the results
The results of the final solution (whole sample) are presented in Figure 4. Cluster 1, which corresponds to
35% of the cases, had a high positive value ofF2 (related to knowledge about the origin of DF) and a low positive value ofF1 (knowledge about the health benefits of DF). This indicates that these individuals have a very good
knowledge about the origin of DF (high above the
average, corresponding to the origin of the referential) and a reasonable knowledge about the health benefits (slightly above the average). Cluster 2 also includes 35% of the cases and corresponds to a positive F1 but negative F2, thus indicating individuals with a knowl-edge above average about the health benefits of DF but under the average about its origin. Cluster 3 corresponds to 30% of the cases, and both values for F1 and F2 are negative, indicating a lower than average level of knowledge regarding either the origin or the health effects of DF. Therefore, the groups can be described as follows:
• Cluster 1 – good knowledge both about sources and health effects of DF.
• Cluster 2 – good knowledge about health effects of DF but poor knowledge about the sources of DF.
• Cluster 3 – poor knowledge both about sources and health effects of DF.
3.3.5 Cluster characterization
Regarding age, cluster 1 had higher average age of its members(36.5 ± 13.6 years), followed by cluster 2 (34.0 ± 13.5 years) and finally by cluster 3, with the lowest
Table 8: Cluster centers for the k-means with different initial solutions
Initial solutiona Factors Cluster center
1 2 3 AL-BG Factor 1(DFH)b 0.606 −1.045 0.282 Factor 2(ODF)c −0.795 −0.289 1.029 AL-WG Factor 1(DFH)b 0.282 0.606 −1.045 Factor 2(ODF)c 1.029 −0.795 −0.289 CENT Factor 1(DFH)b 0.606 −1.045 0.282 Factor 2(ODF)c −0.795 −0.289 1.029 WARD Factor 1(DFH)b 0.282 0.606 −1.045 Factor 2(ODF)c 1.029 −0.795 −0.289 aAL
-BG: average between groups; AL-WG: average linkage-within groups; CENT: centroid.bDFH: dietaryfiber and health.cODF: origin of dietaryfiber.
Table 9: Evaluation of the stability of the solution obtained by cluster analysis
Global Part A Part B
Cluster analysis by k-means with initial solution WARD
Number of cases 5,856 2,913 2,943
Number of iterations to converge 20 14 16
Value of F for factor 1 2713.0 1398.6 1323.8
Value of F for factor 2 4762.1 2363.5 2394.1
Final solution(centers of the groups, number and % of cases in each group)
Cluster 1 (0.282; 1.029) (0.293; 1.018) (0.274; 1.033)
N= 2,069 N= 1,030 N= 1,044
35% of cases 35% of cases 35% of cases Cluster 2 (0.606; −0.795) (0.645; −0.770) (0.540; −0.813)
N= 2,044 N= 1,019 N= 1,054
35% of cases 35% of cases 36% of cases
Cluster 3 (−1.045; −0.289) (−1.024; −0.342) (−1.010;
−0.226)
N= 1,743 N= 864 N= 845
average age(32.7 ± 14.0 years). As for gender, all clusters were mostly composed of women, representing 69.9% in cluster 2, 66.6% in cluster 1, and slightly less in cluster 3(59.5%).
The association between cluster membership and level of education is presented in Table 10. While clusters 1 and 2 were mainly composed by people with the highest level of education(university degree) (59.3% and 57.8%), in cluster 3, most of the individuals had a secondary level of education(48.9%), although closely followed by those with a university degree (46.6%).
These results seem to indicate that the level of education influenced the level of knowledge about DF since the lowest knowledge found for the individuals in cluster 3 could be attributed to their lowest educational level.
Regarding the living environment, most of the members of the three clusters lived in an urban environment although these percentages were higher for clusters 1 and 2 (85.1% and 80.4%, respectively) compared to cluster 3 (75.1%). Again, the level of knowledge seems to be related to the living place because cluster 3 shows the lowest knowledge and the percentage of people living in rural areas is higher.
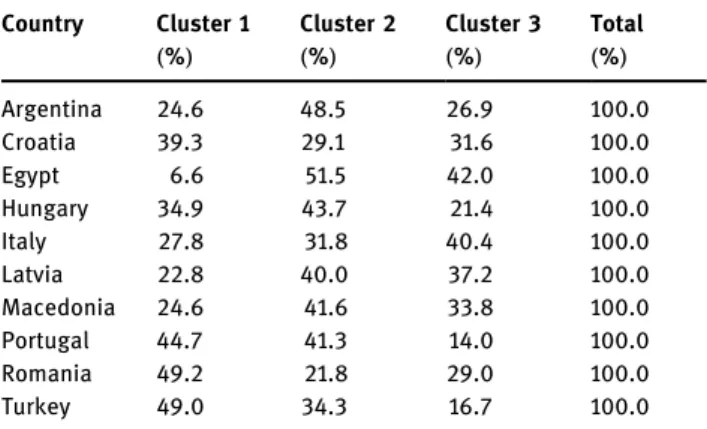
The association between country and the cluster membership is presented in Table 11. The results show that the participants from the different countries are
Figure 3: Location of cluster centers in the global and partial solutions.
Figure 4: Final cluster location in relation to both factors.
Table 10: Association between level of education and cluster membership
Level of education Cluster 1 Cluster 2 Cluster 3
Primary school N 66 48 78 % 3.2% 2.4% 4.5% Secondary school N 774 812 850 % 37.5% 39.8% 48.9% University degree N 1,223 1,179 810 % 59.3% 57.8% 46.6% Total N 2,063 2,039 1,738 % 100.0% 100.0% 100.0%
more or less evenly distributed between the clusters, so no visible effect of country could be seen on the knowledge about DF. There is, however, one exception, Egypt, for which a very low percentage of the partici -pants falls into cluster 1, i.e., not many people in Egypt are well informed about both the sources and the health effects of DF. The results of the Chi square test indicate that there is a significant association between country and cluster membership(χ2= 404.430; p < 0.0005), thus
indicating that country influences the knowledge
about DF.
4 Discussion
The data collected in the present survey were suitable for application of FA based on the correlation matrix, the KMO value, and the Bartlett’s test of sphericity (Broen et al. 2015). All procedures for factor and CA were followed, and the data were fairly described by the factorial solution according to the sources of DF or its health effects, as indicated by the results presented in Table 5, i.e., high loadings for variables V-5 to V-12 in factor 1 and for variables V-1 to V-2 for factor 2.
Regarding the origin of DF, some people seem not fully aware that DF comes from plant foods and much less what type of compounds it comprises(Martinho et al. 2013). It is difficult for people to know that DF consists of lignin and polysaccharides and resist the hydrolysis by enzymes present along the human digestive system(Nieto Calvache et al. 2015; Sumczynski et al. 2015). However, it is less complex for people to identify some typically DF -rich foods such as whole grain cereals, fruits, vegetables, or nuts and seeds and undoubtedly that cereals are most recognized sources of DF, and people may know the
difference between whole and refined cereals. Still their choices may not always be according to their inner knowledge but more to their preferences and habits (Guiné et al. 2016b). The knowledge about the sources of DF was adaptively assessed through statements V-1 to V-4 in Table 1. However, some of the statements were not included in the final solution (Table 5), namely, those regarding the comparison between foods made from whole cereals and from refined cereals or the fact that fruit peels are quite rich in DF. This indicates that the way the participants answered those particular questions was not robust enough revealing a possible lack of knowledge about those aspects.
The prevention of constipation(Martinho et al. 2013) is one of the better known health benefits related to the consumption of DF. Nevertheless, much more effects can be attributed to DF, namely, preventing diseases affecting the intestine and colon, blood glycaemia, cardiovascular diseases, and serum cholesterol or cancer affecting the gastrointestinal system (Kendall et al. 2010; Kaczmarczyk et al. 2012). The knowledge about these effects is somewhat variable, but still far from high levels, as demonstrated in a previous study undertaken solely in Portugal aimed at investigating the same issues (Martinho et al. 2013). Nevertheless, it is important to notice that it is somehow very difficult to identify what would be a satisfactory level of knowledge expected for the populations because there are no guidelines about it. While FAO and other similar organizations recommend daily intake of DF, because they are easily assessed trough nutrient calculations, the level of knowledge about any subject is something far more difficult to measure and much less to define a standard level or a desired level. When people demonstrate higher knowl -edge about any subject, they are able to make more sustained choices, and this is valid for many situations not only eating habits (Dixon and Burton 2014; Hoek 2015; Ghanouni et al. 2016; Salomaa et al. 2016). In the particular case of the knowledge about DF, it is believed that it may have important consequences for public health, giving the many benefits associated with its consumption. In this study, a significant part of the participants demonstrated a high level of knowledge about the health benefits of DF, factor 1, corresponding to the members in clusters 1 and 2, summing 70% of the participants (Table 9). Hence, and given the wide coverage of the study undertaken, one could positively infer that in general people are aware of the positive effects of DF for improving the human health.
There are many factors that can contribute for adoption of less healthy lifestyles and eating patterns,
Table 11: Association between country and cluster membership Country Cluster 1 (%) Cluster 2 (%) Cluster 3 (%) Total (%) Argentina 24.6 48.5 26.9 100.0 Croatia 39.3 29.1 31.6 100.0 Egypt 6.6 51.5 42.0 100.0 Hungary 34.9 43.7 21.4 100.0 Italy 27.8 31.8 40.4 100.0 Latvia 22.8 40.0 37.2 100.0 Macedonia 24.6 41.6 33.8 100.0 Portugal 44.7 41.3 14.0 100.0 Romania 49.2 21.8 29.0 100.0 Turkey 49.0 34.3 16.7 100.0
such as lack of time, stress, economic status, social environments, cultural influences, or eating out of home and in a short time leading to fast food. Appropriate information and knowledge about the health effects of DF might certainly influence people to make additional efforts in consuming appropriate amounts of DF, for which is also important to have information about the sources of DF and those foods that are richer in DF (Guiné et al. 2016c). Hence, knowledge might be a motor to promote better health at long terms and improve public health, while diminishing the high costs asso -ciated with the treatment of chronic diseases(Pagano et al. 2016; Schwarzkopf et al. 2016; Tuppin et al. 2016; Shi et al. 2017). For example, it is estimated that in 1 year heart failure is responsible for 65 billion US dollars of direct care costs plus 43 billion dollars due to lost productivity resulting from morbidity and premature mortality(Hollingworth et al. 2016). Another example is obesity, with an annual medical spending per individual of nearly 2,000 US dollars, accounting for approximately $150 billion in USA alone(Kim and Basu 2016). Both the heart diseases and obesity can be prevented by adopting an adequate lifestyle, with exercise and healthy foods, including foods rich in DF.
The findings from this study suggest that the data were appropriate for CA, and the sample was divided into three clusters according to their level of knowledge on the sources of DF and their health benefits. The CA allowed concluding that the participants in this study could be grouped into clusters revealing a high to low level of knowledge about DF, according to the scale defined in this study. The results showed that while there were very positive indicators about the knowledge concerning the health effects of DF, with 70% of the
participants demonstrating a positive value for
F1 – factor related to the health effects of DF (clusters 1 and 2), in what concerned F2 – factor related to the origin of DF, only 35% of the participants revealed a positive value ofF2 (cluster 1) (Table 9 and Figure 4). These variations could be attributed to the level of education or the living environment more than any other variables evaluated. The people who revealed a higher level of information tend to have higher levels of education and live in urban areas. The more educated people tend to be more curious, critical, and worried about all aspects related to their living including information about what they eat and what this brings
them (Guiné et al. 2016c). Because the variables
influencing the knowledge were identified as living environment and qualifications, future actions to dis-seminate information about these topics could be
designed to target subjects according to those factors. The effectiveness of educational programs intended to improve the quality of life through a better diet based on the knowledge about health benefits of certain foods certainly relies on the ability to reach the target population. This study may help reaching in a more efficient way the people according to their living environment and level of education, with emphasis on those living in a rural environment and with lower education levels. Still, it is important to plan any interventions according to the particular characteristics of the participating countries, namely, in terms of culture, education, and health policies. This study focused on the knowledge about sources and benefits of DF, and we might enable new highlights on how to improve knowledge that does not necessarily imply a direct or easy change in behavior or practices.
This research involved different countries and the choice intended to cover different regions of the globe; however, because it was not possible to include more countries in the survey, the ones included were selected by convenience. Because this study was developed in several countries from different parts of the globe, namely North, Central and South Europe, North Africa, and Latin America, its conclusions could be somewhat understood as with a worldwide cover. A limitation of this study relates to the heterogeneity in the number of cases obtained in each of the participating countries, thus leading to different representations although global the number of participants was high, over 6,000.
5 Conclusion
The FA permitted concluding that from the 12 variables initially used to assess the level of knowledge about DF ten of them could be grouped into two factors, thefirst associated with knowledge about health benefits of DF and the second with the knowledge about the sources of DF. This grouping structure of the variables was subsequently subjected to CA, concluding that the participant in this study could be distributed between three groups base on their knowledge about DF. Thefirst group included people with a good level of knowledge both about the sources and the health benefits of DF; the second group included people with a good level of knowledge about the health effects of DF but a poor level of knowledge about the origin of DF; andfinally the third group included people with a poor knowledge both about the sources and the health effects of DF. It was
further observed that the level of education, the country, and the living environment of the members of the three clusters could be linked to their level of knowledge. Acknowledgments: This work is funded by National Funds through the FCT– Foundation for Science and Technology, I.P., within the scope of the project Refª UIDB/00681/2020. Furthermore we would like to thank the CERNAS Research Centre and the Polytechnic Institute of Viseu for their support. This work was prepared in the ambit of the multinational project from CI&DETS Research Centre (IPV – Viseu, Portugal) with reference PROJ/CI&DETS/2014/0001.
Conflict of interest: Authors declare no conflict of interest.
References
[1] Broen MPG, Moonen AJH, Kuijf ML, Dujardin K, Marsh L, Richard IH, et al. Factor analysis of the hamilton depression rating scale in parkinson’s disease. Parkinsonism Relat Disord. 2015;21:142–6. doi: 10.1016/j.parkreldis.2014.11.016. [2] Carvalho AFU, Portela MCC, Sousa MB, Martins FS, Rocha FC,
Farias DF, et al. Physiological and physico-chemical char-acterization of dietaryfibre from the green seaweed Ulva fasciata Delile. Braz J Biol. 2009;69:969–77. doi: 10.1590/ S1519-69842009000400028.
[3] Davis FB. Educational Measurements Their Interpretation. USA: Wadsworth Pub. Co; 1964.
[4] Dixon V, Burton N. Are midwifery clients in Ontario making informed choices about prenatal screening? Women Birth. 2014;27:86–90. doi: 10.1016/j.wombi.2014.02.003. [5] Dolnicar S. A review of data-driven market segmentation in
tourism. Fac Comm Pap. 2002;12:1–22. doi: 10.1300/ J073v12n01_01.
[6] Ferreira M, Guiné RPF, Duarte J, Correia P, Leal M, Baric IC, et al. Sources of information about dietaryfibre: a cross-country survey. Eur Proc Soc Behav Sci EpSBS. 2016;XVI:7–17. doi: 10.15405/epsbs.2016.11.2.
[7] Ghanouni A, Renzi C, Meisel SF, Waller J. Common methods of measuring‘informed choice’ in screening participation: challenges and future directions. Prev Med Rep. 2016;4:601–7. doi: 10.1016/j.pmedr.2016.10.017. [8] Guillon F, Champ M. Structural and physical properties of
dietaryfibres, and consequences of processing on human physiology. Food Res Int. 2000;33:233–45. doi: 10.1016/ S0963-9969(00)00038-7.
[9] Guiné R, Duarte J, Ferreira M, Correia P, Leal M, Rumbak I, et al. Knowledge about dietaryfibres (KADF): development and validation of an evaluation instrument through structural equation modelling(SEM). Public Health. 2016a;138:108–18. [10] Guiné R, Matos M, Henriques C, Correia P. Preferences and
consumer habits related to bread in the centre of Portugal.
Nutr Food Sci. 2016b;46:306–20. doi: 10.1108/NFS-11-2015-0149.
[11] Guiné R, Ferreira M, Correia P, Duarte J, Leal M, Rumbak I, et al. Knowledge about dietaryfibre: a fibre study framework. Int J Food Sci Nutr. 2016c;67:707–14. doi: 10.1080/
09637486.2016.1191443.
[12] Hair JFH, Black WC, Babin BJ, Anderson RE. Multivariate data analysis, 7th edn. Prentice Hall, s.l; 2009.
[13] Hall RS, Baxter AL, Fryirs C, Johnson SK. Liking of health-functional foods containing lupin kernelfibre following repeated consumption in a dietary intervention setting. Appetite. 2010;55:232–7. doi: 10.1016/j.appet.2010.06.004. [14] Hernández A, Martínez C, Hernández MT. Fibra alimentaria: concepto, propiedades y métodos de análisis. Aliment Rev Tecnol E Hig Los Aliment. 1995;261:19–30.
[15] Hincapié AG, Vásquez DC, Galicia VS, Hincapié CA. Technological and functional properties of dietaryfiber from mango peel var. Hilacha(Mangifera indica L.): effect of convection drying. Biotecnol En El Sect Agropecu Agroindustrial. 2014;12:153–60.
[16] Hoek J. Informed choice and the nanny state: learning from the tobacco industry. Public Health. 2015;129:1038–45.
doi: 10.1016/j.puhe.2015.03.009.
[17] Hollingworth W, Biswas M, Maishman RL, Dayer MJ, McDonagh T, Purdy S, et al. The healthcare costs of heart failure during the lastfive years of life: a retrospective cohort study. Int J Cardiol. 2016;224:132–8. doi: 10.1016/
j.ijcard.2016.09.021.
[18] Hong Y, Zi-Jun W, Jian X, Ying-jie D, Fang M. Development of the dietaryfiber functional food and studies on its toxicolo-gical and physiologic properties. Food Chem Toxicol. 2012;50:3367–74. doi: 10.1016/j.fct.2012.05.011.
[19] Kaczmarczyk MM, Miller MJ, Freund GG. The health benefits of dietaryfiber: beyond the usual suspects of type 2 diabetes mellitus, cardiovascular disease and colon cancer. Metabolism. 2012;61:1058–66. doi: 10.1016/ j.metabol.2012.01.017.
[20] Kaiser HF, Rice J. Little Jiffy, Mark Iv. Educ Psychol Meas. 1974;34:111–7. doi: 10.1177/001316447403400115. [21] Kendall CWC, Esfahani A, Jenkins DJA. The link between
dietaryfibre and human health. Food Hydrocoll. 2010;24:42–8. doi: 10.1016/j.foodhyd.2009.08.002. [22] Kim DD, Basu A. Estimating the medical care costs of obesity
in the United States: systematic review, meta-analysis, and empirical analysis. Value Health. 2016;19:602–13.
doi: 10.1016/j.jval.2016.02.008.
[23] Macagnan FT, Santos LR, dos, Roberto BS, de Moura FA, Bizzani M, da Silva LP. Biological properties of apple pomace, orange bagasse and passion fruit peel as alternative sources of dietaryfibre. Bioact Carbohydr Diet Fibre. 2015;6:1–6. doi: 10.1016/j.bcdf.2015.04.001.
[24] Mackie A, Bajka B, Rigby N. Roles for dietary fibre in the upper GI tract: the importance of viscosity. Food Res Int.
2016;234–8. doi: 10.1016/j.foodres.2015.11.011.
[25] Mann JI, Cummings JH. Possible implications for health of the different definitions of dietary fibre. Nutr Metab Cardiovasc Dis NMCD. 2009;19:226–9. doi: 10.1016/
j.numecd.2009.02.002.
[26] Maroco J, Garcia-Marques T, 2006. Qual a fiabilidade do alfa de Cronbach? Questões antigas e soluções modernas?
[27] Martinho C, Correia A, Goncalves F, Abrantes J, Carvalho R, Guine R. Study about the knowledge and attitudes of the Portuguese population about foodfibres. Curr Nutr Food Sci. 2013;9:180–8. doi: 10.2174/ 1573401311309030002.
[28] Nieto Calvache JE, Fissore EN, Latorre ME, Soria M, De Escalada Pla MF, Gerschenson LN. Obtention of dietaryfibre enriched fractions from peach bagasse using ethanol pre -treatment and microwave drying. LWT Food Sci Technol. 2015;62:1169–76. doi: 10.1016/j.lwt.2015.01.045.
[29] O’Neil CE, Zanovec M, Cho SS, Nicklas TA. Whole grain and fiber consumption are associated with lower body weight measures in US adults: National Health and Nutrition Examination Survey 1999–2004. Nutr Res. 2010;30:815–22. doi: 10.1016/j.nutres.2010.10.013.
[30] Pagano E, Rosa De, Rossi M, Cinconze E, Marchesini E, Miccoli G, et al. The relative burden of diabetes complications on healthcare costs: the population-based CINECA-SID ARNO diabetes observatory. Nutr Metab Cardiovasc Dis. 2016;26:944–50. doi: 10.1016/ j.numecd.2016.05.002.
[31] Rohm AJ, Swaminathan V. A typology of online shoppers based on shopping motivations. J Bus Res Mark Web– Behav Strat Pract Publ Pol. 2004;57:748–57. doi: 10.1016/S0148-2963(02)00351-X.
[32] Salomaa A, Paloniemi R, Hujala T, Rantala S, Arponen A, Niemelä J. The use of knowledge in evidence-informed voluntary conservation of Finnish forests. Policy Econ. 2016;73:90–8. doi: 10.1016/j.forpol.2016.09.004. [33] Schwarzkopf L, Wacker M, Ertl J, Hapfelmeier J, Larisch K,
Leidl R. Impact of chronic ischemic heart disease on the health care costs of COPD patients– An analysis of German claims
data. Respir Med. 2016;118:112–8. doi: 10.1016/ j.rmed.2016.08.001.
[34] Shi J, Wang Y, Cheng W, Shao H, Shi L. Direct health care costs associated with obesity in Chinese population in 2011. J Diabetes Complications. 2017;31:523–8. doi: 10.1016/ j.jdiacomp.2016.11.007.
[35] Slavin JL. Position of the American Dietetic Association: health implications of dietaryfiber. J Am Diet Assoc. 2008;108:1716–31. [36] Slavin JL. Dietary fiber and body weight. Nutr Burbank
Los Angel Cty Calif. 2005;21:411–8. doi: 10.1016/ j.nut.2004.08.018.
[37] Stephen AM, Champ MM-J, Cloran SJ, Fleith M, van Lieshout L, Mejborn H, et al. Dietaryfibre in Europe: current state of knowledge on definitions, sources, recommendations, intakes and relationships to health. Nutr Res Rev. 2017;30:149–90. doi: 10.1017/S095442241700004X.
[38] Stevens JP. Applied multivariate statistics for the social sciences, 5th edn. New York: Routledge; 2009. [39] Sumczynski D, Bubelová Z, Fišera M. Determination of
chemical, insoluble dietaryfibre, neutral-detergent fibre and in vitro digestibility in rice types commercialized in Czech markets. J Food Compos Anal. 2015;40:8–13. doi: 10.1016/ j.jfca.2014.12.007.
[40] Tanaka K, Akechi T, Okuyama T, Nishiwaki Y, Uchitomi Y. Development and validation of the Cancer Dyspnoea scale: a multidimensional, brief, self-rating scale. Br J Cancer. 2000;82:800–5. doi: 10.1054/bjoc.1999.1002.
[41] Tuppin P, Rivière S, Rigault A, Tala S, Drouin J, Pestel L, et al. Prevalence and economic burden of cardiovascular diseases in France in 2013 according to the national health insurance scheme database. Arch Cardiovasc Dis. 2016;109:399–411. doi: 10.1016/j.acvd.2016.01.011.