Multispectral analysis of Nuragic
metallic samples (Sardinia, Italy)
Laureando: Sergio Augusto B. Lins
Matricola: 1825331
Relatore: Giovanni Ettore Gigante Correlatore: Antonio Brunetti
Facoltà di Scienze Matematiche, Fisiche e Naturali
Corso di laurea in Scienze e Tecnologie per la Conservazione dei Beni Culturali [LM (DM 270/04) - ORDIN
Esame finale anno 2018 A/A 0000/0000
ii To my mother, my family and my godmother.
I thank all my friends and those who helped me through the last two years giving me support to keep always moving forward.
iii ACKNOLEDGMENTS
First, to God and His guidance, being an anchor during the hardest times.
I would like to thank my supervisors Antonio Brunetti and Giovanni Gigante for the guidance, criticism and opportunity provided for the execution on this work.
I also thank my former supervisor, Joaquim de Assis, who guided me during my bachelor thesis work, for introducing me to this fascinating world of archaeometry.
I also want to express my gratitude to the ARCHMAT consortium for funding the research and trusting my skills and knowledge, giving me a shot of confidence.
Finally, I express my deepest gratitude to all my friends and my family for the emotional and physical support throughout this journey.
iv “However great and mighty the marvels of nature may seem to us, they are always to be explained by physical reasons. Everything is subordinate to some great law of nature.” - Jules Verne
v ABSTRACT
In this investigation, a protocol combining the use of Monte Carlo simulations together with energy-dispersive X-ray fluorescence (ED-XRF) analysis was used to determine the chemical composition of a set of nine objects from a private collection, apprehended by Carabinieri and without archaeological context. The artefacts are thought to belong to the nuragic period from Sardinia, Italy. The protocol employed is a powerful and non-destructive method useful for cultural heritage applications where usually no sampling is allowed and was applied here with the objective of attesting the authenticity of the objects. The samples were simulated as multilayered structures composed of bulk material and outer corrosion layer so the patina thickness and composition could be estimated as well by the X-ray Monte Carlo (XRMC) package. The method proved useful and powerful, capable of efficiently determining the composition and structure of most of the objects in a total non-destructive approach, attesting the existence of at least one fake in the set. Nevertheless, for a more throughout evaluation and a better estimation of the patina composition, the use of complementary analytical techniques has shown required.
vi LIST OF FIGURES
Figure 1 – Simplistic shell transition diagram. ... 13 Figure 2 – Schematic drawing representing the mass-attenuation process within the sample. ... 20 Figure 3 – Block diagram showing in a simplistic way the algorithm structure. ... 29 Figure 4 – Block diagram representing the sample composition and structure iteration process. ... 32 Figure 5 – Map pinpointing the location of Sardinia island. ... 33 Figure 6 – Ancient copper-ore deposits widespread in Sardinia. ... 38 Figure 7 – Set of analyzed objects. 1-3 – Daggers (42, 43 and 44), 4-5 – Bronzetti (47 and 52), 6 – Navicella, 7 – Double axe “axe-adze”, 8 – Axe, 9 – Boat (navicella) head. ... 49 Figure 8 – Experimental setup at Soprintendenza Archeologia, belle arti e paesaggio per le
province di Sassari e Nuoro. ... 51
Figure 9 – Comparison between simulated and measured spectra of spots 4 and 2 for samples 24_42 (left) and 24_43 (right), respectively. ... 55 Figure 10 – Micrograph of sample 24_49 spots 1 (a) and 2 (b). ... 62 Figure 11 – Comparison between simulated and measured spectra of spots 1 (left) and 2 (right) for sample 24_52. ... 65 Figure 12 – Comparison between simulated and measured spectra of spots 3 (left) and 4 (right) for sample 110. ... 68 Figure 13 – Micrograph of sample 110 surface (spot 3). ... 69 Figure 14 – Elemental map distribution of sample 111 surface optical image (a), elemental distribution of Cl (b), Cu (c), Fe (d), Sn (e) and O (f). ... 71
vii LIST OF TABLES
Table 1 – XRMC results for samples 24_42 and 24_43... 55
Table 2 – XRMC results for sample 24_44. ... 58
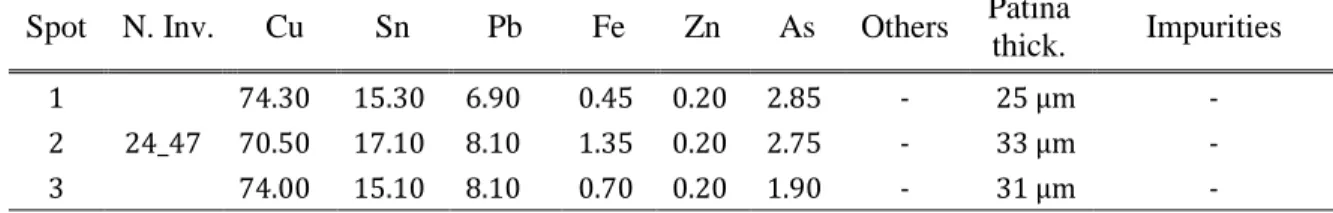
Table 3 – XRMC results for sample 24_47. ... 60
Table 4 – XRMC results for sample 24_49. ... 63
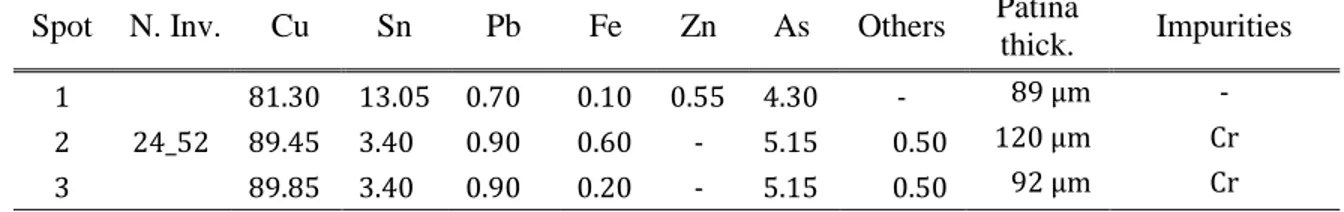
Table 5 – XRCM results for sample 24_52. ... 64
Table 6 – XRMC results for sample 110. ... 67
Table 7 – XRMC results for sample 111. ... 70
viii
INDEX
1 Introduction ... 9
2 X-Rays basics ... 11
2.1 Interaction with matter ... 12
2.2 X-rays sources ... 14
2.3 X-rays detection ... 16
2.4 Quantification methods ... 19
2.5 XRF in cultural heritage ... 22
3 Monte Carlo simulations ... 26
3.1 Algorithm overview ... 27
3.1.1 Classes ... 30
3.1.2 Iteration process ... 31
4 Nuragic Civilization and Ancient Metallurgy ... 33
4.1 History, culture and religion ... 34
4.2 Metallurgy ... 37
4.2.1 Ore deposits ... 37
4.2.2 Technology: the nuragic metalwork ... 39
4.2.3 Corrosion of copper and bronze ... 44
5 Materials and Methods ... 48
5.1 Materials ... 48
5.2 Characterization ... 50
5.2.1 XRF in-situ analysis ... 50
5.2.2 MA-XRF analysis ... 51
5.2.3 Monte Carlo Simulations ... 52
6 Results and discussions ... 54
7 Conclusions ... 74
REFERENCES ... 75
9 1 Introduction
Archaeological objects serve as witnesses of the past and their rather uniqueness, turns this category of objects into one of great interest among the scientific community. Analytical approaches towards this category of objects has been carried for a long time, in an attempt to chemically and morphologically characterize them (Alonso et al. 2009; de Caro 2017; Craddock 1976; Kienlin, Bischoff, and Opielka 2006; Meeks 1993; Paparazzo 1994; Pillay et al. 2000; Robbiola, Blengino, and Fiaud 1998). Nevertheless, the removal of fragments for such purposes has become more and more restricted and the approach is now focused in the use of non-destructive techniques always when possible.
X-ray fluorescence (XRF) is a diffused technique and has been used for archaeometric purposes in the past decades since it is non-destructive and yields considerably good results (Guerra 2000; Nørgaard 2017; Pillay et al. 2000). With the advance in technology, XRF has become more and more reliable and the equipment miniaturized, ensuing a greater ease-of-use and portability, making it possible to carry out in-situ analysis (Van Grieken and Markowicz 2002).
Although XRF technique allows easily gathering of qualitative information regarding chemical composition, a proper quantitative analysis is still a challenging task. The specific determination of an archaeological metallic alloy is even more difficult (Cesareo et al. 2015), since ancient objects have been buried for extremely long periods of time and, because of that, presents a thick, rough corroded surface, whose chemical composition varies greatly from the original bulk material (Cesareo, Bustamante, et al. 2013; Dillmann et al. 2007; Figueiredo, Araújo, et al. 2013; Ingo et al. 2006; Pronti et al. 2015).
To overcome such difficulties, novelty methods simulating the interaction of X-rays with matter have been developed (Brunetti and Golosio 2014; Schoonjans et al. 2012; Vincze, Janssen, and Adams 1993). More specifically, a combined use of XRF experimental setup with a Monte Carlo algorithm that simulates the X-ray interactions with the sample has been recently used and validated (Bottaini et al. 2018; A. Brunetti, Fabian, et al. 2016; Manso et al. 2015; Schiavon et al. 2016). This protocol takes into full consideration the existence of a
10 multilayered structure – usually the case for archaeological materials and composed of a combination of surface treatment, incrustations, patina and the bulk. In this way, the protocol adopted can yield reliable data concerning the bulk composition of the material, reflecting the original alloy composition.
Another issue that arises when dealing with ancient objects is their authenticity. Sometimes archaeological findings are prevenient from illegal excavations and therefore presents no historical context, being difficult to attest their originality.
The corroded surface formed throughout the course of thousands of years is difficult to replicate and can be used as a sign of originality of the object (Scott 2002; Selwyn 2004). Moreover, objects obtained through official archaeological expeditions have been characterized and their average alloy composition is known (Atzeni et al. 2005; Craddock 1976; Moravetti et al. 2014; Schiavon et al. 2016). In this context, “unknown” objects can be confronted and a discussion on their authenticity, proposed.
In this work, the combined use of Monte Carlo simulations with an XRF experimental setup and MA-XRF analysis has been put to use in an attempt to attest the authenticity of a group of archaeological bronze objects apprehended by the local police and prevenient from illegal excavations. The set is composed of nine objects thought to belong to the nuragic period in Sardinia, Italy (1500 ~ 500 BC).
11 2 X-Rays basics
X-rays are defined as an electromagnetic radiation, between γ-rays and ultraviolet radiation possessing energies between 1 KeV and 100 KeV (Cesareo 2000; Van Grieken and Markowicz 2002), being divided into “soft” and “hard” X-rays, according to their energy (Schoonjans 2012). Its classification is somewhat artificial and some authors define X-radiation as residing between 0.15 KeV and 102 KeV, overlapping part of the hard-ultraviolet and soft γ-radiation (Beckhoff et al. 2006).
Developments in technology creating even more efficient detectors throughout the decades has made it possible to detect X- radiation with a very high energy resolution (up to an order of a few hundred electronvolts – eV) (Van Grieken and Markowicz 2002) and making possible the production of ever smaller X-ray spectrometers since its early applications back in the 50’s (Ferretti 2000; Guerra 2000).
The most common application of X-ray spectrometry is in quali-quantitative elemental analysis (Nascimento Filho 1999). X-rays interaction with matter can produce radiation, which is intrinsic to each chemical element, and, with the use of a detection system, it is possible to quantify the radiation emitted from the sample and thus identify to which chemical element it belongs, creating an energy continuum spectrum containing the characteristic lines for almost every element within the sample (Ferretti 2000; Van Grieken and Markowicz 2002; Nascimento Filho 1999; Schoonjans 2012). Not every element can be detected, due to their nature; being too light or too heavy and thus being either absorbed by the sample or not detected by the detector, not contributing with a peak on the collected energy spectrum (Barcellos Lins, Humberto Zani, and Teixeira De Assis 2015).
For analytical purposes, spectrometers have been developed throughout time. They consist, in a simplified way, of a source capable of producing X-rays, a sample stage and a detector (Schoonjans 2012; Da Silva 2017). Moreover, optical elements can be added to the source with the purpose of focusing the beam to a micro or nano scale and filters for refining the emitted energy. There are a wide variety of sources and detectors, each with its advantages and disadvantages, which can affect in different manners the energy spectrum
12 obtained at the end of the analysis (Van Grieken and Markowicz 2002). Nevertheless, other factors can interfere in the spectrum obtained for a particular sample. They comprise, in a general way, the surface and nature of the sample under analysis, geometry between source, sample and detector, and the system efficiency (Brunetti and Golosio 2014; Van Grieken and Markowicz 2002; Nascimento Filho 1999; Schoonjans 2012) and will be briefly discussed in this chapter.
2.1 Interaction with matter
Electromagnetic radiation can interact with matter in different levels: rotational, vibrational and electronic (Callister 2007). X-radiation, being highly energetic, interacts in an electronic level. Upon bombarding a sample surface with a beam of X-rays, three main interactions can occur: Rayleigh scattering, Compton scattering and photoelectric effect (Knoll 2010). Rayleigh scattering is elastic and refers to the scattering of X-rays caused by atomic electrons in which the energy of the scattered photon remains unchanged. Compton scattering refers to the inelastic scattering of X-rays, in which part of the incident photon energy is absorbed by an outer shell electron, recoiling and being thus ejected from the atom. The amount of energy of the scattered photon can be easily calculated by the Compton formula (Van Grieken and Markowicz 2002; Schoonjans 2012).
For analytical purposes, the interaction that raises more interest is the photoelectric effect. This interaction can provide useful information on the composition of a sample and on the relative abundance of its constitutional elements (Ferretti 2000; Nascimento Filho 1999; Schoonjans 2012). The photoionization cross-section (τ) is a function of the atomic number and incident energy, being approximately defined as (Schoonjans 2012):
𝜏(𝑍, 𝐸)~𝐶𝑍
4
13 Photoelectric effect occurs when an incident X-ray photon, with an energy greater than the edge energy (binding energy of an electron in an atomic shell) is fully absorbed by the atom. This process causes the ejection of an electron from the atom, producing a vacancy (Beckhoff et al. 2006; Van Grieken and Markowicz 2002). The produced photoelectron will have an energy equal to the difference between the incident photon and the ejected electron binding energy (Schoonjans 2012). The vacancy thus created can be filled by a transition of a more external electron, belonging to an outer shell, resulting in the production of a photoelectron (Ferretti 2000; Nascimento Filho 1999). The transition can be radiative or non-radiative. If non-radiative, the produced photoelectron will be absorbed by another electron within the atom, generating an Auger electron (or a Coster-Kronig transition, if absorbed by an electron within the same shell) (Schoonjans 2012). If radiative, a characteristic line is produced in an effect called fluorescence. The probability of obtaining a characteristic line instead of an Auger electron is called fluorescence yield. In other words, the fluorescence yield is the number of emitted X-ray quanta during the filling of the vacancies divided by the number of initial vacancies (Zschornack 2007).
14 Fluorescence transitions can occur from different shells, e.g. if a vacancy is formed in the K shell of an atom, an electron belonging to shell L or M, and its sub-shells, can fill this vacancy. The energies involved in the transitions are obviously different and will result in detected photons of different energies. If an electron from subshell L2 occupies the vacancy
in shell K, the transition is said to be a KL2 transition. If it occurs between subshell L3 and
shell K, it is said to be a KL3 transition. KL transitions emit a radiation named Kα, KM
transitions produces Kβ radiation. The same is valid for LM and LN transitions, ensuing Lα
and Lβ radiations, respectively; and analogously valid for other shell transitions. The
sub-indexes α and β are, in realty, composed by the several transition possibilities between the shells (e.g. KL3 and KL2 producing Kα1 and Kα2) as it can be seen in Figure 1 (Nascimento
Filho 1999). For practical purposes, it is conventional to use the simplified notation referring by Kα the sum of all KL transitions contribution.
That being said, the probability of a characteristic X-ray line being produced, for a given sample, can be quantified and is given by a sum of probabilities: the chance of an incident photon, of energy greater than the threshold for removing an electron from an atom, hits the element Z (photoionization cross-section), the probability of a characteristic line within its series (KL2, KL3) is produced and the probability of occurring fluorescence, instead of the
production of an Auger electron (fluorescence yield) (Nascimento Filho 1999; Schoonjans 2012; Da Silva 2017):
𝑄𝐾𝐿2(𝑍, 𝐸) = 𝜏𝐾(𝑍, 𝐸). 𝐹𝐾𝐿2(𝑍). 𝜔𝐾(𝑍, 𝐸) (2)
2.2 X-rays sources
Radioisotopes are a common source of radiation for medical applications and can also be found on some portable XRF spectrometers (Ferretti 2000; Schoonjans 2012). Radioisotopes, having a proton-rich nucleus, absorbs electrons from its inner shells transforming a proton to a nucleus and creating a vacancy. This vacancy can be filled by a transition from a higher shell electron, producing characteristic X-ray photons (Schoonjans 2012). Nevertheless, the use of radioisotopes requires a series of safety measures; they are time dependent, with short
15 half-lives and possess lower intensities than photons produced by X-ray tubes, limiting their use (Nascimento Filho 1999; Schoonjans 2012).
The most wide spread mechanism for generating X-rays are the X-ray tubes. Within the tube, a filament is heated by means of an electric current at steady high voltages, which, by thermionic effect, produces electrons (Nascimento Filho 1999). The strong electric field accelerates the electrons towards a target (anode) producing radiation by two simultaneous processes: impact ionization and deceleration (bremsstrahlung), which occurs when the electrons lose energy passing through the Coulomb field of a nucleus (Beckhoff et al. 2006; Van Grieken and Markowicz 2002; Schoonjans 2012). The latter provides a continuous spectrum with occasional discrete lines from the anode material, since the electrons may still interact with the anode atoms by photoelectric effect (Van Grieken and Markowicz 2002; Schoonjans 2012). Impact ionization, on the other hand, will cause the ejection of electrons from the inner shells of the anode atoms (if the energy is high enough), creating vacancies. The produced vacancies are filled by electrons from higher shells. If the process is radiative, then characteristic fluorescence lines of the anode atoms will be produced. They are of considerably higher intensity than those produced by bremsstrahlung (Schoonjans 2012).
The generated continuum of the X-ray tube is defined within an asymmetrical interval between the emission limits of the source (and detection limits of the system as a whole) being a superposition of the continuous radiation and characteristic lines (Beckhoff et al.
2006; Schoonjans 2012). The total intensity will be proportional to the square of the applied voltage and to the power of one of the atomic number of target atoms (Beckhoff et al. 2006; Van Grieken and Markowicz 2002). In literature, it is possible to find physical models capable of calculating the efficiency of converting electrical power into X-rays (Van Grieken and Markowicz 2002). The efficiency of an X-ray source takes into account several parameters: self-absorption effect, backscattering effects, target material and thickness, voltage, current and age of the equipment, to cite a few (Van Grieken and Markowicz 2002; Schoonjans 2012). These factors are of pristine importance, since a thorough understanding of the excitation spectrum is required in order to perform a proper quantification of the chemical elements present in a sample. If optical elements are used (which is rather common
16 in modern X-Ray spectrometers), the task is even more challenging. Optical elements have the role of focusing the X-ray beam in narrower areas, making possible the use of techniques such as micro and nano XRF. The efficiency of these elements and how they alter the excitation spectrum are well known (Schoonjans 2012). Nevertheless, the equations that governs these phenomena will not be discussed here, since they are out of the scope of this research.
2.3 X-rays detection
In the past, the detection of X-radiation was done with photographic plates or fluorescent screens, only after being made by means of gas ionization (Beckhoff et al. 2006). In the latter method, ions would move to electrodes with opposite charges, generating current. As it is to expect, these methods were not able to measure the energy of the absorbed radiation, but only its intensity. It was only then, with the development of the proportional counters and later on, the scintillation devices, that the amount of energy of the radiation could be measured (Van Grieken and Markowicz 2002; Schoonjans 2012). Despite their inefficiency compared to modern detectors, proportional counters are still in use due to some advantages: they are very cheap and easy to operate (Beckhoff et al. 2006).
Further on, semiconductors and then silicon drift detectors (SDD) were developed, allowing the detection to be carried at higher resolutions (up to 200 eV or less) (Van Grieken and Markowicz 2002). Semiconductor detectors are still in use, but being slowly replaced by SDD detectors. The latter makes use of low-capacitance charge collector, which results in shorter shaping times and uses a transversal field of ring electrodes that directs the charge carriers towards the collection electrode. This results in significantly higher count rates and devoid them from the need of a bulky nitrogen cooling system, explaining their popularity.
Whereas for semiconducting detectors, the material is doped in a manner that electronic “gaps” are created (p-doping) or an enrichment in electrons is made (n-doping), decreasing the conductivity of the material. The most popular semiconductor detector is the lithium drifted silicon detector (Si(Li)). These detectors relies on the drifting of lithium ions, which
17 also occurs at room temperature causing a redistribution of the lithium dopants inside the material. For this reason, the detector must be constantly kept under cooling (nitrogen cooling) which makes it bulky and less practical than the Peltier cooled SDD detectors (Beckhoff et al. 2006; Ferretti 2000; Schoonjans 2012).
The detection efficiency of a given detector can be determined by a series of factors and is defined as the amount of photons emitted by the source, which interacts with the sample (if any) and is absorbed by the detector volume. The factors that comprises the detector efficiency are the geometrical efficiency, photopeak efficiency and intrinsic efficiency (Beckhoff et al. 2006; Schoonjans 2012). The problems that arise from the geometrical efficiency, take into account the distance between detector and sample and the limited active area of the detector (Beckhoff et al. 2006).
Whereas for the intrinsic efficiency of a given detector, it can be easily calculated in basis of the detector material and its thickness. The efficiency is given in number of photons that interacts with the detector according to the Beer-Lambert equation (Schoonjans 2012):
𝐼 = 𝐼0𝑒−𝜇(𝐸)𝜌𝑤 (3)
Where I is the portion of photons after crossing a sample of density ρ and mass attenuation μ, for a given incident energy E and with thickness w of an incident beam of intensity I0.
Moreover, the detector window will also absorb some of the incoming radiation. This effect can be as well estimated by the Beer-Lambert equation, and the combination of intrinsic efficiency and window efficiency can be referred to as quantum efficiency (Schoonjans 2012).
Photopeak efficiency is rather more complex due to its direct influence on the energy spectrum, comprising the appearance of “artefacts”, which can sometimes be misinterpreted as characteristic lines. It can be defined as the ratio of main peak intensity by the total intensity of main peak and its escape peaks, described in the upcoming paragraph.
When the detector absorbs an incoming photon, three main interactions can occur: photoelectric effect, Rayleigh scattering and Compton scattering. The latter two are not much
18 relevant, since Compton scattering starts causing discrepancies only above 100 KeV and Rayleigh scattering contributions hardly exceeds 10 to 20% of total absorption (Beckhoff et al. 2006). If the incoming photoelectron has an energy higher that the edge energy of Si-K shell (in the case of SDD detectors), the detection process will involve the production of Si-K lines inside the detector volume. The vast majority will be immediately absorbed and will contribute to the collected electrical charge. Nevertheless, there is a possibility that these silicon characteristic lines will escape the detector volume, giving origin to escape peaks, which appears as artefacts on the spectrum (Van Grieken and Markowicz 2002). The energy of the escape peaks is equal to the difference between the incident photoelectron energy and the escape photon energy. This effect is negligible for energies above 10 KeV but, when dealing with lighter elements, this effect plays an important role. Because of that, the escape fraction, i.e. the amount of escape photons, can be calculated and is useful when applying corrections to the spectrum during the quantification step (Schoonjans 2012).
Another effect caused by the action of the detector is the pileup effect, which results in sum peaks within the spectrum. This happens when two photoelectrons enters the detector within a time interval too short for the detector to process them, resulting in a “recognized” signal with an energy corresponding to the sum of the two photoelectrons involved in the process. Sum peaks are hardly misinterpreted as another chemical element, meaning they will not strongly affect a qualitative analysis. In the other hand, for quantitative analysis, the appearance of sum peaks may change the observable abundance of one or other element, making it fundamental to correct this effect, often mathematically. Changing analysis conditions (by the use of filter or lowering the counts per second – cps) can also help counterbalance these effects (Van Grieken and Markowicz 2002; Schoonjans 2012).
There are, of course, other effects that can cause alterations on the spectrum (often hard to quantify). The collection of photons by the detector follows a Gaussian distribution and is a statistical process. The peaks are shown in the spectrum as an approximate Gaussian distribution due to the photon-to-charge conversion that takes place within the detector and the electronic noise caused by the amplification of the signal. An incomplete charge collection can cause disturbances on the lower energy part of the spectrum, representing the
19 apparent continuum in this region to be higher than expected. This effect is caused by intrinsic defects of the detector such as dead layers and low electric field regions (Schoonjans 2012).
2.4 Quantification methods
When it comes to quantification, the main objective is to convert the obtained spectrum into tangible results, i.e. in values that actually represents the relative abundance of each element within the analyzed sample. In this process, net XRF-line intensities are extracted from the spectrum taking into account the physical interactions involved during the detection process. Only then a quantification is made, involving calibrations and matrix effect correction (Van Grieken and Markowicz 2002; Nascimento Filho 1999).
In usual routine XRF analysis, the energy collected by the detector is between 1 and 30 KeV, hardly surpassing the 30 KeV upper limit. Within this region, self-absorption effect is more intense and should be taken into account (Nascimento Filho 1999). Nevertheless, in the field of archaeometry, the energy limits are pushed forward, comprising higher energies such as 40 or 50 KeV.
Some quantification packages are commercially available. However, they will differ on the basis of the quantitative analysis employed, on the number of standard samples used, spectrometer flexibility and configurations and on the matrix effect correction methods (Van Grieken and Markowicz 2002).
If the sample consists of only a few elements (which is the case of most metallic alloys), and the estimated concentration of each element is known, linear regression method is commonly used for determining each element concentration. Nevertheless, this method requires a considerably high number of standards covering all the combinations of elemental concentrations expected to be found in the sample (Nascimento Filho 1999).
A far more practical method is the Fundamental Parameter Method (FPM). In comparison to the above mentioned method, FPM has the advantage of requiring less standards (roughly one per element expected to be found in the sample). The method requires, however, a
20 previous knowledge of the physical constants and variables involved in the experimental setup (Nascimento Filho 1999), and relies on describing the fraction of absorbed atoms for a polychromatic X-ray source and a sample composed of various elements (Schoonjans 2012). The concepts involved were briefly discussed on the above sections for a monochromatic beam and homogeneous sample and will be given in more detail here. It is rather easy to approximate the concepts for a more real situation (as required by FPM) (Van Grieken and Markowicz 2002), but the calculations are outside the scope of this research.
Figure 2 – Schematic drawing representing the mass-attenuation process within the sample. Take for instance the particular case for a monochromatic beam of energy E and a sample of density ρs composed of n elements of weight fractions w (∑𝑛𝑖=1𝑤𝑖). The beam reaching
the sample will be gradually absorbed undergoing the process of mass-attenuation. The intensity reaching the bulk of the sample at a depth t on an infinitesimal part of the sample dt (as represented in Figure 2) can be given by the Beer-Lambert equation:
𝐼𝑡(𝐸) = 𝐼0(𝐸)𝑒−𝜇𝑠(𝛦)𝜌𝑠𝑡.𝑐𝑜𝑠𝑠𝑒𝑐(𝜓)𝑑𝑡 (4)
Where t.cossec(ψ) is the total distance travelled by the beam on an incident angle ψ until reaching a depth t and μs(E) is the mass attenuation factor for the sample at the energy E,
which can be given by the weighted sum of mass attenuation coefficients of each element: 𝜇𝑠(𝐸) = ∑ 𝜇𝑗(𝛦)𝑤𝑗
𝑛 𝑗=1
(5)
As mentioned on previous sections, the probability of an incident photon yielding a specific line, let us suppose Kα, is equal to 𝑄𝑘𝛼(𝑍, 𝐸) and depends on the fluorescence yield,
21 photoionization cross-section and radiative rate. For an element j with weight fraction wj, this
is given as: 𝑤𝑗𝑄𝑘𝛼,𝑗𝜌𝑠. The produced photons will exit the sample and reach the detector under another mass-attenuation process. The photons are scattered in all directions, with only a fraction being emitted towards the detector. This fraction is generally given by Ω/4π, where Ω is small enough to assume that the photons are leaving the sample on a parallel line with the detector at an angle ψ’ with the surface. This attenuation can be given in an analogous mode to that of the incident photons, but now with an energy E1= Κα energy.
In this manner, the intensity of Kα photons, with energy Kα, produced by the sample, for
the element j at incident energy E and reaching the detector at an angle ψ’ is given as follows: 𝐼𝑗,𝐾𝛼 = 𝐼0(𝐸). (𝑄𝑘𝛼,𝑗. 𝑤𝑗𝜌). 𝛺
4𝜋𝑒
−𝜇𝑠(𝐾𝛼)𝜌𝑠𝑡.𝑐𝑜𝑠𝑠𝑒𝑐(𝜓′)𝑒−𝜇𝑠(𝛦)𝜌𝑠𝑡.𝑐𝑜𝑠𝑠𝑒𝑐(𝜓)𝑑𝑡 (6) The equation can be re-written as:
𝐼𝑗,𝐾𝛼 = 𝐼0(𝐸). (𝑄𝑘𝛼,𝑗. 𝑤𝑗𝜌). 𝛺 4𝜋. exp [− ( 𝜇𝑠(𝐾𝛼) sin 𝜓′ + 𝜇𝑠(𝐸) sin 𝜓) 𝜌𝑠𝑡] 𝑑𝑡 (7) Making (𝜇𝑠(𝐾𝛼) sin 𝜓′ + 𝜇𝑠(𝐸)
sin 𝜓) = 𝜒, isolating the constants and integrating the equation above
from the “bottom” to the surface of the sample (i.e. from 0 to t), it can be re-written as: 𝐼𝑗,𝐾𝛼 = 𝐼0(𝐸). (𝑄𝑘𝛼,𝑗𝑤𝑗𝜌). 𝐺. 𝑡. 𝐴𝑐𝑜𝑟𝑟 (8)
Where;
𝐺 = 𝛺 4𝜋⁄ and 𝐴𝑐𝑜𝑟𝑟 = (
1−𝑒−𝜒𝜌𝑇 𝜒𝜌𝑇 ).
Acorr, represents the absorption correction term and represents the matrix effects. It has
its values between 1 and 0, being approximately 1 for the infinitely thin samples.
This approach, for a monochromatic beam and homogeneous sample, considers the production of primary photons only. In order to fit the conditions implied during XRF applications and thus a more realistic approach, when an X-ray tube is used, this concept must be expanded for a polychromatic continuous beam and consider secondary interactions
22 within the sample. Moreover, to fit the requirements within this work, this method should consider a multi-layered structure and the physical phenomena that comes with it. The existence of corrosion and protective layers on the objects surface, (which is often the occasion for most of the archaeological samples), implies on further mass-attenuation and self-absorption processes. Several papers have been published on the study of multilayered structures and its effects on Kα and Kβ emissions (A. Brunetti, Fabian, et al. 2016; Cesareo
et al. 2009; Cesareo, De Assis, et al. 2013; Cesareo et al. 2015) and their divergence in composition with the bulk of the object (Condamin and Picon 1964; Debernardi et al. 2017; Nørgaard 2017).
2.5 XRF in cultural heritage
Due to the analytical power provided by X-ray fluorescence (XRF) and its non-destructive characteristics, it has become a standard technique when dealing with cultural heritage objects and precious, timeless artifacts (Bottaini et al. 2017; Buccolieri et al. 2015; Carmona et al. 2010; Nørgaard 2017). The big advantage of yielding the chemical composition of an object, in a fast, rather precise and non-invasive manner is very attractive for most of the researches in the area (Buccolieri et al. 2015; Nørgaard 2017). Since its popularization, XRF has been widely employed on archaeometrical analysis (A. Brunetti, Fabian, et al. 2016; Cesareo, Bustamante, et al. 2013; Comelli et al. 2016; Guerra 2000; Harrison and Howe 2017; Ingo et al. 2013; Manso et al. 2015).
Nowadays XRF is normally used together with several other techniques in order to extract the most of information from the sample as possible. Analytical techniques used together with XRF are Fourier-transform infrared spectrometry (FT-IR), X-rays diffractometry (XRD), scanning electron microscopy (SEM) and Raman spectroscopy, among others (Di Carlo et al. 2017; Schiavon et al. 2013; Scott 2002). These techniques can be complementary to the results obtained from XRF, elucidating the crystalline structure of the material, the different layers that composes the sample and detecting lighter elements (Bottaini et al. 2018; Loureiro et al. 2014), prior “invisible” to routine XRF analysis (Ferretti 2000).
23 In a general trend, heavier chemical elements “reacts better” with X-radiation in comparison to lighter ones, being easier detected by an XRF spectrometer system. Another point to highlight, as discussed in previous sections, is that X-radiation undergoes attenuation when penetrating the sample. This is important to observe when dealing with corroded metals, since the superficial corrosion layer will interfere with the measurements (A. Brunetti, Fabian, et al. 2016; Schiavon et al. 2013).
Buccolieri et al. (Buccolieri et al. 2015) studied the patina composition of two Riace bronze statues in order to understand the formation of the patinas and give further information for art restorers on how to preserve these priceless objects. The authors made use of a portable XRF spectrometer, which has the obvious advantage of being lightweight and of small size. This feature comes in handy when dealing with objects that cannot leave the museum or their storage place due to a series of reasons. Nevertheless, the equipment proved very useful in handling results. It could properly detect S and Cl, indicators of copper corrosion products such as copper sulfides and copper chlorides, respectively, and other corrosion products such as cuprite. Copper chlorides have four polymorphs and can only be differentiated by X-ray diffractometry, as shown by Di Carlo et al. (Di Carlo et al. 2017). The average composition of the patinas and bronzes could be stablished by the authors and the relative low abundance of certain elements in specific areas of the statues could be attributed to either previous cleaning processes, local restoration procedures or to the deposition conditions the statues were found.
Loureiro et al. (Loureiro et al. 2014) studied the composition of several metallic artefacts found scattered over the archaeological site of Moinhos de Gola in Northern Portugal on a quali-quantitative level in order to relate the findings to some archaeological period. The results obtained with μ-XRF analysis proved useful in grouping the objects according to their average composition and ensuing it possible to associate some of them to the Late Bronze Age and some others to the Roman occupation period in the given context. In a similar way, Figueiredo et al. (Figueiredo, Araújo, et al. 2013) studied the composition of 37 metallic objects from Medronhal (Portugal) and stablished parallels with other workshops. Nevertheless, other authors, as Nørgaard (Nørgaard 2017), describes the use of XRF as not
24 enough in distinguishing and characterizing specific workshops or to infer intentional alloying, due to its limitations.
The thickness and nature of the crust formed by corrosion (patina) can differ greatly according to the environmental condition the object was deposited and to its intrinsic properties (Nørgaard 2017; Schiavon et al. 2013, 2016; Scott 2002) Corrosion process can also cause the selective migration of chemical elements within the object, creating a gradient or a re-distribution of the elemental composition as it nears the objects surface (Condamin and Picon 1964; Debernardi et al. 2017). Moreover, past restoration interventions might have been applied to the material, producing the deposition of another layer on the surface of the material (Schiavon et al. 2016; Scott 2002).
Since archaeological samples can rarely be cut for obtaining a cross-section, the precise composition of an archaeological metal is hard to be obtained by conventional XRF spectroscopy – the spectrum would reflect the composition of the surface of the material, as shown by Charalambous et al. (Charalambous, Kassianidou, and Papasavvas 2014). To overcome such difficulties, some authors chose to grind and polish a small surface of the sample with a diamond paste to expose the original surface of the object, and thus perform XRF analysis on that spot (Figueiredo, Araújo, et al. 2013; Schiavon et al. 2013), while others obtain a cross section sample of the object when it is allowed (Harrison and Howe 2017; Loureiro et al. 2014; Quaranta et al. 2014).
These approaches are not the ideal ones when dealing with precious and unique artifacts for a series of reasons. The greater advantage of XRF, as mentioned before, is the ability of obtaining results without interfering in the sample. Moreover, when the original surface of the material is exposed to the atmosphere, it should undergo a local preservation treatment after the analysis, which is often aggressive.
With the objective of overcoming the drawbacks of XRF analysis posed by the existence of one or more superficial layers and without destructively interfering in the sample, a Kα/Kβ
attenuation model and a computational method based on Monte Carlo simulations were developed and are constantly updated (Brunetti et al. 2004; Brunetti and Golosio 2014;
25 Cesareo et al. 2009, 2015; Cesareo, De Assis, et al. 2013; Golosio et al. 2014). The Monte Carlo method (XRMC) has already been successfully tested in several archaeological studies (Bottaini et al. 2017, 2018; Brunetti et al. 2015; A. Brunetti, Depalmas, et al. 2016; A. Brunetti, Fabian, et al. 2016; Manso et al. 2015; Schiavon et al. 2016).
26 3 Monte Carlo simulations
In the following chapter, methods for the simulation of X-radiation interaction with matter, and associated phenomena, will be discussed. Special attention shall be given to the method employed in this research: the XRMC algorithm developed by a group of researchers and contributors from the University of Sassari, Ghent University and the European Synchrotron Radiation Facility, making use of an always up-to-date X-ray interaction cross-section library (xraylib). This library contains calculated fundamental parameters such as K-lines, L-lines and several other cross-sections values for all known chemical elements, imperative for the execution of the algorithm.
As described in Chapter 2, X-rays interactions are a rather complex phenomenon. The simulation of probabilities of outcomes, as in classical statistics making use of all variables and parameters, is out-of-hand given the order of magnitude of variables involved. Instead, a more simplistic approach is the use of Monte Carlo (MC) algorithms, which simulates each “run” (or an event) and register the outcome. By “run” (in the particular case of this study), is meant the lifetime of a photon. The outcomes are evaluated when a sufficient number of runs is registered.
There are few packages and toolkits available for the simulation of particle-matter interactions. The majority of these algorithms are, nevertheless, applicable to a large set of particles such as electrons, neutrons and protons and even for hadronic and optical processes, serving as multi-purpose tools operating in a wide energy range. However, when it comes exclusively to X-rays fluorescence interactions, where a more precise and realistic representation of the phenomena is the main goal, computer processing efficiency can be drastically reduced compared to more straightforward algorithms.
Geant4, PENELOPE and MCNP (Monte Carlo N-Particle) codes are some examples of algorithms capable of simulating ED-XRF and are briefly described in the work of Schoonjans, 2012 (Schoonjans 2012). Nevertheless, their drawbacks falls within computing time and processing capabilities, being inconvenient when dealing with a large number of spectra (often the case in culture heritage applications) taking up to several hours of run-time
27 and (some) lacking the simulation of cascade effects and M-line emissions. Moreover, multi-purpose tools generally make use of rather complex sample and detector geometries, hindering the use of variance-reduction techniques.
A fast and reliable alternative for the afore-mentioned packages was the development of the algorithm used in this work, making use of variance-reduction technique and drastically reducing the run-time to the order of only few minutes. The XRMC algorithm has been validated through several real-world experimental spectra (Bottaini et al. 2017, 2018; A. Brunetti, Depalmas, et al. 2016; A. Brunetti, Fabian, et al. 2016; Brunetti et al. 2015) and with standard reference material (SRM) spectra (Schoonjans et al. 2012).
Van Grieken already proposed in his 2002 handbook of X-ray spectrometry that Monte Carlo simulations can be used as an inverse approach to determine a samples’ composition that minimizes the difference between simulated and experimental spectra through a 4-steps protocol. 1 – simulation of the X-ray intensities in the composition range of the unknown; 2 – convolution of the simulated spectra, applying a proper detector response function; 3 – construction of a chi² map as a function of the sample composition; and 4 – interpolation of chi² for the composition corresponding to the minimum (Van Grieken and Markowicz 2002).
3.1 Algorithm overview
It may be difficult to visualize immediately the whole structure and the steps underlined in the execution of such a complex algorithm and how it produces an X-ray fluorescence spectrum. To introduce the reader to the algorithm in a simple and straightforward manner, a first breakdown of the codes’ structure can divide the algorithm into three general steps:
input data, photon generation and output.
The input data cointains the source parameters, such as energy and excitation spectrum, its geometry and optic parameters. This information is defined according to the experimental setup used, where the exitation spectrum of the equipments’ source is recorded and the geometry between source, sample and detector is measured. The source configuration file is not changed during the iteration process, described in item 3.1.2. The same is valid for the
28 detector, since the majority of the parameters are “factory dependent” and most of the times provided by the manufacturer.
Other information entered as input data is the sample composition and its physical structure. The algorithm, as aforementioned, simulates the exitation spectrum of a given sample under given conditions. For these matters, the information regarding the sample must be known. This might sound confusing at first, since one of the purposes of the simulations conducted in this work is to estimate the samples’ composition and structure themselves; nonetheless this will be cleared up in the upcoming paragraphs.
Sample information can be summarized in: geometry, shape, phases and composition. Each phase has its own composition, in a way that a multi-layered structured can be generated. The composition comprises the density, atomic number of each present element and their mass percentage.
The photon generation step involves the series of calculations needed to determine the trajectory of the photon and its interaction with the sample. The initial trajectory and energy of the photon are randomly generated within the cone of radiation (simulating the beam produced by the source) using a seed acquired from user input data and local time (when running on Windows OS). This photon can either be terminated before reaching the sample or interact with it. If it reaches the sample, this photon will determine whether the interaction is radiative or non-radiative, and, within the tree, determine the type of atom it interacted with and thereafter in which subshell the interaction occurred. Subsequently, the photon will have its energy and direction updated and will be stored in the pool (virtual multi-channel analyzer – MCA).
29 A scheme, adapted from Schoonjans et al. (Schoonjans et al. 2012) is shown in Figure 3 below.
Figure 3 – Block diagram showing in a simplistic way the algorithm structure. Here, the detection process is “forced” in order to reduce run-time, so the loop that takes place after initializing the photon already considers the photon itself as a “detected” one and will only update its energy and trajectory following the interactions it undergoes until reaching the detector. If the MC program would rigorously follow the general geometry outlines, i.e. strictly simulating the trajectory of the photons escaping from the sample towards the detector and computing only the photons that successively hit it, a successful execution of the code would require an amount of over 100 million simulated photons. To illustrate, in a real case scenario making use of a 30 mm² Si(Li)-detector located about 3 cm from the sample surface, only circa 0.5% of the escaping photons arrive at the detector (Vincze et al. 1993). Nevertheless, the approach adopted here has proven successful, validated with several real-world experimental setups.
30 When all the photons are terminated, the simulation stops and writes a file containing the spectrum. In this last step, escape and pile-up peaks may be corrected, according to the users’ preference, and finally the detector response function is applied.
3.1.1 Classes
During the execution of the algorithm, a variety of classes is involved in processing, storing and manipulating the input information. By class, it is meant a C++ object created and used by the algorithm with the purpose of loading parameters from a corresponding file. The program classes are better discussed in Golosio et al. (Golosio et al. 2014) work, where the algorithm is presented in full. Here, only the ones of particular interest will be discussed and briefly explained so the reader can better understand the underlying processes.
- Composition class
The composition class contains an array of the phases that compose the sample. Each of these phases is considered fully homogeneous and are characterized by their chemical elements and their respective mass percentages. This class stores the sample composition data and is used to calculate the absorption coefficient of each phase, according to the theory presented in Chapter 2.
This class is also accessed when the atom selection step is required by the program, so the photon “choses” the atom it is interacting with in the next interaction process and so forth until the photon is terminated.
- Quadric, quadricarray and geom3d classes
In order to simulate the object, it must present a physical volume, delimited and defined as a set of quadric curves, so the simulated photon can interact with the digital sample. The surfaces also define the orientation of the objects surface, separating the outside and inside
31 of the object. Any defined unitary vector, normal to the objects’ surface, will be automatically assumed to have its direction towards the external space.
Geom3d class, in its turn, will compile the written quadric surfaces into one or more objects, accordingly. In the simulations performed, the geometry of the samples was defined as a stack of infinite planes. A series of planes offset in the z axis is written within the
quadricarray file and then compiled into the geom3d file to produce a multilayered structure
that can properly represent the stratified surface of a real object.
The thickness of the layers (phases) can be easily modified in the quadricarray file by simply changing the z offset of the quadric planes.
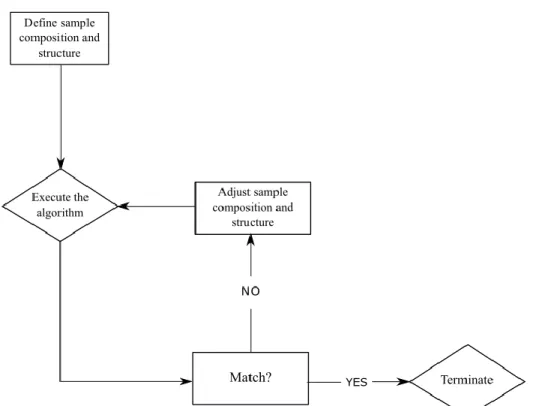
3.1.2 Iteration process
At the given point, the XRMC package is not yet fully automated, requiring time-consuming user intervention to validate the simulated spectra. For the means of estimating a sample structure and composition, the task is even more challenging.
At the end of each execution of the MC code, a spectrum is produced. This spectrum reflects the response of the sample of composition A and geometry B when excited by an X-ray source with known parameters and under known conditions. The simulated spectrum is then superimposed with the experimental one. A confrontation between both spectra is conducted and the data evaluated by the user in order to validate the accuracy between them. If in accordance, i.e. with a sufficiently low difference between experimental and simulated spectra, the input information of the sample is said to be similar enough to the real one. If not, the user updates the composition and geometry of the sample accordingly (now composition A’ and geometry B’) and execute another run.
32 A simple scheme to better illustrate the process is shown in Figure 4 below.
Figure 4 – Block diagram representing the sample composition and structure iteration process.
33 4 Nuragic Civilization and Ancient Metallurgy
The Nuragic civilization was a mostly pastoral and agricultural society (Becker 1980), which is considered native from the island of Sardinia – located in the Mediterranean basin (Figure 5). The nuragic society can be considered a result of political and economic changes through time, underwent by the indigenous population of Sardinia, and allowed by the use of metals, which made possible their development into a more complex and organized society (Contu 2008; Melis 2003; Minoja, Salis, and Usai 2015).
Figure 5 – Map pinpointing the location of Sardinia island.
This particular civilization flourished between the Early Bronze Age and the Early Iron Age. Some scholars define its existence span as ranging from 1700 BC to 238 BC, ceasing with the advent of the Roman occupation. However, others may suggest that it is not suitable to speak about nuragic civilization past 500 BC and even attribute its origin as early as 1900 BC (Depalmas and Melis 2010; Knapp 1990; Melis 2003; Webster 2014). In literature, it is not uncommon to dedicate a whole chapter just to debate the nuragic chronology, since it is rather confusing and it seems to be no agreement on the topic (Webster 2014).
34 Without further ado, a brief discussion on the origins and consuetudes of nuragic culture, such as religious practices and metallurgy knowledge will be given in the following sub-sections; in a way that an interpretation can be properly proposed and thoughtfully discussed over the objects studied within this research.
4.1 History, culture and religion
The nuragic people left a large amount of architectural features and objects behind, in a way it is possible to study and try to reconstruct their society in terms of organization, economics and politics (Depalmas and Melis 2010). Unfortunately, there are no written sources, as the nuragic people had no written language. There are, however, some Roman references, which are relatively later to the nuragic period and thus mostly not very helpful (Melis 2003).
It is believed that the nuragic civilization started developing on the Early Bronze Age (EBA) with the appearance of megalithic graves (corridor dolmens) that further evolved into the peculiar “Tombe dei giganti” – or giants’ tomb –; evolving from individual to collective burials. The nuragic civilization is characterized and named after their particular constructions, the Nuraghi, extensively used from around 1500 BC until 500 BC (Balmuth and Tylecote 1976). Nuraghi can be split into proto-nuraghi and tholos nuraghi, each with its distinct architectural features. Tholos nuraghi are the latest manifestation, or form, of these particular fortress-like constructions. Timaeus, an ancient author, already described on the 4th century BC the similarities between the Sardinian nuraghi and the Aegean tholos, associating Mycenaean and Sards for the first time (Becker 1980).
Some of the more complex tholos nuraghi would present fortification walls (antemurals) and secondary towers surrounding the main tower structure, hence the idea that they would serve as fortifications. These typical nuragic constructions have been the source of strong debate in the past concerning its functions. Some authors as Knapp (Knapp 1990) and Taramelli, aput Becker 1980 (Becker 1980) attributed a metallurgical function to the nuraghi due to the abundant quantity of copper ingots, both plano-convex ingots and oxhide ingots,
35 metalworking tools and stone molds found within them. Giardino, aput Balmuth 1976 (Balmuth and Tylecote 1976) suggests their use for both metal production as well as for access to and collection of resources. Nowadays it is more acceptable to say that the nuraghi were used for both civil and military functions given its variety in complexity, from a single and simple tower on a top of a hill, to a whole fortification complex with antemurals covering a large area and with the presence of auxiliary turrets (Melis 2003).
Nuraghi were often present within settlements (Melis 2003; Webster 1991), not geographically centered in them, but placed in one extremity of the perimeter, surrounded by stone huts, indicating that the settlement was probably developed on a further time past the construction of the nuraghi. They would act as the fortified residence of an hegemonic family (Webster 1991) – or few of them (Melis 2003) – showing the existence of a certain hierarchical organization. Early settlements usually lacked a common space, except for the nuraghi themselves, “meeting huts” and for the so-called sanctuary villages (Melis 2003), which appeared on a later time.
With the development of the nuragic society, huts were progressively transformed into sector huts, were several other activities started being conducted, e.g. religious (Melis 2003). Non-funerary religious practices (or cults), realized within the villages probably took place during the Late Bronze Age or Early Iron Age, when the settlements reached their full extent (Webster 2014). Within the sector huts, round-shaped rooms – called rotundas – composed of a hearth in the center, benches extending thorough the whole perimeter of the room and sometimes with a central water-basin, were unearthed, with characteristics that give rise to an interpretation of their use as for religious purposes (Melis 2003). Before the appearance of dedicated religious sites as the water-temples, rotundas and sanctuary villages, the rituals were conducted on burial sites as the giants’ tomb (Melis 2003; Webster 2014). Betyls (stone idols) were found within some excavated meeting huts, creating a parallel with betyls found in funerary sites and the slots present on the façade stones of some other burial sites, interpreted by Melis (Melis 2003) as used for holding the small stone betyls.
When it comes to religious practices, the nuragic people had a close relation to water (Melis 2003; Webster 2014). The liquid (drinkable) was scarce in Sardinia and the nuragic
36 people attributed a “sacred” status to it. Some theories would relate the occurrence of a severe draught in Europe around 1200 BC to have an influence on nuragic architecture and culture, giving rise to the constructions of wells and springs, thus justifying the raise of water status towards a more sacred perspective (Webster 2014). By any means, these theories are rather complex and out of the scope of this research. What is important is that the nuragic people, in fact, did make use of wells and springs as sacred places (Melis 2003), where several bronze miniatures and sculptures – bronzetti & animaletti – were unearthed (Webster 2014).
The origin of the water-temples as an architectural phenomenon is another whole point of discussion. Due to their intrinsic differences in the execution method, some authors attribute them as non-Sardinian in origin while others vehemently defend their Sardinian origin (Webster 2014). The shape of the main chamber resemble that of the typical tholos nuraghi, but the building techniques presented in some temples have no parallel in Sardinia and are completely alien to nuragic culture and civilization (Webster 2014). A common ground is placed on the idea of culture and technological exchange, which might have took place with neighboring societies outside of the island most likely during the Late Bronze Age (13th century BC) (Becker 1980) for sociopolitical reasons or due to the shortage of resources
(Knapp 1990). Adding to it, nuragic objects were found at Minoan and Etruscan sites and Phoenician bronzi (Webster 2014) and Cypriot copper ingots found at nuragic sites (Atzeni et al. 2005; Balmuth and Tylecote 1976).
Lo Schiavo, aput Knapp 1990 (Knapp 1990) suggests that copper production in Sardinia during the Late Bronze Age was probably carried out under teaching and supervision of Eastern metalworkers. Quoting Becker (Becker 1980) on the cultural exchanges in the Mediterranean, mostly focusing on Sardinian relations during the Bronze Age: “We all
recognize that ideas and techniques do diffuse, especially in the context of the complex trade and exchange networks which developed so extensively during the Bronze Age”.
It is hard to neglect that a strong relation between neighboring civilizations took place within central and eastern Mediterranean, involving the exchange of merchandise, knowledge and culture.
37 4.2 Metallurgy
4.2.1 Ore deposits
For a long time Crete has been taken as the major source of copper in the Mediterranean. In the 70’s and 80’s (and even before that) archaeologists always debated on the importance and relevance of Sardinia on the metal trade scenario of the Mediterranean basin (Becker 1980). Whether if Sardinia was or was not a center of production is a long and exhaustive discussion. Today, the facts point that Sardinia possibly had abundant sources of copper and native copper available to ancient people and, independent of the origin of the technology and skills employed on the manufacturing of metal objects, it is undeniable that nuragic people did produce several copper, copper-arsenic and bronze artifacts with mastery through its existence (Atzeni et al. 2005).
In this context, metallic ores exploitation in Sardinia can be considered a strong tradition, beginning from ancient times and lasting until the modern age. The remains of mining and metallurgical activities, still seen today, make possible together with geological knowledge, the reconstruction of what would the available ores sources for ancient people be (Atzeni et al. 2005; de Caro 2017).
The well-known copper ore sources, probably exploited by ancient people in Sardinia are pinpointed on Figure 6 below, adapted from Atzeni et al. (Atzeni et al. 2005).
38 Figure 6 – Ancient copper-ore deposits widespread in Sardinia.
Sardinia is rich in copper and mostly lead ore deposits. The island is also known for its silver deposits (associated to lead, as argentiferous galena) probably known to Romans and Carthaginians at their time (Atzeni et al. 2005). The metallogenic province of Sardinia has a predominance of lead-zinc mineralization, generally accompanied of quartz, barite and fluorite. The earliest exploitation of metals in Sardinia is usually attributed to the Ozieri culture, predecessors of the nuragic culture by couple millennia (3500 – 3000 BC) who made use of native copper to produce artefacts (Atzeni et al. 2005).
Tin, as a very important and expensive material at the time, was unlikely to be obtained from the mineralization in Sardinia. Its use is often associated with trade routes in the Mediterranean, which further add to the discussion on cultural and material exchange at the time (Atzeni et al. 2005; Knapp 1990).
39 Across its territory, substantial amounts of native copper could be found within the ore deposits. Several tons of oxidized copper were also available in ancient times alongside other copper ores such as malachite, azurite, pyrite, chalcopyrite, covellite, chalcocite, enargite and tennantite. For these reasons, typical Sardinian smelted coppers would likely present high quantities (as several ppm’s) of bismuth and antimony, as well as reasonably large amounts of lead and several hundreds of ppm’s of iron (Atzeni et al. 2005; Balmuth and Tylecote 1976).
Extensive works have been done on tracing the isotopic signature of lead for several ore deposits across the Mediterranean throughout time, making it possible to distinguish the origins of the raw materials employed on the fashioning of copper and bronze artefacts by lead isotopic analysis (LIA) (Attanasio, Bultrini, and Ingo 2001; de Caro 2017).
4.2.2 Technology: the nuragic metalwork
In 1908, at the nuraghe of Palmavera, several bronze and copper objects as well as casting tools and slags were unearthed. With this, Taramelli, at his time, suggested that metalworking knowledge from the East was surely imported by nuragic people; for the similarities between the working tools unearthed at Palmavera (and other nuragic sites in Sardinia) with Minoan and Aegean tools was far too much for them to be considered a native Sardinian production (Becker 1980). In anyways, Taramelli ideas reflect an idea of his time, where much attention was given to Cypriot archaeology, while Sardinia archaeology was left in a secondary level of importance (Becker 1980).
Much thought has been put on the origins of copper used by nuragic people, and not until few decades ago, it was quite acceptable that the vast majority of copper was of foreign origin, despite the findings implying the opposite from an archaeological perspective (Atzeni et al. 2005; Balmuth and Tylecote 1976; Becker 1980; Knapp 2000). Knapp (Knapp 1990, 2000) was left astonished by such a thought, since Sardinia, as afore mentioned, was a copper-rich land being very unlikely that nuragic people, having several tons of copper available, would rather import ingots than manufacturing them. This gave the spark needed
40 to a feverous discussion within the scientific community, where most archaeologists refused to accept the results published by Stos-Gale et al. (1997) (Stos-Gale et al. 1997), which stated that near all copper oxhide ingots from the Mediterranean dating from the 13th century BC onwards were produced in the north of Cyprus.
The controversy on the origin of copper was great despite the availability of analytical techniques since some several decades ago. Scholars were commonly unilateral on the topic, attributing the status of “production center” to one place or another, while, in reality; it is more likely that a large exchange network existed at the time, from the Late Bronze Age onwards, connecting Central and East Mediterranean (Atzeni et al. 2005; Becker 1980).
Nowadays, a common ground can be set around a principle of culture exchange, where several Mediterranean cultures were in contact with one another. Lead isotope analysis, together with other elemental analytic techniques have been increasingly used, evidencing that objects (including copper ingots (Begemann et al. 2001)) from different cultures were indeed traded inter-cultures and thus giving a scientific bias to a cultural exchange theory.
For over four decades, lead isotope analysis (LIA) has been applied to archaeometrical purposes. One of the reasons why, even with the advent of LIA analysis, archaeologists would behave skeptically towards the scientific results, is due to the lack of a normalization or standardization between labs, yielding great fluctuations in the results. Chase, aput Becker (1980) (Becker 1980) tried in fact to determine the validity of elemental analysis and has shown that indeed there were great fluctuations in the results, inducing a further distrust upon the scientific methods at the time. To illustrate, it was only less then couple decades ago with the enhancements in technology, mostly in computational processing capabilities and the manufacturing of more precise equipment, that several oxhide ingots were finally accepted to be associated to northern Cypriot mineralization (Atzeni et al. 2005; Moravetti et al. 2014; Stos-Gale et al. 1997).
Even though the majority of oxhide ingots are associated to Cypriot production, the role played by Sardinian people on the Bronze Age Mediterranean metallurgy scenario cannot be diminished. Several archaeological evidences and hoards from different sites spread
41 throughout the island show Nuragic civilization’s outstanding metalworking capabilities. With the sites of Ittireddu, Pattada, Bonnaro, Serra Ilixi, Serra Orrios, Tharos, Ilos and Sorgono (to mention some) summing over tenths of dozens of metal-industry associated objects (Atzeni et al. 2005; Moravetti et al. 2014). Moreover, the nuragic society has a local metalworking culture that precedes them, as the Ozieri culture and the case of the Argaric swords from di S. Iroxi (Atzeni et al. 2005), that attest the impossibility of Sardinian swords being imported from El Agar, being thus an authentic Sardinian production.
The artefacts so far unearthed indicates that nuragic people may have shared the same technological level as surrounding contemporary societies (Atzeni et al. 2005). When smelting copper, the use of ground furnaces or more complex and elaborated furnaces (with tuyères) and crucibles was widespread (Atzeni et al. 2005; Gallin and Tykot 1993). The molds were either single-faced or bi-faceted stone molds (Moravetti et al. 2014) or lost-wax molds (Gallin and Tykot 1993). Some thought is also given on the usage of sand molds (Atzeni et al. 2005). The latter is hard to say with certainty, since no archaeological evidence can be found due to the molding condition itself, i.e. the mold is always destroyed after its use.
Copper was used in its “pure” form or alloyed with arsenic or tin. Copper-arsenic alloys were firstly introduced and, on a later time, the use of tin over arsenic became common and widespread (Atzeni et al. 2005). Some scholars affirm that nuragic people used lead as alloying element as well, creating ternary alloys of Cu, Pb and Sn. There are in fact evidences, which supports this line of thought. Lead objects such as clamps for repairing pottery (Atzeni et al. 2005), lead ingots (Moravetti et al. 2014) and the presence of high percentage of lead in bronze artefacts (around 9 wt%) (Schiavon et al. 2016) strongly suggests the intentional use of lead as alloying element. Moreover, analysis performed on crucible fragments from Nuraghe Santa Barbara demonstrate that lead was probably added to bronze to improve its casting properties (Gallin and Tykot 1993).
Begemann et al. (Begemann et al. 2001) investigated almost two decades ago 75 copper and bronze objects, from which 49 are ingots of mixed typologies – oxhide, plano-convex or conical, from the nuragic period in Sardinia. Almost all ingots are of pure copper with few