Damping identification in a stress-ribbon footbridge
Álvaro Cunha
Associate Aggregate Professor, Faculty of Engineering of the University of Porto (FEUP), Portugal Elsa Caetano
Assistant Professor, Faculty of Engineering of the University of Porto (FEUP), Portugal Carlos Moutinho
Assistant, Faculty of Engineering of the University of Porto (FEUP), Portugal Filipe Magalhães
Assistant, Faculty of Engineering of the University of Porto (FEUP), Portugal
ABSTRACT: This paper describes the different types of dynamic tests (hammer, shaker, free and ambient vi-bration tests) recently performed on the stress-ribbon footbridge of FEUP Campus, with the purpose of achieving an accurate identification of the most significant modal parameters, getting better sensitivity with regard to the advantages and drawbacks associated to the application of the alternative identification tech-niques employed. Due to the enormous influence that damping has on the structural simulated response under pedestrian loads, particular attention has been dedicated to the identification of modal damping factors.
1 INTRODUCTION
The Laboratory of Vibrations and Monitoring (ViBest, www.fe.up.pt/vibest ) of FEUP is presently involved in the development of the European re-search project “Advanced Load Models for Syn-chronous Pedestrian Excitation and Optimized De-sign Guidelines for Steel Footbridges (SYNPEX)”, coordinated by RWTH Aachen.
One of the ongoing tasks of this project is the de-velopment of dynamic tests in existing lively foot-bridges, in Portugal and Germany, in order to obtain accurate estimates of their most significant dynamic properties, characterize the corresponding dynamic response due to the passage of a single pedestrian or groups of pedestrians and evaluate the level of im-portance of the human induced vibrations, from the human comfort point of view.
The stress-ribbon footbridge of FEUP, whose lively behaviour was early detected, was selected as an example for this research.
In this context, the present paper describes the dif-ferent types of dynamic tests (hammer, shaker, free and ambient vibration tests) recently performed on that bridge with the purpose of achieving an accurate identification of the most significant modal parame-ters, getting better sensitivity with regard to the ad-vantages and drawbacks associated to the applica-tion of the alternative identificaapplica-tion techniques employed.
Due to the paramount influence that damping has on the structural response, particular attention has been dedicated to the identification of modal damp-ing factors.
2 THE BRIDGE
The bridge, which establishes a link between the main buildings and the students’ canteen, was de-signed by ENCIL (1998) and its deck is a very slen-der stress-ribbon concrete slab, continuous over two spans (Figure 1). The slab embeds all four prestress-ing cables and it takes a catenary shape over the two spans, with a circular curve over the intermediate support. Figure 2 presents the elevation of the deck. The two spans 28m and 30m long and the 2m rise from the abutments to the intermediate pier were the starting points for the definition of the bridge struc-tural geometry. The constant cross-section is ap-proximately rectangular with external design dimen-sions of 3.80mx0.15m.
Figure 1. View of the footbridge.
The construction method suggested by the bridge designer sets the following steps:
(i) installation and progressive prestressing of all ca-bles to about 750kN each; (ii) hanging of 1m long precast segments from the cables, starting from the abutments and ending at the external limits of the deviating saddle over the intermediate support; (iii)
casting of the concrete slab, with formwork provided by the precast segments; casting should be made continuously in an approximately symmetric fashion with respect to the intermediate support, and it should be followed by an injection of the joints be-tween precast segments; (iv) eventual modification of final prestressing in all cables, for correction of geometry; (v) injection of all prestressing ducts with cement grout.
The intermediate support is made of four steel pipes forming an inverted pyramid hinged at the base, with horizontal resistance provided only by the prestress-ing cables. Therefore, the structure was supported longitudinally during the construction phase.
Z=120.50 Z=1119.00 Z=126.65 Z=124.50 Z=124.50 Z=119.00 7.50 10.00 5. 00 10.00 61.00 3.00 10.00 0.4 0 28.00
Figure 2. Elevation of the footbridge.
3 FINITE ELEMENT MODELLING AND UPDATING
The performance of different types of modal identi-fication tests was preceded by the development of a finite element model of the bridge, which was con-veniently updated on the basis of an initial ambient vibration test (performed on the 28th March 2003 – Test 1) using a sensitivity analysis. This work, ex-tensively described in (Caetano & Cunha 2004), in-volved the construction of the following numerical models:
Model 1: Modelling the bridge deck as a series of
beam elements with the geometry corresponding to the design configuration;
Model 2: Modelling the bridge deck as a series of
beam elements with the geometry corresponding to the real measured profile;
Model 3: Discretization of the deck in truss finite
elements with the cables’ axial stiffness (neglecting bending stiffness), adjusting the initial cables tension so as to obtain the measured longitudinal profile af-ter progressive application of the loads;
Model 4: Discretization of the deck in truss finite
elements, with progressive loading and activation of beam elements connecting the nodes of the truss elements, to take into account the bending stiffness of the concrete slab;
Final Model: Discretization of the deck in truss
fi-nite elements, with progressive loading and activa-tion of beam elements; Consideraactiva-tion of partial rota-tions between beam elements to simulate the lack of sealing of the joints; Reduction of the area and iner-tia of the beam elements to simulate the effects of cracking and lack of adherence between precast and in situ concrete.
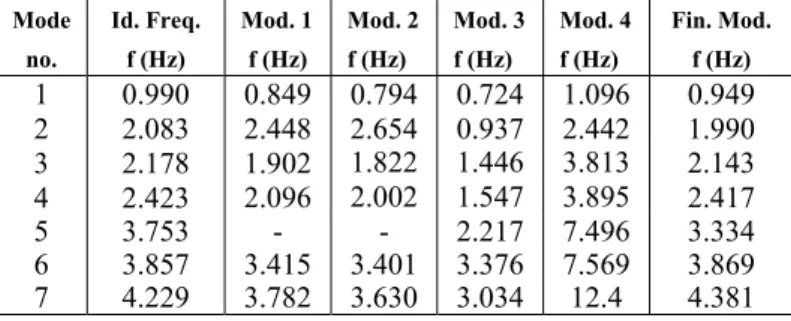
Table 1 summarizes the values of natural frequen-cies calculated on the basis of these models, allow-ing a comparison with the correspondallow-ing identified frequencies. Inspection of this table shows that the several iterations of the finite element updating pro-cedure led to very good correlation between identi-fied and calculated natural frequencies in the Final
Model. Similar conclusion can also be drawn in
terms of comparison of identified and calculated mode shapes (Caetano & Cunha 2004), as shown in next section.
Table 1. Calculated vs identified natural frequencies (Test 1).
Mode no. Id. Freq. f (Hz) Mod. 1 f (Hz) Mod. 2 f (Hz) Mod. 3 f (Hz) Mod. 4 f (Hz) Fin. Mod. f (Hz) 1 0.990 0.849 0.794 0.724 1.096 0.949 2 2.083 2.448 2.654 0.937 2.442 1.990 3 2.178 1.902 1.822 1.446 3.813 2.143 4 2.423 2.096 2.002 1.547 3.895 2.417 5 3.753 - - 2.217 7.496 3.334 6 3.857 3.415 3.401 3.376 7.569 3.869 7 4.229 3.782 3.630 3.034 12.4 4.381
4 INPUT-OUTPUT / OUTPUT-ONLY MODAL IDENTIFICATION
In a subsequent stage of research, additional modal identification tests were developed in order to com-pare the performance and estimates obtained using both input-output and output-only identification techniques. These tests were performed on the 5th October (Test 2) and complemented by some addi-tional measurements on the 6th November 2004 (Test 3).
1 2 3 4 5 6 7 8 9
10 12
13 14 15 16 17 18 19 20 21
11
Figure 3. Measurement points in modal identification tests. 4.1 Hammer test
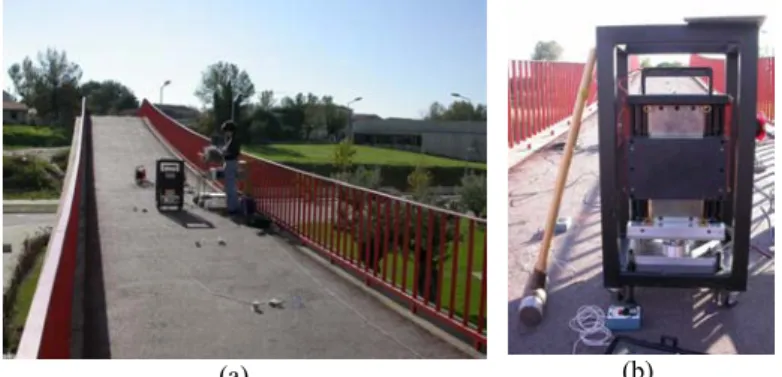
Test 2 comprehended a conventional modal analysis test performed using an impact hammer, a set of four piezoelectric accelerometers and an eight-channel Fourier analyzer (Figure 4).
(a) (b)
Figure 4. (a) Application of hammer impulse; (b) Data acquisition system.
The impact hammer has a force sensor at the tip with a sensitivity of 1V/0.23kN, which allows the measurement of the applied force. The piezoelectric accelerometers have a sensitivity of 1V/g. These de-vices are connected to signal conditioners for further amplification of the signal. The impulsive loads were always applied at a fixed point at each span (nodes 3 or 19), and the corresponding response was measured at four different points in each setup. The evaluation of frequency response functions (FRFs) relating the input force and the output accelerations was performed in the frequency range 0-200Hz, considering an individual time of acquisition of 16s and the average over 8 spectral estimates, which led to a frequency resolution of 0.0625Hz. 1,00E-06 1,00E-05 1,00E-04 1,00E-03 1,00E-02 1,00E-01 0 10 20 30 40 50 Frequency (Hz) Ampli tude FRF 17 -19 0 0,1 0,2 0,3 0,4 0,5 0,6 0,7 0,8 0,9 1 Co he re nc e FRF Coherence
Figure 5. FRF and coherence relating force applied at node 19 with acceleration measured at node 17.
Figure 5 shows one the FRFs obtained, relating the input force and output acceleration at nodes 19 and 17, respectively, as well as the respective coher-ence function. Inspection of all the FRFs obtained shows that their peaks allow to easily identify the fundamental natural frequencies of the footbridge, whose values (0.979, 2.050, 2.446, 3.629, 4.104 and 5.374 Hz) agree rather well with the identified fre-quencies at the initial ambient vibration test (Caetano & Cunha 2004). However, the relatively short time of each acquisition (16s), associated to the application of each impulsive load, led to a relatively low frequency resolution (0.0625Hz) of the spectral estimates, whose peaks became wider. Accordingly, the separation of close modes and the accurate iden-tification of modal damping factors (clearly overes-timated) became impossible.
On the other hand, despite the very high values of the coherence functions in the frequency range 10-200 Hz, their values fall drastically in the fre-quency range (0-10Hz), evidencing the difficulty of the hammer to excite significantly the most relevant modes of vibration in that range, with regard to the level of noise induced by ambient factors, like wind. These aspects also precluded the obtainment of reli-able estimates of modal components.
4.2 Electrodynamic shaker test (random excitation) Test 2 was simultaneously used to perform a con-ventional modal analysis test using, as alternative excitation technique, an electrodynamic shaker con-troled by the Fourier analyzer (Figure 6).
(a) (b)
Figure 6. (a) Application of random shaker load; (b) Detail of the shaker and load cells.
In a first instance, the shaker was placed in the longer span (at nodes 3 or 5), applying a random load in the frequency range 0-6.25Hz, the corre-sponding structural response being measured by the piezoelectric accelerometers at four different points in each setup. The evaluation of frequency response functions (FRFs) relating the input force and the output accelerations was performed, in this case, in the frequency range 0-6.25Hz, considering an indi-vidual time of acquisition of 128s, an average over 8 spectral estimates (with 50% overlapping), and ap-plying a Hanning window, which led to a higher fre-quency resolution (0.01563Hz).
As some of the modes of vibration only involve the motion of one of the spans, the shaker was sub-sequently placed (Test 3) in the shorter span (at nodes 19 or17).
Figure 7 shows a comparison of two estimates of a FRF, obtained through the application of the shaker and the hammer. This plot shows two interesting as-pects: (i) the much better definition of the peaks of the FRFs allowed by the higher frequency resolution of the spectral estimates associated to the shaker; (ii) the higher capacity of the shaker to excite the fun-damental modes of vibration of the footbridge, with frequencies below 10Hz. 1,00E-06 1,00E-05 1,00E-04 1,00E-03 1,00E-02 1,00E-01 1,00E+00 1,00E+01 0 1 2 3 4 5 6 7 Frequency (Hz) Am plit ude FRF 6-3 Shaker Hammer
1,00E-07 1,00E-06 1,00E-05 1,00E-04 1,00E-03 1,00E-02 1,00E-01 1,00E+00 0 1 2 3 4 5 6 7 Frequency (Hz) A m plit u de FRF 3 -5 Synthesized Measured
Figure 8. Measured vs synthesized FRFs.
-3 -2 -1 0 1 2 3 0 10 20 30 40 50 60 Amb.: 0.990Hz Num: 0.949Hz Shaker: 0.972Hz -3 -2 -1 0 1 2 3 0 10 20 30 40 50 60 Amb.: 2.083Hz Num: 1.990Hz Shaker: 2.043Hz -4 -2 0 2 4 0 10 20 30 40 50 60 Amb.: 2.178Hz Num: 2.143Hz Shaker: 2.072Hz -3 -2 -1 0 1 2 0 10 20 30 40 50 60 Amb.: 2.423Hz Num: 2.417Hz Shaker s: 2.382Hz -3 -2 -1 0 1 2 3 0 10 20 30 40 50 60 Amb.: 3.857Hz Num: 3.869Hz Shaker: 3.590Hz -3 -2 -1 0 1 2 0 10 20 30 40 50 60 Amb.: 4.229Hz Num: 4.381Hz Shaker s: 4.165Hz -10 -5 0 5 10 0 10 20 30 40 50 60 Amb.=5.726Hz Num.:6.820Hz Shaker: 5.461Hz
Figure 9. Identified vs calculated modes of vibration.
The identification of the modal parameters of the bridge was done by applying a multi-degree-of-freedom identification algorithm in the frequency domain (RFP method) (Han & Wicks 1989) to the FRFs obtained. Figure 8 shows, for instance, a com-parison between amplitudes of one of the measured FRFs and the corresponding synthetized FRF, on the basis of the identified modal parameters, showing the good agreement achieved.
Table 2. Identified frequencies and modal damping ratios. Natural freq. (Hz) Damping factors (%) Mean St. deviation Mean St. deviation 0.972 2.043 2.072 2.382 3.590 4.165 5.461 0.005 0.013 0.020 0.005 0.039 0.023 0.036 1.07 1.40 1.51 1.72 1.77 2.00 1.92 0.24 0.53 0.79 0.14 0.25 0.17 0.24 Table 2 resumes mean values and standard devia-tions of estimates of natural frequencies and modal damping factors obtained by this approach. It’s worth noting that the difference between modal es-timates achieved in Tests 2 and 3 were irrelevant.
Figure 9 presents the identified modes of vibra-tion, as well as the corresponding calculated modes and the identified modes at the initial ambient vibra-tion test (Test 1).
4.3 Electrodynamic shaker test (resonant / free
vibration response)
The electrodynamic shaker was also used to induce modal resonance, by applying sinusoidal excitations with frequencies in correspondence with some of the previously identified natural frequencies. By stop-ping suddenly that excitation, it was possible to measure the corresponding free vibration response (Figure 10) at several points, and extract some accu-rate estimates of modal damping factors.
F=2.015625Hz -5.00E-03 -4.00E-03 -3.00E-03 -2.00E-03 -1.00E-03 0.00E+00 1.00E-03 2.00E-03 3.00E-03 4.00E-03 5.00E-03 0 10 20 30 40 50 60 Tempo (s) Mar ca 3 F= 2.0156 25Hz y = 4.6684e-0.1762x y = 29.313e-0.2161x 0 0.0 005 0 .001 0.0 015 0 .002 0.0 025 0 .003 0.0 035 0 .004 40 5 0 60 Tempo ( s) A cel er aç ão ( g) Marca 3 Marca 3
Figure 10. Free vibration modal response and fitting of the free decay response envelope.
Table 3 shows the estimates obtained following this procedure with regard to four different modes of vi-bration. Observing the decay of the response enve-lopes, one can see that certain modal factors increase significantly with the amplitude of oscillation. Therefore, Table III presents both the estimate of damping at the beginning of the decay and an aver-age value.
Table 3. Modal damping factors identified from the measured free vibration responses.
Identified Modal damping factor (%)
frequency (Hz) initial average
0.972 2.043 2.072 3.590 1.26 1.20 1.80 1.89 1.22 1.09 1.24 1.81 The increase of damping with the amplitude of oscil-lation could be still better evidenced by analyzing the free vibration response of the bridge excited at resonance with one person skipping at a fixed posi-tion, with an adequate pacing rate and stopping its movement suddenly. Figure 11 shows some records obtained by this procedure, as well as the signifi-cantly higher modal damping estimates achieved.
-0,015 -0,01 -0,005 0 0,005 0,01 0,015 20 25 30 35 Time (s) D ispl acement (m ) Stat. 3 Stat. 5 -1,5 -1 -0,5 0 0,5 1 1,5 0 5 10 15 20 25 30 35 40 45 50 Time (s) Ac ce le ra tio n (m /s 2 ) Stat. 3
Figure 11. Free vibration response: skipping at 1Hz, station 16 (top); skipping at 2Hz, station 3 (bottom).
4.4 Ambient vibration tests
During the present research, two ambient vibrations tests were performed. The first one took place in March 2003 (Test 1), with the aim of achieving es-timates of the most relevant modal parameters of the bridge, so as to update the respective finite element modeling (Caetano & Cunha 2004). The second measurement campaign (Test 2) was developed in October 2004, in parallel with the hammer and shaker tests, in order to enable coherent comparison of estimates extracted through the different identifi-cation techniques. Both ambient vibration tests were
based on the use of 4 triaxial seismographs duly synchronized by GPS, provided with 18 bit A/D converters. Two of them were placed at fixed posi-tions (reference points at 1/3 span), while the other two were successively placed at the other measure-ment points indicated in Figure 3. The sampling fre-quency was 100Hz and the time of acquisition was at least 10 minutes in each setup, in order to obtain sufficiently high frequency resolution spectral esti-mates. The extraction of modal parameters was done using the classical Peak-Picking (PP) (Felber 1993), the Frequency Domain Decomposition (FDD) (Brincker et al. 2000) and the Data Driven Stochas-tic Subspace Identification (SSI-DATA) (Van Over-schee & De Moor 1996).
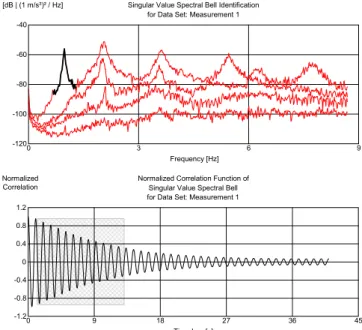
[dB | (1 m/s²)² / Hz] Frequency [Hz] 0 3 6 9 -120 -100 -80 -60 -40
Singular Value Spectral Bell Identification for Data Set: Measurement 1
Normalized Correlation Time Lag [s] 0 9 18 27 36 45 -1.2 -0.8 -0.4 0 0.4 0.8 1.2
Normalized Correlation Function of Singular Value Spectral Bell for Data Set: Measurement 1
Figure 12. Singular values spectra (FDD) and normalized cor-relation function (mode 1).
Table 4. Identified natural frequencies (Hz).
Test 1 Test 2 PP FDD SSI-DATA FDD 0.990 2.083 2.178 2.423 3.857* 4.229 5.726 0.984 2.093 2.101 2.411 3.745 4.239 5.547 0.983 2.083 2.136 2.408 3.743 4.241 5.705 0.965 2.018 2.023 2.341 3.594 4.092 5.407 (*) – coupled mode (weakly defined) around 3.753Hz. Table 5. Identified modal damping factors (%).
Freq. (Hz) Test 1 Test 2
PP FDD SSI FDD 0.990 2.083 2.178 2.423 3.857 4.229 5.726 1.65 1.11 1.37 1.97 1.84 2.19 2.04 1.56 1.27 2.10 1.84 2.12 2.21 2.82 1.51 1.31 1.98 1.09 2.37 2.13 1.74 ξ ≅ 1.7% ξ ≅ 2.6%
Figure 12 shows, for instance, spectra of the first singular values associated to the application of the FDD method to data captured at Test 2. This figure shows clearly the location of the most significant natural frequencies and, in particular, the existence of two close modes around 2Hz, which could be bet-ter separated than using the Peak-Picking method. This figure shows also the normalized correlation function associated to the first modal response. Tables 4 and 5 resume the estimates of natural fre-quencies and corresponding modal damping factors identified on the basis of the two ambient vibration tests performed.
4.5 Comparison of modal estimates
Tables 6 and 7 summarize estimates of natural fre-quencies and modal damping factors achieved by application of different input-output or output-only modal identification techniques.
With regard to the natural frequencies, one can eas-ily observe in general a very good agreement of es-timates. Notwithstanding, one can notice that the hammer technique was not able to detect the two close modes around 2Hz. Moreover, some slight de-crease of frequencies from Test 1 (March 2003) to Tests 2 and 3 (Oct./Nov. 2004) is also detected, probably due to some structural degradation and temperature effects.
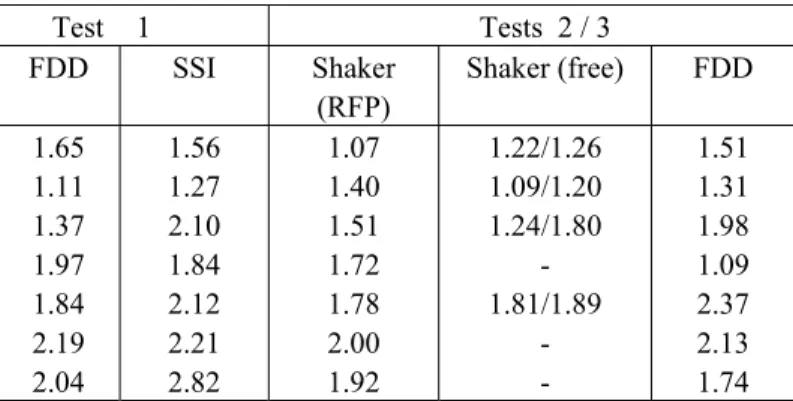
With regard to the modal damping factors, one can also observe a reasonable agreement of results provided by the output-only techniques with regard to the shaker tests, despite the considerably higher scatter of estimates.
Table 6. Identified natural frequencies (Hz).
Test 1 Tests 2 / 3
PP FDD SSI Hammer Shaker FDD
0.990 2.083 2.178 2.423 3.857 4.229 5.726 0.984 2.093 2.101 2.411 3.745 4.239 5.547 0.983 2.083 2.136 2.408 3.743 4.241 5.705 0.979 2.051 - 2.446 3.630 4.100 5.374 0.972 2.043 2.072 2.382 3.590 4.165 5.461 0.965 2.018 2.023 2.341 3.594 4.092 5.407
Table 7. Identified modal damping factors (%).
Test 1 Tests 2 / 3 FDD SSI Shaker (RFP) Shaker (free) FDD 1.65 1.11 1.37 1.97 1.84 2.19 2.04 1.56 1.27 2.10 1.84 2.12 2.21 2.82 1.07 1.40 1.51 1.72 1.78 2.00 1.92 1.22/1.26 1.09/1.20 1.24/1.80 - 1.81/1.89 - - 1.51 1.31 1.98 1.09 2.37 2.13 1.74 5 CONCLUSION
The modal identification tests described in this paper were performed to obtain accurate estimates of the most relevant modal parameters of the footbridge, allowing the convenient calibration of the corre-sponding finite element modeling used to simulate the passage of pedestrians on the bridge, as well as a comparison of the performance of alternative identi-fication techniques.
As the influence of damping properties on the structural dynamic response is paramount, special at-tention has been given to the identification of modal damping factors. From this point of view, the results obtained permit, in particular, to draw the following conclusions:
a) The hammer technique looks inappropriate to ac-curately identify modal damping factors in this type of slender structures, due to some difficulty of excit-ing the fundamental modes of vibrations and to the low frequency resolution associated to the corre-sponding spectral estimates;
b) The electrodynamic shaker, though relatively heavy and difficult to transport, provides much bet-ter estimates by using multi-degree-of-freedom in-put-output identification techniques;
c) Moreover, this equipment permits to obtain the free vibration response of the bridge after inducing modal resonance, which is in fact the best procedure to extract accurate modal damping estimates;
d) Despite some more significant scatter of the damping estimates, the application of output-only modal identification techniques (FDD and SSI) seems to provide identified values with a reasonable agreement with regard to those obtained with the shaker (relative errors inferior to 20%, in general). ACKOWLEDGEMENTS
This work was developed in the context of the european research pro-ject “Advanced Load Models for Synchronous Pedestrian Excitation and Optimized Design Guidelines for Steel Footbridges (SYNPEX)”, supported by EU (Programme of the Research Fund for Coal and Steel). The authors acknowledge the corresponding funding support.
REFERENCES
ENCIL 1998, U. P. Pólo 2, Passagem para Peões - Projecto Base. Caetano, E. & Cunha, A. 2004, Experimantal and Numerical
Assessment of the Dynamic Behaviour of a Stress-Ribbon Bridge, Structural Concrete, Journal of FIB, 5, No 1, pp.29-38.
Han, M-C & Wicks, A.L. 1989, On the application of Forsythe or-thogonal polynomials for global modal parameter estimation, Proc. 7th int. modal analysis conf., pp.625-630.
Felber, A. 1993, Development of a Hybrid Bridge Evaluation System, Ph. D. Thesis, University of British Columbia, Canada.
Brincker R., Zhang L. & Andersen P. 2000, Modal identification from ambient responses using frequency domain decomposition, In Procceedings of IMAC-XVIII, International Modal Analysis Con-ference, pp.625-630, San Antonio, Texas, USA.
Van Overschee, P. & De Moor 1996, B., Subspace Identification for Linear Systems: Theory-Implementation-Applications, Kluwer Academic Publishers, Dordrecht, The Netherlands.