A Work Project, presented as part of the requirements for the Award of a Masters Degree in Economics from the NOVA – School of Business and Economics.
Paving the way? Female Leadership and Attitudes toward Gender
Carolina Gameiro Nogueira 690
A Project carried out on the Economics course, under the supervision of: Professor José Tavares
Professor Pedro Vicente
Paving the way? Female Leadership and Attitudes toward Gender
Abstract
In a male dominant political world, the cases of female leadership are still a novelty. Looking at the episodes where a woman was head of state or government, the impact on attitudes and perceptions toward gender equality is evaluated. By instrumenting the presence of a female in government with the proportion of female seats in parliament, the results seem to suggest that individuals, when exposed to a woman as an executive political leader, report a higher tendency to agree with statements of gender discrimination.
“If a woman is tough, she is pushy. If a man is tough, gosh, he is a great leader.” Benazir Bhutto, Prime Minister of Pakistan (1988-1990; 1993-1996) “In politics, if you want anything said, ask a man; if you want anything done, ask a woman.” Margaret Thatcher, Prime Minister of the United Kingdom (1979-1990)
1. Introduction
“Female leadership”, as the title states. Why not only “leadership”? Today it is still indispensable to emphasize that a leader is a woman since it is an uncommon event. We do not live in a gender-blind world, so simply “leadership” would not be sufficient and “male leadership” would seem almost redundant since men form the majority of cases. For most people, when they are told about leaders, whether in politics or in the labor market, the image that they conceive is of a tall, pale and male individual.
Regarding general political leadership, The World’s Women 2015, the official United Nations report, highlights some interesting facts and figures. Beginning with the core issue of this project, in 2015, 19 women were heads of state or government, only seven more than in 1995. Among cabinet ministers, female representation increased from 6%, in 1994, to 18% in 2015 while in lower or single houses of parliament only about 1 in every 5 parliamentarians is a woman.
The goal of this paper is to assess the impact of having a woman in a top-level political position in attitudes and perceptions toward gender equality, measured by survey questions that ask for opinions related to the labor market and politics. Since the dependent variables are questions on the degree of agreement with certain statements, we chose the ordered logit model to study this relationship. In the model, several
variables are included such as data on female leadership, country and individual characteristics and country and time fixed effects. Furthermore, the instrumental variables method is performed, yielding more consistent and reliable results than the ordered probit. This method seems to suggest that discrimination towards female leaders is higher when individuals are exposed to executive leaders, with more visible roles.
The rest of this paper is structured as follows. Section 2 presents a brief overview of the existing literature and Section 3 describes the data we collected. Section 4 includes the empirical strategy adopted and section 5 discusses the respective results. Finally, Section 6 concludes.
2. Literature Review
Does having female rather than male political representatives change society’s position relative to gender equality? We present some examples of previous research highlighting preferences and aspirations
Relative to stated preferences, Aalberg and Jenssen (2007) use videotapes of genuine political speeches performed by one female and one male actor. With pre and post-stimuli questionnaires, they associate the male politician to a more knowledgeable, trustworthy and convincing person than the female politician. Interestingly, these stated differences are the result of male answers since men consistently associate the female politician with lower scores while the women attribute identical scores to both politicians. Beaman et al. (2009) provide evidence in the same direction by investigating whether having a female chief councilor has any impact on public opinion towards female leaders. When stated performance between male and female leaders is
identical, villagers still prefer male leaders and perceive female leaders as less effective. While being exposed to female leaders, villagers do not alter their preferences for male leadership. However, this exposure has the power to weaken stereotypes about gender roles in the domestic and public spheres since women leaders are perceived as less effective for the first time but not the second time they are in power. In this sense, exposure is an important means of reducing bias in perceptions regarding female leader effectiveness. Furthermore, Norris and Inglehart (2000) seek to compare attitudes relative to political leadership and are able to demonstrate the existence of a significant and strong relationship between the proportion of women in parliament and the existence of a more egalitarian society that accepts and tolerates women’s political leadership. To conclude the section on preferences, Filla and Larimer (2011) examine gender stereotypes about leadership in Iowa and Pennsylvania, concluding that states with gender-balanced legislation promote positive public attitudes toward gender representation compared to those who do not adopt it. Being exposed to an environment with greater gender equality, respondents are able to change their perceptions.
Now with respect to aspirations and female leaders as role models, Campbell and Wolbrecht (2006) find that, over time, with an increase in the presence of female politicians, adolescent girls are more likely to state a desire to become politically active and actually report political involvement. In addition, Beaman et al. (2012) exploit a randomized natural experiment in India to show that, in this setting, women in leadership positions are perceived as positive role models for the young generation, particularly girls. When there is exposure to female leaders, the gender gap in aspirations for children decline and this effect is visible in parents’ aspirations and also in children’s themselves.
We add to this literature by analyzing an original dataset of female heads of state or government, unlike the previously mentioned papers that rely mostly on female parliamentarians or other forms of governance not as visible to the general population as prime ministers or presidents.
3. Data
This paper uses a data set on female leadership assembled by the authors and based on websites with lists of female heads of state and government such as the Guide
To Women Leaders. To construct the main explanatory variables, we collected several
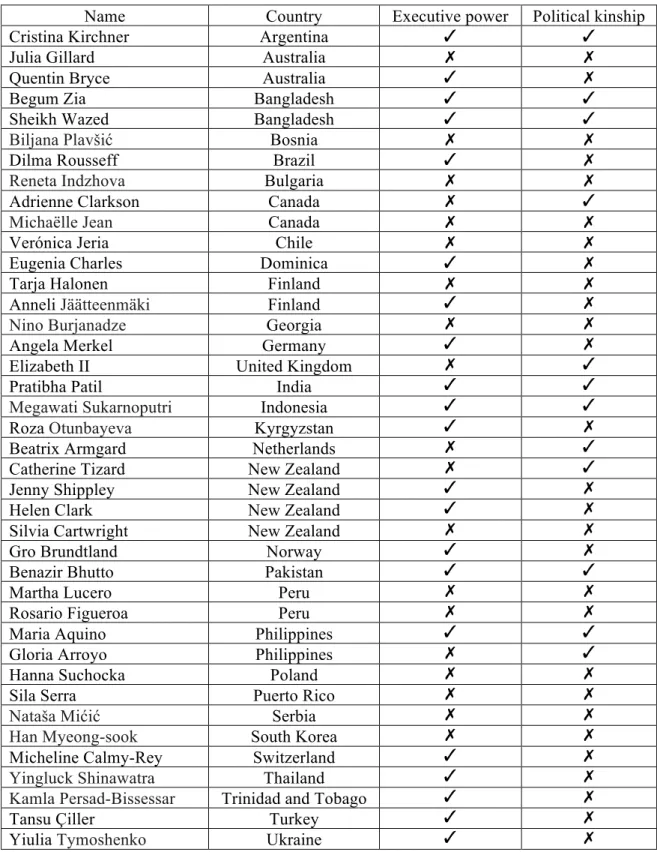
details on these women such as the number of months in office and whether they held executive power or had political kinship. In the end, 40 female leaders were included in the sample and this information is summarized in table 1.
It also relies on other sources of information, namely data from the World Bank Group and the World Values Survey. From the intersection of the referred sources, the resulting data set includes 98 countries, studied from 1981 to 2014 by waves, approximately every 5 years.
3.1. Measures of Female Leadership and Their Characteristics
To measure the presence of women in power, we undertook an online search, identifying all the countries and years with female representatives in high political positions, as either heads of state or government. The main goal was to construct a relative measure of time spent in office in the last 5 years for each woman – woment5. We chose this cumulative measure since the outcomes of interest relate to values and attitudes, which are influenced by long-term events rather than immediate shocks. After
this, we constructed two dummy variables: one relative to executive power and another one capturing political kinship. To form exect5 and pk5, we interacted the two dummy variables with woment5. Similarly, we defined nonexect5 and nonpk5 for females in power without executive power and without political kinship, respectively.
From the universe of 98 countries, 31 had at least one episode of female governance and in total 40 female leaders held office – 20 heads of state and 20 heads of government, 21 held executive power while 19 did not and 12 women had political kinship against 28 without it.
3.2. World Bank Development Indicators and Country Features
Considering that several factors may affect perceptions and values toward gender equality, being also connected to the presence of a woman in power, we selected indicators from the World Bank database to be included in the specifications. The variables measure national income, fertility rate and labor force participation for women. Furthermore, to quantify the existence of voting rights for women and to identify the time when the first female leader was in power in each country, the authors constructed two other variables – vote and firstleader.
3.3. World Values Survey Outcomes and Individual Attributes
As outcomes of interest measuring perceptions of gender equality, we chose two variables from the World Values Survey. These are statements – indicated in table 3 - presented by interviewers to individual respondents who attribute a degree of agreement or disagreement, reflecting personal values. The variables – exec and leaders - relate to two different dimensions of gender equality: labor market and politics. To compare the
results from the specifications with different outcomes, we re-ordered and re-scaled them: they increase with higher discriminatory values. Specifically, they assume the value 0 for total disagreement and the value 1 if the individual totally agrees with the statement.
Finally, we included respondents’ personal attributes, taken into consideration s set of seven characteristics: age, sex, marital status, number of children, educational level, employment status and ethnic group.
4. Empirical strategy
This study aims to measure the impact of having a female representative in top-level government positions on the values and perceptions that people hold relative to women’s placement in society. To begin, we chose the ordered probit model since it tries to capture a change in the probability that a respondent agrees with discriminatory statements. In addition to the variables previously described, country and time fixed-effects are included in the model.
𝑦!"# = ∝ + 𝛽𝐶!"+ 𝜙𝐼! + 𝜌𝑓!" + 𝜑𝐷!+ 𝜃𝐷!+ 𝜇!"#
In this model, 𝑦!"# is the dependent variable, exec or leaders, 𝐶!" is the set of country characteristics, 𝐼! is the set of individual controls, 𝑓!" measures the presence of a woman in power, 𝐷! includes country effects and 𝐷! contains time dummies.
As an alternative approach, the instrumental variables method is performed. To overcome the possible endogeneity between the presence of female leadership and gender equality perceptions, we chose the proportion of seats held by women in national parliaments 5 years before as an instrument. It is reasonable to assume that heads of state and government have more visibility than parliamentarians. We argue that the only
channel through which female parliamentarians may impact society’s perceptions toward gender equality is through the presence of top-level leaders. In this sense, having more women in national parliaments increases the likelihood of a female’s rise to a top-level political position. Although this argument is not flawless, we believe it is an appropriate working assumption.
Using two-stage least squares, the following model was estimated: 𝑓!" = ∝ + 𝜃𝐶!"+ 𝜑𝐼!+ 𝛿𝑧!"+ 𝜖!"
𝑦!"# = ∝ + 𝛽𝐶!"+ 𝜙𝐼!+ 𝜌𝑥!"+ 𝜑𝐷!+ 𝜃𝐷!+ 𝜇!"#
In the first equation, 𝑓!" represents the endogenous variable that measures the presence of female politicians, 𝐶!" is the set of country characteristics, 𝐼! is the set of individual controls and 𝑧!" is the proportion of seats in parliaments occupied by women 5 years before time t. In the second equation, 𝐶!" and 𝐼! are the same as in the first equation, 𝑦!"# is the dependent variable – exec or leaders– and 𝑥!" is the exogenous part of 𝑓!".
5. Results
5.1. Do Political Women Matter? Ordered Probit suggestions
Although this model does not exhibit robust results for the different specifications, we analyse, in this section, the insights it may provide. Furthermore, we used the ordered logit model for all specifications and results are similar in magnitude, sign and statistical significance.
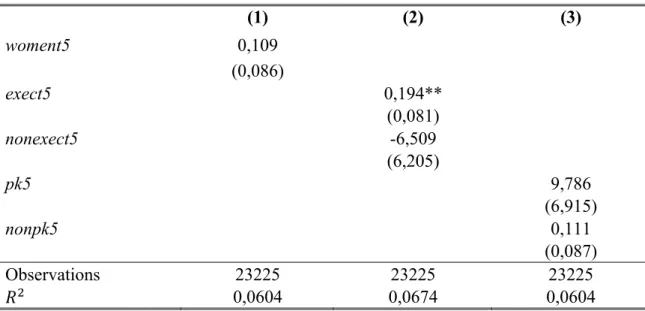
Tables 4 and 5 contain ordered probit regressions using woment5, exect5 and
nonexect5 and also pk5 and nonpk5, mutually exclusively. Since most results are not
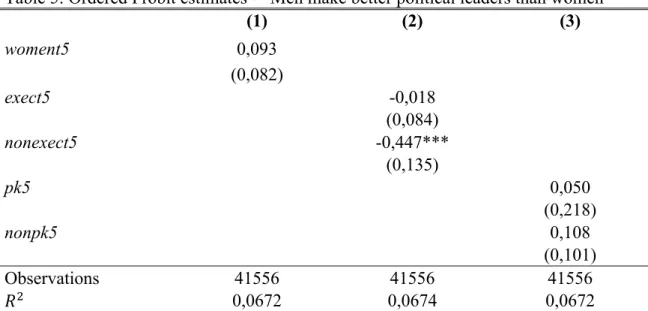
women’s placement in the labor market and politics. In columns (1) for both tables, when a woman was in office for a longer period, measured by woment5, respondents expressed a higher preference for men as both business executives and political leaders and this preference is stronger in the labor market rather than in politics. Looking at the specification with exect5 and nonexect5 in columns (2) for both tables, we observe a lower intolerance in political terms than in terms of business leadership such as in the previous case. Also, we can compare the influence of executive and non-executive women: when faced with executive female leaders instead of non-executives, individuals are less likely to support equal rights for women. Finally, in columns (3) for both tables, there is a smaller increase in agreement with gender discrimination in politics when compared to the impact on perceptions about business executives.
It is also interesting to look at the results for men and women separately. In tables 6 and 7, female respondents report a higher likelihood in totally agreeing with the statements relative to political leaders and business executives and these results are statistically significant at a 10% level. This is a surprising result since past literature provides evidence in the opposite direction.
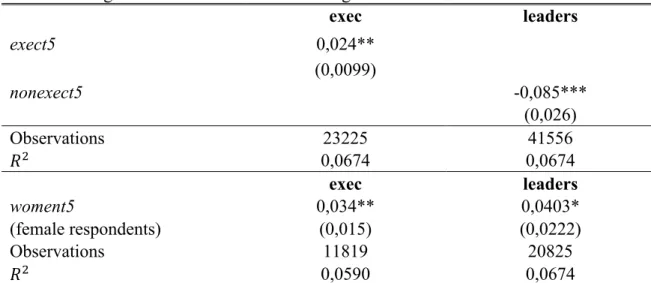
Table 8 contains the marginal effects that are statistically significant, computed from the ordered probit regressions. However, we need to take into account that the independent variables of interest measure the relative number of months a woman was in power in the last 5 years, which translates into 60 months. Considering this, it is necessary to divide the marginal effects by 60 to interpret them. Looking at this table, four interesting results can be analysed. First, individuals are 0,04 percentage points more likely to totally agreeing with gender discrimination in the labor market when a woman is in power for one additional month. Also, for every additional month a female
leader holds non-executive power, respondents are 0,14 percentage points less likely to agree with discrimination in politics.
Knowing that gender plays a very important role, in the second part of table 8, results are reported to the female subgroup. Surprisingly, in both the executive and political field, female respondents tend to agree more with gender discrimination. For every additional month of a woman in power, they are 0,06 percentage points more likely to totally agree that men make better business executives and 0,07 percentage points more likely to totally agree that men make better political leaders.
In the next subsection, we analyse the results from the instrumental variables methodology.
5.2. Female seats in parliament and instrumental variables predictions
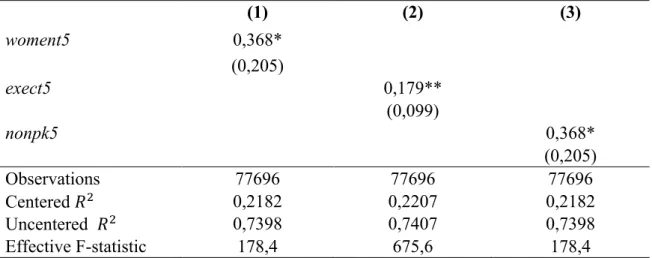
From tables 9 to 12, the results using instrumental variables are reported. Specifically, in tables 9 and 10, we include the variables woment5, exect5 and nonpk5. All results in table 9, which relates to characteristics of business executives, point to a direction of higher gender discrimination. However, we will focus on table 10, with the outcome leaders, since it is expectable that female political leadership influences political perceptions more directly than it influences business perceptions.Beginning with columns (1) in tables 9 and 10 and when exposed to one more month of female leadership, household representatives agree more with discrimination in the labor market but agree less with discrimination in political positions: there is a 0,12 percentage points decrease in the likelihood of agreeing that men make better political leaders. Nevertheless, in column (2) for table 10, when we restrict the sample to executive leaders, with greater visibility, individuals now agree more that women do
not make as good political leaders as men: they are 0,19 percentage points more likely to totally agree with the discriminatory sentence. This may indicate that women are though to be inadequate for the offices with visible power but adequate for more representative roles. Finally, in column (3) for table 10, looking to women without political kinship, there is again a decrease in the likelihood of discriminatory values, with the same magnitude and statistical significance of the first specification with
woment5, in column (1). All these results are significant at a 10% confidence level.
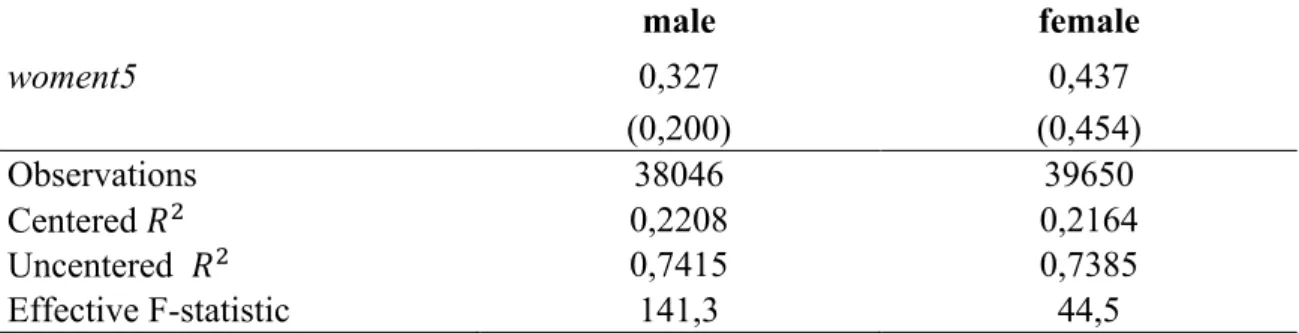
In tables 11 and 12, there is again a higher impact on attitudes toward gender equality relative to placement in politics than in business leadership. Bearing in mind that the results are not statistically significant, we can still consider its insights. The results seem to advocate that there is now a decrease in discriminatory attitudes by females, in opposition to the suggestions of the ordered probit model.
The instrument used was tested in all specifications, using the Montiel-Pflueger robust weak instrument test, and we rejected the null hypothesis of a weak instrument in all cases. In this sense, we are more able to support our findings: there is a decrease in discriminatory values in the general framework and for leaders with no political kinship but a higher reluctance to female executive leaders.
6. Concluding Remarks
In the last few decades, the world has witnessed an increasing number of female leaders, particularly with major political positions, along with an important victory in terms of equal rights for women and men. However, there is room for improvement in both dimensions: in practice, women are still a minority in top-level political positions and there are still cultural discriminatory beliefs that are hard to change.
With this project, we tried investigate if the presence of a female leader could have a positive impact on society by leading to a decrease in the likelihood of a discriminatory response against women. When faced with executive female leaders, individuals stated a higher agreement with discrimination in business leadership and politics. Considering this, we believe that the existence of a backlash effect is one possible explanation. When faced with an untypical situation, society reacts with rejection and adversity, resenting the novelty since it is defying the usual male dominance. In this context, having a female political leader violates the stereotypic expectations. Since the population does not have information on female effectiveness and performance due to the lack of female mandates, their presence may be rejected and negatively perceived. However, when exposed to either female leaders in general, holding executive power or not, and to female leaders without political kinship, respondents stated a lower likelihood of agreement with male dominance. With respect to female leaders in general, impact captured by woment5, it may express acceptance of mainly representative roles without effective power. Relative to nonpk5, measure that includes female leaders without political kinship, respondents may consider that female leaders had to fight harder in pursuing power since they did not own the advantage of being known due to past leaders in the family.
Hopefully, there will be more female presidents and prime ministers in the following years and that will allow for the possibility of future research on their impact in several dimensions, either using more objective outcomes or subjective measures such as the ones we studied.
References
Chapter 5 – Power and decision-making. World’s Women 2015. United Nations: http://unstats.un.org/unsd/gender/chapter5/chapter5.html
Woman Elected or Appointed Heads of State and Government. 1900-2015. Guide to Women Leaders: http://www.guide2womenleaders.com/Female_Leaders.htm
Aalberg, Toril, and Anders T. Jenssen. 2007. “Gender stereotyping of political candidates: an experimental study of political communication”. Nordicom
Review, 28(1), 17-32.
Beaman, Lori, Chattopadhyay Raghabendra, Esther Duflo, Rohini Pande, and Petia Topalova. 2009. "Powerful Women: Does Exposure Reduce Bias?," The Quarterly Journal of Economics, MIT Press, vol. 124(4), pp 1497-1540
Norris, Pipa and, Ronald Inglehart. 2004. "Cultural barriers to women's leadership: A worldwide comparison." Journal of Democracy 3, no. 14: 1-29.
Filla, Jackie, and Christopher W. Lamier. 2011. “Public Attitudes Toward Women as Public Leaders. APSA 2011 Annual Meeting Paper.
Campbell David Edward, and Christina Wolbrecht. 2006. “See Jane Run: Women Politicians as Role Models for Adolescents.” Journal of Politics. Volume 68, Issue 2, pages 233-247.
Beaman, Lori, Esther Duflo, Rohini Pande, and Petia Topalova. 2012. “Female Leadership Raises Aspirations and Educational Attainment for Girls: A Policy Experiment in India”. Science (New York, N.y.), 335(6068), 582–586.
Appendix
Table 1 – Female leaders included in the sample
Name Country Executive power Political kinship
Cristina Kirchner Argentina ✓ ✓
Julia Gillard Australia ✗ ✗
Quentin Bryce Australia ✓ ✗
Begum Zia Bangladesh ✓ ✓
Sheikh Wazed Bangladesh ✓ ✓
Biljana Plavšić Bosnia ✗ ✗
Dilma Rousseff Brazil ✓ ✗
Reneta Indzhova Bulgaria ✗ ✗
Adrienne Clarkson Canada ✗ ✓
Michaëlle Jean Canada ✗ ✗
Verónica Jeria Chile ✗ ✗
Eugenia Charles Dominica ✓ ✗
Tarja Halonen Finland ✗ ✗
Anneli Jäätteenmäki Finland ✓ ✗
Nino Burjanadze Georgia ✗ ✗
Angela Merkel Germany ✓ ✗
Elizabeth II United Kingdom ✗ ✓
Pratibha Patil India ✓ ✓
Megawati Sukarnoputri Indonesia ✓ ✓
Roza Otunbayeva Kyrgyzstan ✓ ✗
Beatrix Armgard Netherlands ✗ ✓
Catherine Tizard New Zealand ✗ ✓
Jenny Shippley New Zealand ✓ ✗
Helen Clark New Zealand ✓ ✗
Silvia Cartwright New Zealand ✗ ✗
Gro Brundtland Norway ✓ ✗
Benazir Bhutto Pakistan ✓ ✓
Martha Lucero Peru ✗ ✗
Rosario Figueroa Peru ✗ ✗
Maria Aquino Philippines ✓ ✓
Gloria Arroyo Philippines ✗ ✓
Hanna Suchocka Poland ✗ ✗
Sila Serra Puerto Rico ✗ ✗
Nataša Mićić Serbia ✗ ✗
Han Myeong-sook South Korea ✗ ✗
Micheline Calmy-Rey Switzerland ✓ ✗
Yingluck Shinawatra Thailand ✓ ✗
Kamla Persad-Bissessar Trinidad and Tobago ✓ ✗
Tansu Çiller Turkey ✓ ✗
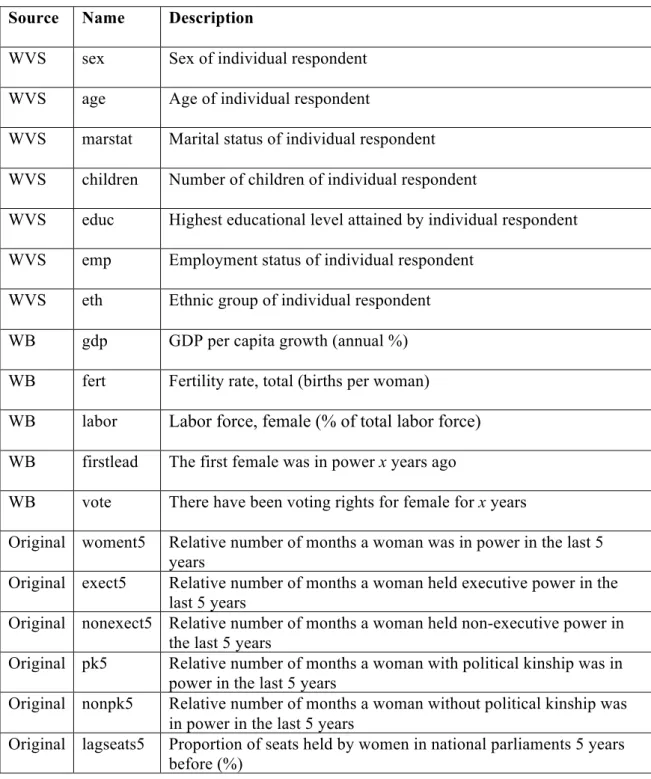
Table 2 – Individual respondents and cross-country characteristics
Source Name Description
WVS sex Sex of individual respondent WVS age Age of individual respondent
WVS marstat Marital status of individual respondent WVS children Number of children of individual respondent
WVS educ Highest educational level attained by individual respondent WVS emp Employment status of individual respondent
WVS eth Ethnic group of individual respondent WB gdp GDP per capita growth (annual %) WB fert Fertility rate, total (births per woman)
WB labor Labor force, female (% of total labor force) WB firstlead The first female was in power x years ago
WB vote There have been voting rights for female for x years
Original woment5 Relative number of months a woman was in power in the last 5 years
Original exect5 Relative number of months a woman held executive power in the last 5 years
Original nonexect5 Relative number of months a woman held non-executive power in the last 5 years
Original pk5 Relative number of months a woman with political kinship was in power in the last 5 years
Original nonpk5 Relative number of months a woman without political kinship was in power in the last 5 years
Original lagseats5 Proportion of seats held by women in national parliaments 5 years before (%)
Table 3 – Outcomes of interest
Source Name Description
WVS leaders “Men make better political leaders than women do” WVS exec “Men make better business executives than women do”
Table 4: Ordered Probit estimates - “Men make better business executives than women”
(1) (2) (3) woment5 0,109 (0,086) exect5 0,194** (0,081) nonexect5 -6,509 (6,205) pk5 9,786 (6,915) nonpk5 0,111 (0,087) Observations 23225 23225 23225 𝑅! 0,0604 0,0674 0,0604
Note: Explanatory variables included are woment5 (relative number of months in power in the last 5 years for a female head of state or goverment), exect5 (relative number of months in power in the last 5 years for a female leader with executive power), nonexect5 (relative number of months in power in the last 5 years for a female leader without executive power), pk5 (relative number of months in power in the last 5 years for a female leader with political kinship) and nonpk5 (relative number of months in power in the last 5 years for a female leader without political kinship).
Dependent variable measures likelihood of agreement with statement “Men make better business executives than women”
Controls used are specified in table 2. Country and time fixed effects included in all regressions. Robust standard errors reported in parentheses.
Table 5: Ordered Probit estimates - “Men make better political leaders than women” (1) (2) (3) woment5 0,093 (0,082) exect5 -0,018 (0,084) nonexect5 -0,447*** (0,135) pk5 0,050 (0,218) nonpk5 0,108 (0,101) Observations 41556 41556 41556 𝑅! 0,0672 0,0674 0,0672
Note: Explanatory variables included are woment5 (relative number of months in power in the last 5 years for a female head of state or goverment), exect5 (relative number of months in power in the last 5 years for a female leader with executive power), nonexect5 (relative number of months in power in the last 5 years for a female leader without executive power), pk5 (relative number of months in power in the last 5 years for a female leader with political kinship) and nonpk5 (relative number of months in power in the last 5 years for a female leader without political kinship).
Dependent variable measures likelihood of agreement with statement “Men make better political leaders than women”
Controls used are specified in table 2. Country and time fixed effects included in all regressions. Robust standard errors reported in parentheses.
* significant at 10%; ** significant at 5%; significant at 1%.
Table 6: Ordered Probit estimates - “Men make better business executives than women”
male female
woment5 -0,050 0,282**
(0,122) (0,123)
Observations 11406 11819
𝑅! 0,0630 0,0590
Note: Explanatory variable included is woment5 (relative number of months in power in the last 5 years for a female head of state or goverment).
Dependent variable measures likelihood of agreement with statement “Men make better business executives than women”
Controls used are specified in table 2. Country and time fixed effects included in all regressions. Robust standard errors reported in parentheses.
Table 7: Ordered Probit estimates - “Men make better political leaders than women” male female woment5 0,000 0,214* (0,115) (0,117) Observations 20731 20825 𝑅! 0,0680 0,0674
Note: Explanatory variable included is woment5 (relative number of months in power in the last 5 years for a female head of state or goverment).
Dependent variable measures likelihood of agreement with statement “Men make better political leaders than women”
Controls used are specified in table 2. Country and time fixed effects included in all regressions. Robust standard errors reported in parentheses.
* significant at 10%; ** significant at 5%; significant at 1%.
Table 8: Marginal effects of Ordered Probit regressions
exec leaders exect5 0,024** (0,0099) nonexect5 -0,085*** (0,026) Observations 23225 41556 𝑅! 0,0674 0,0674 exec leaders woment5 0,034** 0,0403* (female respondents) (0,015) (0,0222) Observations 11819 20825 𝑅! 0,0590 0,0674
Note: Explanatory variables included are woment5 (relative number of months in power in the last 5 years for a female head of state or goverment), exect5 (relative number of months in power in the last 5 years for a female leader with executive power) and nonexect5 (relative number of months in power in the last 5 years for a female leader without executive power)
Dependent variables are exec which measures likelihood of agreement with statement “Men make better business executives than women” and leaders which measures likelihood of agreement with statement “Men make better political leaders than women”
Controls used are specified in table 2. Country and time fixed effects included in all regressions. Robust standard errors reported in parentheses.
Table 9: Instrumental Variables estimates - “Men make better business executives than women” (1) (2) (3) woment5 0,368* (0,205) exect5 0,179** (0,099) nonpk5 0,368* (0,205) Observations 77696 77696 77696 Centered 𝑅! 0,2182 0,2207 0,2182 Uncentered 𝑅! 0,7398 0,7407 0,7398 Effective F-statistic 178,4 675,6 178,4
Note: Explanatory variables included are woment5 (relative number of months in power in the last 5 years for a female head of state or goverment), exect5 (relative number of months in power in the last 5 years for a female leader with executive power) and nonpk5 (relative number of months in power in the last 5 years for a female leader without political kinship).
Dependent variable measures likelihood of agreement with statement “Men make better business executives than women”
Controls used are specified in table 2. Country and time fixed effects included in all regressions. Robust standard errors reported in parentheses.
Montiel-Pflueger robust weak instrument test provides the effective F-statistic presented in the table. * significant at 10%; ** significant at 5%; significant at 1%.
Table 10: Instrumental Variables estimates - “Men make better political leaders than women” (1) (2) (3) woment5 -0,069* (0,039) exect5 0,112* (0,064) nonpk5 -0,069* (0,039) Observations 92603 92603 92603 Centered 𝑅! 0,2640 0,2636 0,2640 Uncentered 𝑅! 0,7914 0,7913 0,7914 Effective F-statistic 5959,5 2090,9 5959,5
Note: Explanatory variables included are woment5 (relative number of months in power in the last 5 years for a female head of state or goverment), exect5 (relative number of months in power in the last 5 years for a female leader with executive power) and nonpk5 (relative number of months in power in the last 5 years for a female leader without political kinship).
Dependent variable measures likelihood of agreement with statement “Men make better political leaders than women”
Controls used are specified in table 2. Country and time fixed effects included in all regressions. Robust standard errors reported in parentheses.
Montiel-Pflueger robust weak instrument test provides the effective F-statistic presented in the table. * significant at 10%; ** significant at 5%; significant at 1%.
Table 11: Instrumental Variables estimates - “Men make better business executives than women” male female woment5 0,327 0,437 (0,200) (0,454) Observations 38046 39650 Centered 𝑅! 0,2208 0,2164 Uncentered 𝑅! 0,7415 0,7385 Effective F-statistic 141,3 44,5
Note: Explanatory variable included is woment5 (relative number of months in power in the last 5 years for a female head of state or goverment).
Dependent variable measures likelihood of agreement with statement “Men make better business executives than women”
Controls used are specified in table 2. Country and time fixed effects included in all regressions. Robust standard errors reported in parentheses.
Montiel-Pflueger robust weak instrument test provides the effective F-statistic presented in the table. * significant at 10%; ** significant at 5%; significant at 1%.
Table 12: Instumental Variables estimates – “Men make better political leaders than women” male female woment5 -0,056 -0,076 (0,059) (0,054) Observations 45226 20825 Centered 𝑅! 0,2692 0,2605 Uncentered 𝑅! 0,7929 0,7904 Effective F-statistic 2631 3212
Note: Explanatory variable included is woment5 (relative number of months in power in the last 5 years for a female head of state or goverment).
Dependent variable measures likelihood of agreement with statement “Men make better political leaders than women”
Controls used are specified in table 2. Country and time fixed effects included in all regressions. Robust standard errors reported in parentheses.
Montiel-Pflueger robust weak instrument test provides the effective F-statistic presented in the table. * significant at 10%; ** significant at 5%; significant at 1%.