Orientador de Dissertação
PROFª. DOUTORA REGINA BISPO
Coorientadores de Dissertação
DOUTORA DIANE CLARIDGE
PROF. DOUTOR RUSSELL ALPIZAR-JARA
Coordenador do Seminário de Dissertação
PROF. DOUTOR EMANUEL GONÇALVES
Tese submetida como requisito parcial para a obtenção do grau de:
MESTRE EM BIOLOGIA MARINHA E CONSERVAÇÃO
2017
USING MARK-RECAPTURE METHODS TO
ANALYSE A MELON-HEADED WHALES
(PEPONOCEPHALA ELECTRA) POPULATION IN
THE BAHAMAS
DIANA PATRÍCIA CORREIA VIEIRA
Nº 23438
ii
Dissertação de Mestrado realizada sob a orientação da Profª. Doutora Regina Bispo, apresentada no ISPA – Instituto Universitário para obtenção de grau de Mestre na especialidade de Biologia Marinha e Conservação
iii
Agradecimentos
Ao longo deste ano foram várias as pessoas cujo apoio e incentivo facilitaram a elaboração desta dissertação, e às quais deixo o meu agradecimento.
À Professora Doutora Regina Bispo, pelas palavras de incentivo, pela disponibilidade, paciência e atenção dispensadas durante a redação da tese. O meu mais sincero obrigada por toda a confiança que depositou em mim e no meu trabalho.
Um agradecimento especial ao Professor Doutor Russell Alpizar-Jara por todo o apoio e orientação prestados na realização deste trabalho. Agradeço também a disponibilidade para me coorientar e esclarecer todas as minhas dúvidas.
As próximas palavras são dirigidas à minha coorientadora Doutora Diane Claridge e à Doutora Charlotte Dunn. Por esse motivo, as próximas palavras de agradecimento serão em inglês. I wish to thank my co-advisor Dr Diane Claridge for your guidance during this last year. I am grateful for all your assistance and your words of encouragement. I thank to Dr Charlotte Dunn for welcoming me in your house and for all your support. It was a great month that I will never forget! I would also like to acknowledge BMMRO for providing the dataset for this study. Ao coordenador do Mestrado em Biologia Marinha e Conservação, Professor Doutor Emanuel Gonçalves, agradeço a motivação e os conselhos que nos deu ao longo do Seminário de Dissertação.
Às minhas colegas Anas e Sara por todas as horas passadas na pausa do sofá e por todas as gargalhadas que partilhamos juntas. Obrigada pelo companheirismo e entusiamo que tornaram estes dois anos mais alegres. Um agradecimento especial à Ana por todas as conversas e desabafos que partilhamos, e pela amizade que vou levar sempre comigo.
À Beatriz, pela amizade, apoio constante, e pela partilha de bons momentos no 3º esquerdo. Aos meus pais e à minha irmã pelo apoio incondicional e por acreditarem sempre em mim. As minhas palavras nunca serão suficientes para demonstrar a minha gratidão.
v
Resumo
A identificação de flutuações demográficas é um dos aspetos centrais em estudos de dinâmica populacional. A evolução do tamanho da população e a obtenção de estimativas da probabilidade de sobrevivência e recrutamento são informações cruciais no delineamento de estratégias de conservação.
Neste trabalho foram aplicadas duas abordagens de modelos de captura-recaptura a dados de foto-identificação, recolhidos entre 2009 e 2015, do odontocete Peponocephala electra, numa área de testes militares (AUTEC), nas Bahamas. Foram implementados modelos para populações fechadas e abertas para estimar a abundância, sobrevivência, recrutamento e probabilidade de captura. Os modelos foram implementados com recurso à metodologia
Markov Chain Monte Carlo (MCMC), numa perspetiva Bayesiana.
Foram avistados e fotografados 410 indivíduos distintos. e O número de vezes que o mesmo indivíduo foi avistado ao longo dos 6 anos de estudo variou entre 1 a 6. Os resultados sugerem um declínio no tamanho da população, associado a uma baixa taxa de recrutamento ao longo do tempo. Com o modelo para populações abertas estimou-se que um total de 558 (95% CRI = 547.00 – 561.00) indivíduos utilizaram a área de estudo pelo menos uma vez entre 2009 e 2015. Os resultados apontam para uma população aberta, sazonal, sugerindo uma distribuição que se estende para além da área de estudo. Porém, os dados suportam o uso regular da área durante o período primavera/verão.
Este estudo estabelece as primeiras estimativas de abundância, sobrevivência e recrutamento para esta espécie, nas Bahamas, e destaca a importância de estudos de longa duração na estimação de parâmetros demográficos.
Palavras-chave: Captura-recaptura, estatística Bayesiana, abundância, foto-identificação,
vi
Abstract
Identifying demographic changes is fundamental for understanding population dynamics. Population trends, reliable estimates of population sizes and survival and recruitment are among the most important demographic parameters used to support effective management and conservation strategies.
In this context, two mark-recapture approaches were implemented to photo-identification data of melon-headed whales (Peponocephala electra), gathered in a US Navy testing range (AUTEC), located in the Bahamas between 2009 and 2015. Close and open population models were fitted to estimate the abundance, survival, recruitment and capture probabilities. Models were fitted using Markov Chain Monte Carlo (MCMC) sampling, in a Bayesian framework.
A total of 410 distinctive individuals were sighted and photographed, with resightings ranging from one to six times. The results suggest a decline in the population size, which may be related to the low recruitment rates over time. Estimates under the open population model suggest that 558 (95% CRI = 547.00 – 561.00) individuals used the area at least once, during the course of the study. The obtained results support the idea of a seasonal open population with an occupation range that extends beyond AUTEC. Nonetheless, resighting data demonstrates a regular use of the area in the spring/summer period.
This study establishes baseline estimates of abundance, survival, and recruitment rates for melon-headed whales inhabiting AUTEC and highlights the importance of long-term surveys to assess demographic parameters. Knowledge on melon-headed whales is sparse and future studies are key features to develop our understanding of this species.
Key words: capture-recapture, Bayesian statistics, abundance, photo-identification,
vii
Table of contents
List of tables ... viii
List of figures ... viii
Preface ... 11
1 Introduction ... 13
2 Methods ... 15
2.1 Survey design and data collection ... 15
2.2 Photo-identification ... 16
2.3 Statistical analysis ... 16
2.3.1 Data preparation ... 16
2.3.2 Classical statistical inference ... 17
2.3.3 Bayesian statistical inference ... 20
2.3.4 Model selection ... 22
3 Results ... 23
3.1 Photo-identification data ... 23
3.2 Mark-recapture estimation – closed-population models ... 24
3.3 Mark-recapture estimation - open-population models ... 31
4 Discussion ... 33
4.1 Mark-recapture estimates ... 33
4.2 Model assumptions and bias ... 35
5 General conclusions ... 39
6 Literature cited ... 41
Appendix A ... 47
A1 Melon-headed whale (Peponocephala electra) ... 50
A1.1 Species characteristics and taxonomy ... 50
A1.2 Distribution and abundance ... 51
viii
A1.4 Life history ... 53
A1.5 Threats and status ... 54
A2 Abundance estimation ... 54
A2.1 Mark-recapture ... 56
A3 Bayesian methods ... 60
A3.1 Choosing the prior distribution ... 62
A4 Software ... 64
A5 Literature cited ... 65
Appendix B ... 73
List of tables
Table 1 - Encounter histories of individual animals along the sampling period. ... 17Table 2. Number of individual melon-headed whales identified in each sampling occasion (j), within the AUTEC study area. ... 23
Table 3. Deviance information criteria (DIC) and differences between model’s DIC (∆DIC). ... 30
List of figures
Figure 1 – The AUTEC range location within the Bahamas region, with main islands and regions. Image kindly provided by Marques, T. A.. ... 15Figure 2 - Photographs of the same individual melon-headed whale (Pe608), with different image quality (Q). From the left to the right image quality is graded from very poor quality (Q=0), to excellent quality (Q=3). Photos ©Bahamas Marine Mammal Research Organisation, Charlotte Dunn, John Durban. ... 16
Figure 3 - Discovery curve showing the cumulative number of distinctly marked individuals identified over the study period (a); and number of years in which distinctly marked individual melon-headed whales were sighted (b). ... 23
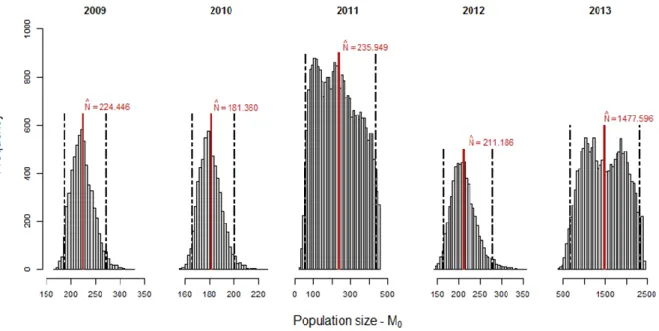
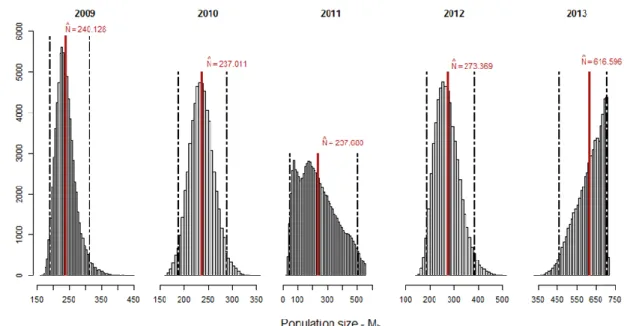
Figure 4 - Population size’s posterior distributions and respective estimated means (red vertical lines) under model M0, within each year. Black dotted lines represent the 95% interval of credibility, lower and upper boundaries at 2.5% and 97.5%, respectively. .... 24
ix
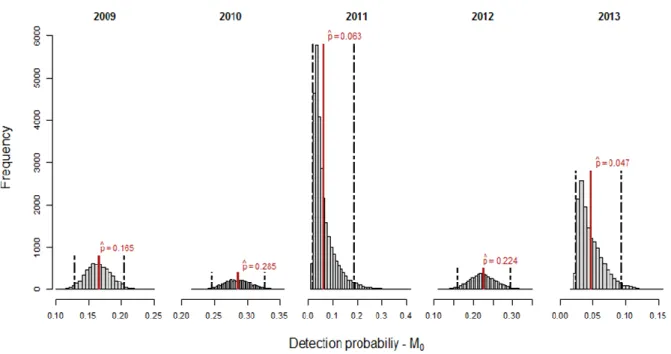
Figure 5 - Detection probability’s posterior distributions and respective estimated means (red vertical lines) under model M0, within each year. Black dotted lines represent the 95% interval of credibility, lower and upper boundaries at 2.5% and 97.5%, respectively. ... 25 Figure 6 - Population size’s posterior distributions and respective estimated means (red
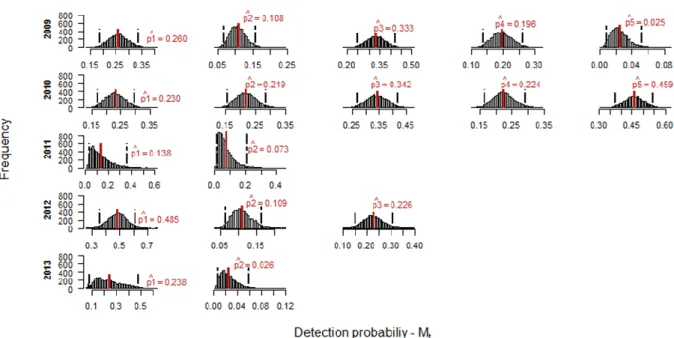
vertical lines) under model Mt, within each year. Black dotted lines represent the 95% interval of credibility, lower and upper boundaries at 2.5% and 97.5%, respectively. ... 25 Figure 7 - Detection probability’s posterior distributions and respective estimated means (red
vertical lines) under model Mt, within each sampling occasion of each year. Black dotted lines represent the 95% interval of credibility, lower and upper boundaries at 2.5% and 97.5%, respectively. ... 26 Figure 8 - Population size’s posterior distributions and respective estimated means (red
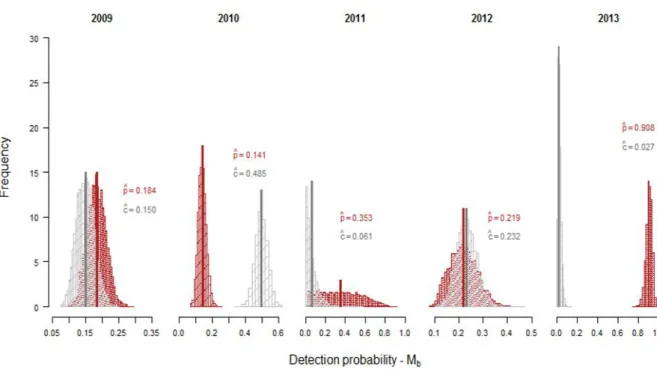
vertical lines) under model Mb, within each year. Black dotted lines represent the 95% interval of credibility, lower and upper boundaries at 2.5% and 97.5%, respectively. ... 27 Figure 9 - Detection probability’s posterior distributions and respective estimated means (red
and grey vertical lines) under model Mb, within each year. Red colour represents the posterior estimates for p, and the grey colour corresponds to the posterior estimates for c. ... 28 Figure 10 - Population size’s posterior distributions and respective estimated means (red
vertical lines) under model Mh, within each year. Black dotted lines represent the 95% interval of credibility, lower and upper boundaries at 2.5% and 97.5%, respectively. ... 29 Figure 11 - Individual detection probability’s posterior distributions and respective estimated
means (red vertical lines) under model Mh within each year. Black dotted lines represent the 95% interval of credibility, lower and upper boundaries at 2.5% and 97.5%,
respectively... 29 Figure 12 - Mean population size’s posterior estimates for each year, under every model
applied. ... 30 Figure 13 - Posterior distribution and respective estimated mean (red vertical line) of apparent
survival, Φ, under the Cormack-Jolly-Seber model. Black dotted lines represent the 95% interval of credibility, lower and upper boundaries at 2.5% and 97.5%, respectively. ... 31 Figure 14 - Posterior distribution and respective estimated mean (red vertical line) of
recapture probability, p, under the Cormack-Jolly-Seber model. Black dotted lines
represent the 95% interval of credibility, lower and upper boundaries at 2.5% and 97.5%, respectively... 31 Figure 15 - Posterior mean of population size of melon-headed whales in the AUTEC study
area. Vertical lines represented in each point represent 95% CRI. ... 32 Figure 16 - Posterior mean of per-capita recruitment of melon-headed whales in the AUTEC
11
Preface
The aim of this study was to provide an estimate of the abundance of Peponocephala electra
– melon-headed whale – in the Bahamas, and to assess other demographic parameters such as
survival and recruitment. Specifically, the number of individuals inhabiting the US Navy’s Atlantic Underwater Test and Evaluation Center (AUTEC) in the Tongue of the Ocean. For this purpose, a Bayesian framework was used to fit several mark-recapture models to data gathered between 2009 and 2015, by the Bahamas Marine Mammals Research Organisation (BMMRO). Section 1 presents an introduction describing the species of interest, Peponocephala electra, emphasizing the importance of photographic mark-recapture methods as a way of estimating demographic parameters, specifically cetacean population sizes. Section 2 describes the field and statistical methods. Section 3 and 4 present the results and the discussion, respectively. Section 5 presents the main conclusions, focusing on the importance of this work. In the Appendices chapter, Appendix A provides a literature review on the topics of abundance estimation, Bayesian inference and melon-headed whales’ characteristics, and Appendix B contains a numerical summary of estimated parameters for all tested models.
13
1 Introduction
Marine ecosystems are under pressure due to the development of human population and the anthropogenic activities that arise from this growth. Cetaceans, a key part of marine ecosystems, are thus potentially faced with threats that might lead to extinction (Marques, Thomas, Ward, DiMarzio, & Tyack, 2009). Therefore, our understanding of population dynamics is essential to understand the potential impacts that anthropogenic activities might pose, and to allow an effective delineation of management and conservation measures (Berta, Sumich, & Kovacs, 2015). Population trends, reliable estimates of population sizes, and demographic parameters such as survival and recruitment are among the most important information to support effective management and conservation strategies (Coimbra, Assis, da Silva, & dos Santos, 2016).
However, regardless the importance of knowing the abundance in marine mammal populations, limited estimates exist for population sizes, and suitable data to determine trends are even fewer (Berta et al., 2015). The main reasons that make marine mammal populations hard to survey are mostly due to the high mobility, broad distribution, lack of physical boundaries of many species, and the fact that most of them spend a substantial part of their time underwater (Berta et al., 2015; Boyd, Bowen, & Iverson, 2010). Hence, besides posing several sampling constraints, the characteristics mentioned above disenable most of the attempts of enumerating all individuals in a population (Boyd et al., 2010; Perrin, Würsig, & Thewissen, 2008). Consequentially, the most common methods to estimate the abundance of a marine mammal population involve the observation of a sample of the population and, with the aid of statistical models, making inferences about the population size (Boyd et al., 2010).
Photographic mark-recapture methods have been successfully used to quantify the population size and demographics of multiple cetacean species (Claridge, 1994; Manning & Goldberg, 2010; Mcdonald & Amstrup, 2001; Perrin et al., 2008; Urian et al., 2015). This non-invasive technique relies on observing natural markings such as nicks and notches on the trailing edge of the dorsal fin that are unique to each animal and provide a way to identify distinct individuals in subsequent occasions (Würsig & Würsig, 1977). Nevertheless, due to the wide-ranging movements, and the fact that most studies do not cover the whole population’s distribution, inferences about demographic fluctuations are constrained (Fearnbach, Durban, Parsons, & Claridge, 2012).
Melon-headed whale (Peponocephala electra), is a poorly known species of oceanic odontocete present in tropical and subtropical waters worldwide (Jefferson, Webber, & Pitman, 2008; Perryman, 2008), typically found in oceanic deep waters but can be associated nearshore
14
with oceanic islands (Brownell Jr., Ralls, Baumann-Pickering, & Poole, 2009). They range from the Gulf of Mexico, to the Eastern Pacific, with documented occurrences in Japan and coast of Europe (Miyazaki, Fujise, & Iwata, 1998; Rice, 1998). Despite their wide distribution, few abundance estimates are available for this species.
P. electra has been reported in the Bahamas (MacLeod, Hauser, & Peckham, 2004), and is
known to occur within the Atlantic Undersea Test and Evaluation Center (henceforth referred to as AUTEC) operating area. AUTEC is an US Navy testing range located in the Bahamas, that consists in an array of hydrophones mounted in the seafloor, and where tactical sonar is regularly used during navy training operations. Resightings of photo-identified individuals along several years in this location, offer the opportunity to assess the population status and try to identify possible impacts from the repeated use of sonars.
In this context, two different mark-recapture approaches were implemented to estimate the abundance of melon-headed whales in AUTEC’s ranging area. Specifically, both closed and opened population models were fitted to data gathered between 2009 and 2015, to estimate the abundance of melon-headed whales. Parameters including survival, recruitment and capture probabilities were also estimated. Models were fitted using Markov chain Monte Carlo (MCMC) sampling, in a Bayesian framework.
The main goals of this study were thus to: (1) assess the abundance of this species within each year; (2) understand the population’s trend over the study duration; (4) assess other demographic parameters such as survival and recruitment; and (4) provide a baseline for the future monitoring of this population.
The subsequent sections of this thesis are divided into the detailed field and applied statistical methods (Section 2), the statistical findings of the research (Section 3), the discussion (Section 4), and the main conclusions, emphasizing the relevance of this work (Section 5).
15
2 Methods
2.1 Survey design and data collection
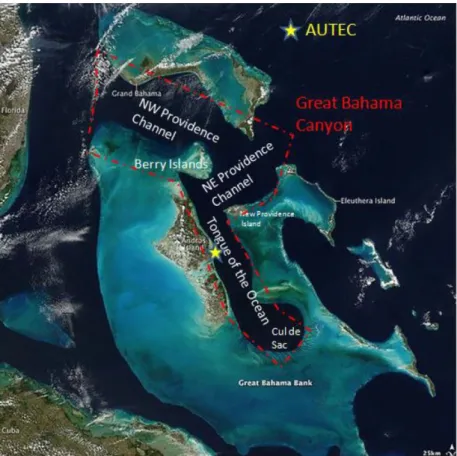
Surveys were undertaken between 2009 and 2015 at the US Navy’s Atlantic Undersea Testing and Evaluation Center (AUTEC). AUTEC is located in the Tongue of the Ocean (TOTO), a deep-ocean basin located near Andros Island in the Bahamas, consisting of an array of hydrophones covering 1500km2 designed to track vessels and monitor military exercises (Fig. 1). The hydrophones have also been used to monitor the sounds of marine mammals (Tyack et al., 2011).
Data was collected in vessels that ranged from 5m rigid-inflatable boats,to larger ships up to 83m. High power binoculars and deck-mounted binoculars were used in the search of the animals. Whenever animals were encountered, the vessel was manoeuvred alongside the group and identification photographs were taken of as many individuals as possible, with Nikon digital SLR cameras. Besides the photographs, group size, behaviour, direction of travel, estimates of age/sex structure and GPS locations were also registered.
Figure 1 – The AUTEC range location within the Bahamas region, with main islands and regions. Image kindly provided by Marques, T. A..
16
2.2 Photo-identification
Photographs were cropped and matched by eye in ACDSee Pro v. 8.0, without additional matching software. Individual melon-headed whales were identified through the use of nicks on the trailing edge of the dorsal fin, and individual identifications were assessed by comparing photographs with a photo-identification catalogue containing all the distinct individuals recognised over the years. When a match was found, the photograph was linked to the individual. If no match was found, a new designation was assigned and it was added to the catalogue.
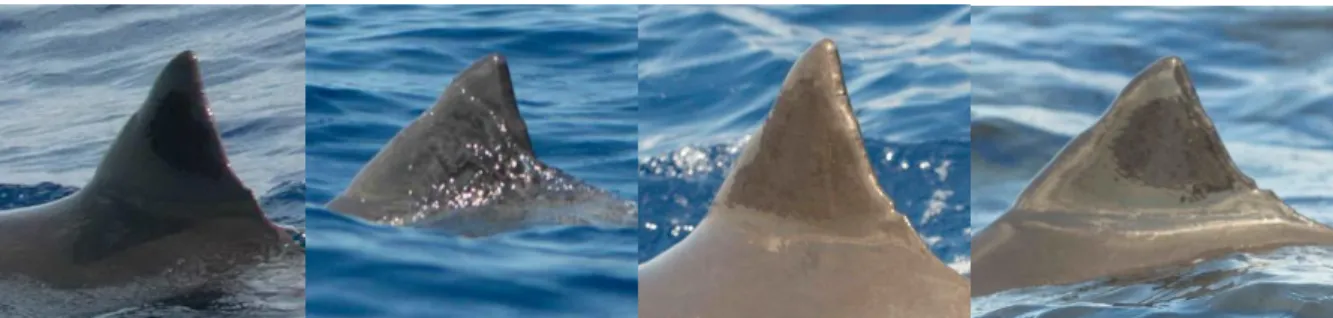
Photo-quality was assigned based on the unobstructed view of the fin, lighting, focus of the frame and angle and size of the fin relative to the frame. The quality grade ranged from 0 to 3, where 3 was the highest quality (Fig. 2). A distinctiveness rating was also applied based on mark severity: very distinctive individuals had multiple notches along the dorsal fin’s trailing edge; slightly distinctive dorsal fins were characterized by fewer notches along the trailing edge; and non-distinctive animals were the ones without any marks on the dorsal fin. To ensure the accuracy of the matching, only photos with quality 2 or 3, of distinctive and very distinctive animals, were included in the analysis.
2.3 Statistical analysis
2.3.1 Data preparation
Photographic identifications and reidentifications were treated as “captures” and “recaptures” and a matrix Y was constructed (Table 1), pooling all identifications into binary identification histories in each period, with elements yij (i =1,…, n; j=1,…,19)) taking the values 1 or 0 to indicate whether or not the individual i was sighted during sampling occasion j. This Figure 2 - Photographs of the same individual melon-headed whale (Pe608), with different image quality (Q). From the left to the right image quality is graded from very poor quality (Q=0), to excellent quality (Q=3). Photos ©Bahamas Marine Mammal Research Organisation, Charlotte Dunn, John Durban.
17
matrix Y resulted in a string of 1s and 0s to each individual animal, which was referred to as its encounter history. For example, an encounter history of an animal i of (1110001) translates to seven encounter occasions; after being seen three times, the individual was not seen in the three following occasions, and was seen on the last occasion.
Encounter histories were then used to estimate population parameters in the program R (R Core Team, 2016), using the package R2OpenBUGS (Sturtz, Ligges, Gelman, & Thomas, 2015), and the program OpenBUGS (Lunn, Spiegelhalter, Thomas, & Best, 2009).
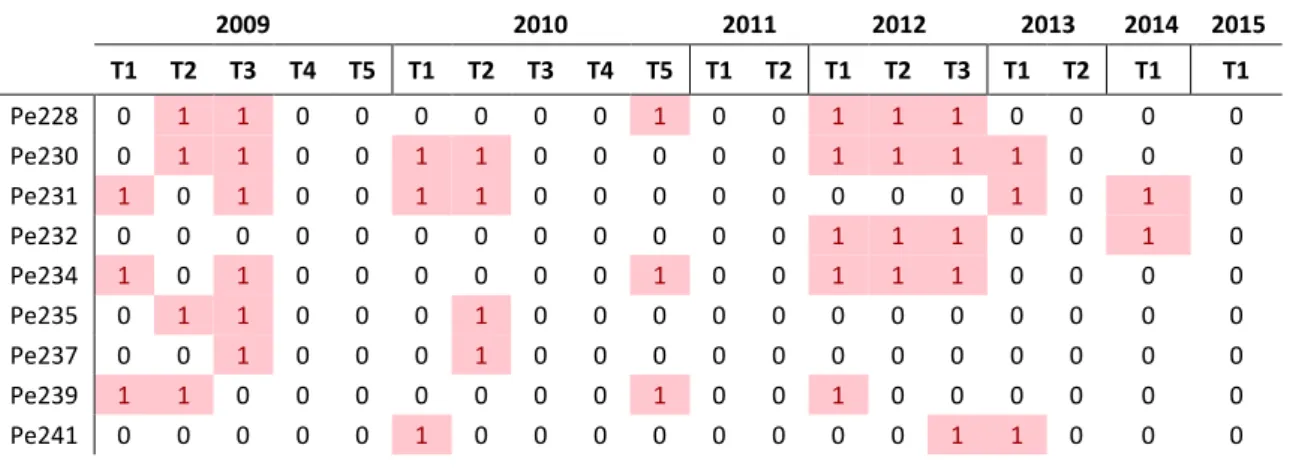
Table 1 - Encounter histories of individual animals along the sampling period.
2009 2010 2011 2012 2013 2014 2015 T1 T2 T3 T4 T5 T1 T2 T3 T4 T5 T1 T2 T1 T2 T3 T1 T2 T1 T1 Pe228 0 1 1 0 0 0 0 0 0 1 0 0 1 1 1 0 0 0 0 Pe230 0 1 1 0 0 1 1 0 0 0 0 0 1 1 1 1 0 0 0 Pe231 1 0 1 0 0 1 1 0 0 0 0 0 0 0 0 1 0 1 0 Pe232 0 0 0 0 0 0 0 0 0 0 0 0 1 1 1 0 0 1 0 Pe234 1 0 1 0 0 0 0 0 0 1 0 0 1 1 1 0 0 0 0 Pe235 0 1 1 0 0 0 1 0 0 0 0 0 0 0 0 0 0 0 0 Pe237 0 0 1 0 0 0 1 0 0 0 0 0 0 0 0 0 0 0 0 Pe239 1 1 0 0 0 0 0 0 0 1 0 0 1 0 0 0 0 0 0 Pe241 0 0 0 0 0 1 0 0 0 0 0 0 0 0 1 1 0 0 0
2.3.2 Classical statistical inference
Different approaches can be used when studying population dynamics. Modelling mark-recapture data is among the most common techniques applied to estimate abundance (Marques et al., 2013). Mark-recapture models can be separated into two main groups: closed population models and open population models. The first presume that no births, deaths, immigration, or emigration occur during the study period, hence the total number of individuals remains constant; the latter acknowledges that the total number of individuals can change during the course of an experiment, due to any combination of the above-mentioned events (Amstrup, Mcdonald, & Manly, 2005).
Several models were fitted to the data. First, closed population models were fitted to each year individually, assuming the closeness of the population within sampling periods, to assess the detection probability, p, and the population size, N. Secondly, given the multi-year time frame of the study, two open population models were fitted: the Cormack-Jolly-Seber model and the Jolly-Seber model.
18
Closed-population models
Capture-recapture methods consist of modelling the detection probability, p, in order to obtain an estimator of the population size, N. Otis, Burnham, White, & Anderson (1978) defined a set of closed-population models which accommodate possible patterns in detection probability, distinguishing between three different sources of heterogeneity: time effects (t), behaviour effects (b), and individual effects (h). These models, referred as “Mm”, where m={0,
t, b, h} indicates the source of heterogeneity, are as follows: M0, which assumes that there is no heterogeneity in p, Mt, Mb, and Mh; and four models with two-way and three-way combinations of heterogeneity sources: Mth, Mbh, Mtb, and Mtbh.
The four basic models, were applied to separate annual data sets from 2009 to 2013. As mark-recapture techniques are based on the number of animals marked in a first sample, and the percentage of marked individuals on the following occasion, to produce a single year abundance estimate, two or more sampling occasions are required. For this reason, the last two years of the data set, which have only one sampling occasion each, were not included in the closed population analysis.
Model M0 assumes that the population is homogeneous, meaning that all individuals have the same detection probability over time, and it is the simplest model used to estimate the size of a population (N), and the detection probability (p). This model is built under the assumption that p is not affected neither by time, behaviour, or individual heterogeneity, during the course of an experiment. However, this assumption is hardly achieved and abundance estimates under model M0 may exhibit significant bias. In fact, when detection probabilities vary by individual, abundance estimates show significant negative bias, and when the source of heterogeneity is behavioural, estimates may be overestimated or underestimated whether animals are trap-shy or trap-happy, respectively (Otis et al., 1978). Consequently, model M0 works as a “null” model that can be used when testing for sources of variation.
In model Mt, the detection probability varies from one sampling occasion to another, which might occur due to weather conditions or a change in the sampling method (different observers or traps). This model assumes that all animals are equally catchable on any occasion, being the only source of heterogeneity, the time effects. This model is composed of the detection probability within each sampling occasion (pj), and population size (N). Model Mb accounts for the animals’ behavioural response after their initial capture. Individuals might become “trap-happy” when being caught is a rewarding experience (e.g. baited traps), or “trap-shy” when being caught is a traumatic experience (e.g. applying physical marks). The only effect
19
interfering with detection probability is the response to capture. In this model the capture probability is denoted as c or p depending on whether the animal has or has not been captured in a previous occasion, respectively. Model Mh allows individual heterogeneity, meaning that it is assumed that each individual has a different detection probability. The parameters are the population size (N), and the individual detection probability (pi) (Borchers, Buckland, & Zucchini, 2002; Kéry & Schaub, 2012; Otis et al., 1978).
Other model assumptions
The models described above rely on a number of assumptions which when not true may bias parameters estimates. The population is closed to emigration/immigration and no birth/deaths should occur; there are no misclassifications, that is, the recognition system should be reliable; the marks are not lost during the study, all individuals have equal probability of being captured/detected in each sampling occasion, which also implies that the capture of an animal should not affect its catchability (Otis et al., 1978). The last assumption is often relaxed, since it is not met in most capture-recapture studies. Unequal detection probabilities were explicitly embodied in the referred models.
Open-population models
Cormack-Jolly-Seber (CJS) methods focus on modelling survival probabilities. With this open-population model, recapture probability (p, probability of resighting a marked animal) and apparent survival probability (ϕ, the probability of an individual that was alive in the population in one sampling occasion, being alive in the subsequent sampling occasion), were estimated. CJS conditions on first capture and allows inference about the survival rates but not about the population gains and losses. This model was fitted using a state-space formulation (Gimenez et al., 2007; Royle, 2008), in which the states (alive or dead) of an individual, and the recapture probabilities over time are modelled as Bernoulli trials. Assuming an individual i sighted/marked at time t, it can either survive until t+1 with probability ϕi,t, or it can die, with probability 1- ϕi,t. Given that the individual is alive at t+1, it may again survive until t+2, with
probability ϕi,t+1, and so forward until the individual dies or the study ends. Conditional on this
state (dead or alive) process, there is the observation process: a sighted/marked individual i, alive at occasion t might be recaptured with probability pi,t, or not (with probability 1- pi,t). In this study, the CJS model was implemented as a constant model, with apparent survival (ϕ),
20
and recapture probabilities (p), being identical for all individuals at all occasions, from 2009 to 2015.
The Jolly-Seber (JS) model, on the other hand, considers all the information contained in capture-recapture histories, not just the part following the first capture, as for the CJS model. The JS model does not condition on first capture, which allows, apart from population size estimates, the estimation of recruitment, that is, the number of individuals entering the population, either through birth or immigration. In this study, a JS model was fitted as a space-state model, where the observed mark-recapture data are defined as the result of a space-state process and the observation process. As in the CJS model, the state of the individuals, and the detection probability, are determined by Bernoulli trials in which the individuals either are dead, or have not entered the population yet, or alive, and are detected or not. The model fitted to data between 2009 and 2015, included temporal random effects in survival, fixed time effects in recruitment and a constant detection rate, and was denoted as (ϕt, bt, p).
Other model assumptions
As for the closed population models, the CJS and the JS models have a list of assumptions on which they rely: there are no misclassifications, that is, the recognition system should be reliable; the marks are not lost during the study, all encounters are instantaneous to assure equal survival probabilities, and animals captured and recaptured should be a random sample of the study population. In addition, the JS model requires that all individuals alive in the population have equal probability of being captured in each sampling occasion, which also implies that the capture of an animal should not affect its catchability.
2.3.3 Bayesian statistical inference
In a Bayesian perspective, each model parameter is considered as a random variable that is characterized by a prior distribution. This prior distribution is given according to the previous knowledge that one has about the parameters, and this knowledge is expressed as a probability distribution (Kéry & Schaub, 2012). In this study, as there was no previous information that could be used to incorporate in the models, noninformative prior distributions, Uniform (0,1), were used for all probability parameters. This distribution means that the probability of a parameter can be any value between 0 and 1. Model Mh, however, had individual heterogeneity modelled with the logistic-normal model. In this model a variable z, transformed by the logistic function (Equation 1), follows a normal distribution.
21
𝑓(𝑧) = 1
1+𝑒−𝑧 Equation 1
The logistic-normal model allows flexible modelling of individual effects along with others, such as behaviour or time effects. In this study, individual heterogeneity was modelled as random noise around some mean on a logit-transformed scale and the noise was the normal distribution. The logit function is the inverse of the logistic function and, when the function’s parameters represent a probability p, the logit function gives the natural logarithm of the odds (Equation 2) (Kéry & Schaub, 2012).
𝑙𝑛( 𝑝
1−𝑝) Equation 2
After the assignment of the priors, OpenBUGS software was used to implement Markov Chain Monte Carlo (MCMC) sampling. MCMC is a simulation technique used to make repeated draws from the conditional distributions and estimate the posterior distribution for each parameter. After the specification of a model, OpenBUGS creates a MCMC algorithm that may run a chosen number of cycles in order to reach convergence and generate a posterior distribution of the parameter. These cycles are called iterations and, to ensure that the achieved values will be close to the center of the posterior distribution, the first iterations are discarded (burn-in period) (Kéry & Schaub, 2012; Ntzoufras, 2009). In this study, inference was based on a minimum of 2500 and maximum of 30000 MCMC iterations after discarding a “burn-in” of 500 to 5000 iterations prior to convergence of three different chains.
Because the total number of individuals in the population was not known, the list of individuals observed was augmented with a large number (minimum of 150 and maximum of 300) of all zero identification histories to represent the pool of “potential” unobserved individuals. Given the augmented dataset of size M, a binary indicator variable z, was added to the model. This variable z, is an indicator for whether a row from the augmented dataset represents an element of the population, or one that does not exist. It is modelled by Bernoulli trials with the parameter Ω, which is called the inclusion probability. This inclusion probability is the probability of an individual from the dataset M, be included in the population of size N. With this technique, N will be modelled under the prior assumption that its size can be any integer value between 0 and the size of the augmented dataset, M. Therefore, the expectation of
N will be equal to MΩ (Kéry & Schaub, 2012; Royle & Dorazio, 2012). The data augmentation
22
2.3.4 Model selection
The Deviance Information Criteria (DIC), is one method of selecting Bayesian models. This criterion uses the posterior mean of the deviance 𝐷(𝜃)̅̅̅̅̅̅̅, plus the effective number of parameters 𝑝𝐷, in the model as a sensible measure of fit (Spiegelhalter, Best, Carlin, & van der Linde, 2002) (Equation 3):
𝐷𝐼𝐶 = 𝐷(𝜃)̅̅̅̅̅̅̅ + 𝑝𝐷 Equation 3
DIC values were used to compare the models’ relative goodness-of-fit. In particular, DIC differences (defined, for each model, as ∆DIC = DIC - DICmin, where DICmin is the lowest DIC value for the fitted models) were automatically computed by OpenBUGS for the fitted models. As the best model is chosen according to the lowest DIC values, DIC differences express the loss of information when the fitted model is used instead of the best adjusted model. Hence, the best model was the one with a ∆DIC of zero.
23
3 Results
3.1 Photo-identification data
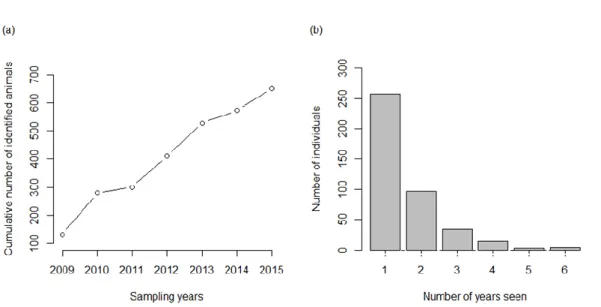
Photo-identification data were collected from 19 encounters with P. electra within the AUTEC area. The 2009-2015 data set contained a total of 845 sighting records of 410 distinctive individuals. The number of melon-headed whales identified in each sampling occasion ranged from a minimum of 4 individuals in the last sampling of 2009, to a maximum of 110 identified animals in the first sampling occasion of 2011 (Table 2). Maximum period between resightings was 6 years. Frequency of sightings ranged from one to six times (sightings within the same year excluded), and 203 of the 410 individuals were encountered more than once (Fig. 3b).
The number of newly identified individuals increased throughout the study period (Fig. 3a). The discovery curve suggests that the population was not demographically closed during the studied years, given the increasing trend of newly identified individuals.
Table 2. Number of individual melon-headed whales identified in each sampling occasion (j), within the AUTEC study area. 2009 2010 2011 2012 2013 2014 2015 T1 T2 T3 T4 T5 T1 T2 T3 T4 T5 T1 T2 T1 T2 T3 T1 T2 T1 T1 Nº of identified individuals 52 21 67 39 4 40 38 60 39 81 14 7 83 18 38 110 11 44 79
Figure 3 - Discovery curve showing the cumulative number of distinctly marked individuals identified over the study period (a); and number of years in which distinctly marked individual melon-headed whales were sighted (b).
24
3.2 Mark-recapture estimation – closed-population models
Figures 4 to 11 show the posterior distributions of abundance N (odd figures), and detection probabilities’ p (even figures), under each of the four fitted models. The ninety-five percent interval of credibility (95% CRI) for those distributions as well as the mean estimated for N and
p, are both shown. The 95% interval of credibility is an interval which contains the parameter
of interest with probability 0.95. That is, there is a 95% probability that the parameter lies within the specified interval (Kéry & Schaub, 2012).
Abundance (N) and detection probabilities’ (p) posterior distributions and estimated mean values under model M0 are shown in Figs. 4 and 5. Abundance mean estimates ranged from 181 (95% CRI = 166.00 - 201.00) individuals in 2010 to 1478 (95% CRI = 655.97 - 2324.00) animals in 2013. Overall, the posterior distributions of abundance seem well estimated apart from the years 2011 and 2013 that exhibited a wide and almost flat distribution (Appendix B, Table B1), which is an indicator of a considerable estimation uncertainty probably related with the small number of sampling occasions and sightings in both years (T = 2).
Estimated mean detection probabilities under model M0 oscillated between 0.05 (95% CRI = 0.02 - 0.09) for 2013, and 0.29 (95% CRI = 0.25 - 0.33) for 2010. The skewed posterior distribution in 2011 and 2013 may, again, result from the lack of available information regarding these years (Fig. 5 and Appendix B, Table B1).
Figure 4 - Population size’s posterior distributions and respective estimated means (red vertical lines) under model M0,
within each year. Black dotted lines represent the 95% interval of credibility, lower and upper boundaries at 2.5% and 97.5%, respectively.
25
Abundance estimates from Mt model (Fig. 6), followed the same general trend as under M0 model, with mean values varying from 151 (95% CRI = 41.00 - 373.00) animals for 2011, and 582 (95% CRI = 235.00 - 1497.00) dolphins for 2013. The 95% intervals of credibility for model Mt comprised the estimated mean abundances of each year under model M0 (Appendix B, Table B2).
Figure 5 - Detection probability’s posterior distributions and respective estimated means (red vertical lines) under model M0, within each year. Black dotted lines represent the 95% interval of credibility, lower and upper boundaries at 2.5% and
97.5%, respectively.
Figure 6 - Population size’s posterior distributions and respective estimated means (red vertical lines) under model Mt,
within each year. Black dotted lines represent the 95% interval of credibility, lower and upper boundaries at 2.5% and 97.5%, respectively.
26
Figure 7 shows the posterior distributions of detection probability, p, within each sampling occasion for each year, under model Mt. Mean values of p ranged widely, with the highest value being 0.48 (95% CRI = 0.36 - 0.61) for the first sampling occasion of 2011, and the lowest 0.02 (95% CRI = 0.01 - 0.05) for the fifth sampling occasion of 2009. Sampling occasion 1, for both 2011 and 2013, presented the wider posterior distribution for this parameter (Appendix B, Table B2). The posterior distributions in 2011 and 2013 are positively skewed which forces the estimated means to be on the left tail of the distribution (Fig. 7).
Behavioural responses were modelled under model Mb and the posterior distribution for abundance estimates are represented in Figure 8. Abundance estimates ranged from a mean value of 63 (95% CRI = 22.00 - 306.00) individuals in 2011 to 284 (95% CRI = 218.97 - 382.00) animals in 2010. Once again, both 2011 and 2013 show a skewed distribution revealing some uncertainty about the central tendency.
Figure 7 - Detection probability’s posterior distributions and respective estimated means (red vertical lines) under model Mt, within each sampling occasion of each year. Black dotted lines represent the 95% interval of credibility, lower and upper
27
Figure 9 shows the posterior distributions of the detection probability which was denoted as
c or p depending on whether an animal had or not had been detected during the previous
sampling occasion. Trap response was not the same for all years. For 2009, 2011 and 2013, posterior mean p values were higher, suggesting a negative trap-response, i.e., that detection may have negatively affected animals. The remaining years (2010 and 2012), show a positive trap response, posterior mean c values were higher than p values, which might indicate a trap-happiness situation, in which previous detections positively influence the latter probability of detection (Appendix B, Table B3).
Figure 8 - Population size’s posterior distributions and respective estimated means (red vertical lines) under model Mb,
within each year. Black dotted lines represent the 95% interval of credibility, lower and upper boundaries at 2.5% and 97.5%, respectively.
28
Posterior distributions for N and p under model Mh are shown in Figures 10 and 11,
respectively. This model was the best fitted one, in two of the five studied years (2009 and 2010), and the second-best fit in 2012 (Table 3). Mean abundance ranged from 240 (95% CRI = 192.00 - 315.00) individuals for 2009, to 617 (95% CRI = 460.00 - 708.00) animals for 2013 (Appendix B, Table B4). Years 2011 and 2013, as seen so far, presented a posterior distribution that comes with uncertainty regarding the obtained estimates.
Individual detection probability estimates under Mh model were generally low, varying from 0.06 (95% CRI = 0.02 - 0.20) in 2011 to 0.19 (95% CRI = 0.13 - 0.27) in 2010 (Appendix B, Table B4). The precision of the estimates was lower in 2011 than in 2013.
Figure 9 - Detection probability’s posterior distributions and respective estimated means (red and grey vertical lines) under model Mb, within each year. Red colour represents the posterior estimates for p, and the grey colour corresponds to the
29
Figure 12 shows the mean abundance estimates for each year, under every applied model. Overall, mean abundance throughout the years remained fairly constant across the fitted models, except for 2011 and 2013. Abundance estimates for 2011 showed some variability, having reached a minimum mean of 63 (95% CRI = 22.00 - 306.00) animals.
Figure 11 - Population size’s posterior distributions and respective estimated means (red vertical lines) under model Mh,
within each year. Black dotted lines represent the 95% interval of credibility, lower and upper boundaries at 2.5% and 97.5%, respectively.
Figure 10 - Individual detection probability’s posterior distributions and respective estimated means (red vertical lines) under model Mh within each year. Black dotted lines represent the 95% interval of credibility, lower and upper boundaries at
30
Estimates for 2013 were wide and unprecise, having reached a maximum of 1478 individuals under the model M0 and a minimum of 120 animals by fitting the model Mb.
Model selection
Table 3 presents DIC and ∆DIC values for the fitted closed population models. For 2009 and 2010, DIC differences indicate the Mh model as the best fit. For 2011 the M0 model presents the best fit, whereas for 2012 differences between DIC values advocate model Mt as the best fit. For the last year, 2013, the Mb model present the lowest DIC value. In some years, differences among DIC values concerning different models were small (e.g. M0 and Mt models for 2011, and Mt and Mh models for 2012), suggesting similar goodness-of-fit. Mh presents either zero or very low values for DIC differences (apart from the years 2011 and 2013). Hence, there might be a tendency to select the Mh model as the most suitable over the sampling period.
Table 3. Deviance information criteria (DIC) and differences between model’s DIC (∆DIC).
Model
2009 2010 2011 2012 2013
DIC ∆DIC DIC ∆DIC DIC ∆DIC DIC ∆DIC DIC ∆DIC
M0 1706.59 351.43 1524.51 451.12 460.48 0.00 1534.40 198.10 4800.94 4628.12 Mt 1558.83 203.66 1455.78 382.39 483.32 22.84 1336.30 0.00 8899.35 8726.54 Mb 2128.09 772.93 3017.53 1944.14 820.95 360.47 2896.72 1560.42 172.82 0.00 Mh 1355.16 0.00 1073.39 0.00 507.30 46.82 1352.21 15.91 1129.26 956.44
31
3.3 Mark-recapture estimation - open-population models
Figures 13 and 14 illustrate the estimated posterior distributions and posterior means of apparent survival, Φ, and recapture probability, p, under the Cormack-Jolly-Seber (CJS) model. CJS model produced an estimated apparent survival mean value of 0.94 (95% CRI = 0.92 - 0.95) and an estimated recapture probability mean value of 0.17 (95% CRI = 0.16 - 0.19), (Appendix B, Table B5).
Estimates of mean survival under the CJS model differed slightly to those obtained under the Jolly-Seber model (JS): 0.81 (95% CRI = 0.48 - 0.98), (Appendix B, Table B6). Capture probability under JS model was higher (0.36, 95% CRI = 0.33 – 0.41) when compared with recapture probability obtained with the CJS model. This difference between parameters is not unusual since one is the recapture probability (CJS), and the other is the capture probability for all occasions, including the first (JS).
Figure 13 - Posterior distribution and respective estimated mean (red vertical line) of apparent survival, Φ, under the Cormack-Jolly-Seber model. Black dotted lines represent the 95% interval of credibility, lower and upper boundaries at 2.5% and 97.5%, respectively.
Figure 14 - Posterior distribution and respective estimated mean (red vertical line) of recapture probability, p, under the Cormack-Jolly-Seber model. Black dotted lines represent the 95% interval of credibility, lower and upper boundaries at 2.5% and 97.5%, respectively.
32
The estimated population sizes suggest that melon-headed whales’ population declined until 2011, increased afterwards until 2013, reached a minimum of 157 individuals in 2014, and slightly increased in 2015. Overall, annual population size seemed to have a tendency to decline over time, showing however some annual fluctuations, (Fig. 15). The estimated number of individuals alive during the study (the superpopulation size) was of 558 (95% CRI = 547.00 - 561.00) individuals (Appendix B, Table B6).
The per capita recruitment may have increased over time, but there were strong annual fluctuations in 2012 and 2015 (Fig. 16).
Figure 15 - Posterior mean of population size of melon-headed whales in the AUTEC study area. Vertical lines represented in each point represent 95% CRI.
Figure 16 - Posterior mean of per-capita recruitment of melon-headed whales in the AUTEC study area. Vertical lines represented in each point represent 95% CRI.
33
4 Discussion
Melon-headed whales have a wide distribution, encompassing tropical and subtropical waters worldwide. Nonetheless, given the little amount of research on this species, few abundance estimates exist. In the Bahamas, no study concerning abundance of melon-headed whales has been previously conducted, but a similar photographic mark-recapture study performed in the Hawaiian Islands reported a resident population of approximately 450 individuals, associated with the northwest region of the island of Hawaii, and a main population found to move through the entire extension of the Main Hawaiian Islands, of 5800 individuals, in greater depths (Aschettino, 2010).
More than 750 unique distinctive individual melon-headed whales encountered throughout the northern Bahamas, which encompasses AUTEC, are included in the catalogue used in this study. This catalogue results from the work carried out by the Bahamas Marine Mammal Organisation (BMMRO), which has been involved in the study of cetaceans in the Bahamas since 1991. It comprises sightings of melon-headed whales from 1995 to 2015, between the months of April to September. Data analysed in this study, within the AUTEC study area, refers to the period between April and July, from 2009-2015.
Resightings of individual melon-headed whales at AUTEC in consecutive years, and the frequencies of sighting ranging from one to six years, suggest that many individuals inhabit the AUTEC area between April and July suggesting a seasonal occurrence. In fact, Brownell et al. (2009) reported that despite the lack of quantitative data, sightings of large groups of melon-headed whales near some oceanic islands is seasonal (Brownell Jr. et al., 2009). Moreover, blubber biopsies of melon-headed whales in the Bahamas revealed inconsistent signatures of persistent organic pollutants when compared to resident species, such as Blainville’s beaked whales (Mesoplodon densirostris), suggesting that melon-headed whales may be seasonal migrants into the northern Bahamas from another location (Claridge et al., 2015).
4.1 Mark-recapture estimates
The number of melon-headed whales present in the AUTEC study area across six years of surveys was estimated using both closed-population and open-population models. Estimated parameters consider only the distinct individuals of the population. To estimate the entire population, the results presented here need to account for the non-distinctive individuals of the population (e.g., Wilson, Hammond, & Thompson, 1999).
34
Overall, abundance estimates remained fairly constant throughout the years under all closed-population models, with the exception of estimates for 2013. In 2013, abundance estimates increased substantially under all models, apart from model Mb, under which the estimated population’s size slightly decreased.
The estimates of abundance by year under the closed-population models ranged from a minimum of approximately 63 (95% CRI = 22.00 – 306.00) individuals in 2011, under model Mb, to a maximum of 1478 (95% CRI = 655.97 – 2324.00) individuals in 2013, under model M0. Nonetheless, despite the considerable variation between minimum and maximum estimated values, overall, excluding 2011 and 2013 estimates, population estimates under all closed-population models were similar, between 170 and 280 individuals. Estimates for 2011 and 2013 were the most unprecise regardless the applied model. Both years presented wide intervals of credibility, and posterior distributions were flat or skewed, which may be a result of the limited sampling efforts and low number of sightings in both years.
The best fitted closed-population model over the sampling period (based on DIC), was Mh, which accounted for heterogeneity of detection probabilities among individuals. This was found to be the best fitted model in 2009 and 2010, and the second best in 2012 and 2013. It gave estimates of population size from 237 to 273, excluding the estimates from skewed distribution for 2012 and 2013. In this study, the Deviance Information Criteria was merely used as a comparative model adjustment indicator as is not recommended when assessing the goodness of fit for these type of models (Kéry & Schaub, 2012).
Since capture probabilities are likely to fluctuate among individuals (heterogeneity of individuals) and through time (time effects), models Mh and Mt, showed an expected relative good fit. Although the reservations in the use of DIC as a goodness of fit measure, this model selection tool pointed Mh as the best fit in 2009 and 2010, and the Mt as the most suitable model in 2012.
Detection probabilities under closed-population models showed some variation, but mean estimates were fairly low in all models. Under model Mt, detection probabilities fluctuated among sampling occasions in each year, reflecting time effects in this parameter. Model Mb, indicated alternative trap-shy and trap happy situations from year to year. When mark-recapture studies rely on physical traps to mark the individuals, trap response is expected. In photographic mark-recapture studies, however, this effect would be unlikely to occur due to the nature of “capturing” the animals (Hammond, 1990). Hence, the lack of consistency, in which individuals presented either shy or happy behaviour, might have occurred due to external factors such as the variation in environmental conditions, or might be a consequence of melon-headed whales’
35
behaviour. P. electra often bow-ride which increases the chances of capture, and often it is the males or sub-adults that engage in bow-riding and not females with calves. Thus, perhaps there were differences in age-sex compositions encountered in different years.
Under model Mh, unlike the estimated detection probabilities in other models, mean estimates remained fairly constant in all years, apart from 2011 and 2013, which might result from the limited effort and low number of sightings.
Under open-population models, abundance estimates showed a declining trend over the years, having some annual fluctuations, which may be a result of the lower local per capita recruitment, or be related to an increase in emigration rates or shift in habitat use (Tezanos-Pinto et al., 2013). Annual fluctuations might be only an effect of the limited number of surveys and low number of sightings. The super population estimates under the Jolly-Seber model suggested that 558 individuals (95% CRI = 547.00 – 561.00) used the area at least once, during the course of the study (2009-2015).
Capture probabilities, p, under the Jolly-Seber model, and recapture probabilities under the Cormack-Jolly-Seber model, were low, suggesting that the range of this species was not sampled throughout its entire extension. Survival probabilities were low under the Jolly-Seber model, and higher under the Cormack-Jolly-Seber model.
Overall, the obtained results support the idea of an open population with an occupation range that extends beyond the AUTEC study area. Also, the effects of limited and varying sampling efforts over the study period were noteworthy, especially in 2011 and 2013. The sampling effort was not homogeneous through the entire study area, mostly due to logistic constraints, which potentially affected capture probabilities, biasing the estimates.
4.2 Model assumptions and bias
The use of capture-recapture models to estimate animal abundance both in closed and open populations relies on the validity of model assumptions. As stated previously, the violation of these assumptions might lead to biased estimates. Therefore, assumptions likely to be violated throughout the study, are discussed below.
1. There are no misclassifications, that is, the recognition system should be reliable, and marks are stable. Nicks and notches in dorsal fins have long been used as a recognition method in cetaceans (Urian et al., 2015), and are considered long-lasting in these animals. Hence, as only mutilations in the dorsal fin were considered to identify individual animals and the fact
36
that a study in Hawaii estimated that mark changes in melon-headed whales’ dorsal fins occur, on average, once every 9.2-13.8 years (Aschettino, 2010), the assumption was likely met throughout the study. The violation of this assumption may lead to a positive bias in abundance estimation, since it will lead to a lower recapture frequency, which may be interpreted as if a smaller part of the population had been marked, and to a negative bias in survival rates (Otis et al., 1978). The inclusion of only distinctive animals with high quality photographs, excluded from the mark-recapture analysis those individuals who would have been more likely to be misclassified. Nonetheless, the appearance of new marks or even severe mutilations, conducting to major dorsal fin changes, might have led to misidentification.
2. All individuals in the population have equal probability of being captured in each sampling occasion. This assumption is often violated since it is not met in most capture-recapture studies, mainly resulting from two different causes: either the members of the population are heterogeneous regarding the capture probability, or sampling methods affect the capture probability. The first occurs when individuals, for some reason, have higher or lower probabilities of being caught. It occurs due to inherent individual characteristics and may be influenced by several factors such as sex or age. There may be individuals more likely to come near the boat, and consequently be photographed, and some who are more prone to stay distant from the boat, and be less available to be photographed. All these situations may play a role in biasing the estimates, known as the trap response. Individuals captured in one sampling occasion might have a different probability from those that were not seen in the previous occasion, when the sampling method affects, positively or negatively, its behaviour. These two causes are often mixed and hard to separate. Nonetheless, both might play an important role in biasing the estimates. If an individual is more likely to be caught, or it presents a trap happy behaviour, abundance estimates will suffer a negative bias, whereas a trap-shy animal might lead to an overestimation of the true population size (Chao & Huggins, 2005). Capture probabilities might also be biased when some individuals display greater movements than others (Larsen & Hammond, 2004).
3. All encounters are instantaneous, to assure equal survival probabilities. This assumption is often violated when mark-recapture studies require physical handling of animals in order to apply marks such as tags, for example. However, in this study, photographs taken of every individual were considered “captures”, thus physical handling was avoided as well as the violation of the assumption. Survival probabilities might be biased when the individuals used in the analysis do not represent all age classes. This can be accounted for by restricting the dataset to comprise only adults, which was accomplished, since only distinctive individuals
37
were included in the analysis. As dorsal fin mutilations tend to increase with age, calves and juveniles are not expected to present a distinct dorsal fin, hence they were not included in the analysis, preventing an under-representation of younger animals.
4. The population is closed to emigration/immigration and no birth/deaths should occur. This assumption is only assumed for the closed-population models (models M0, Mt, Mb and Mh). It is one of the most important assumptions applied in this type of models and expresses that the size of the population remains constant during the study period, implying demographic, and geographic closure. Little is known about the life history of melon-headed whales. Nonetheless, the available information from a mass stranding in Japan, points to a calving season between spring and summer, with a peak in July and August, and females seem to give birth every 3-4 years (Amano et al., 2014). Hence, since the study period ranged from April to early July, births may have occurred. However, as the dataset was restricted to adults, since calves and juveniles do not show the necessary rate of distinctiveness, demographical closure was likely to be obtained. Regarding the geographic closure, the use of sampling occasions within each year may have reduced the bias. Nonetheless, melon-headed whales occur throughout the entire extension of the Great Bahama Canyon (Claridge et al., 2015) and are not confined to the AUTEC study area. Thus, migration in and out the study area might have occurred, which might have caused an upward bias in abundance estimates (Read, Urian, Wilson, & Waples, 2003).
Mark recapture techniques may be applied either using closed or open-population models. Closed population models have the advantage of being simpler to construct and interpret, due to few estimated parameters. However, these models have demanding assumptions, frequently unrealistic, such as the closure assumption. Open population models thus, are a far better choice when trying to estimate demographic parameters, despite the difficulty of implementing and interpreting the model results, due to the higher number of parameters.
Results from this work provide evidence to support the idea of a seasonal open-population with a broader distribution than the AUTEC study area. The results suggest a decline in the population size, which may be related to low recruitment rates, habitat shift, or a combination of both. Although the fact that melon-headed whales use a wider distribution than the extension of AUTEC, and despite the lack of year-round sightings, which suggest a seasonal migratory pattern, the results demonstrate a regular use of the area in the spring/summer period.
AUTEC is a navy facility were mid-frequency active sonars are regularly used as a part of fleet readiness training exercises. Melon-headed whales are regarded as potentially sensitive to sound, with a near mass stranding event in Hawaii linked to the use of mid-frequency sonars
38
nearby (Brownell Jr. et al., 2009; Southall et al., 2006), and another event in Madagascar associated with a mid-frequency multi-beam mapping sonar (Southall, Rowles, Gulland, Baird, & Jepson, 2013). In the northern Bahamas, military mid-frequency active sonars have been reported as a potential cause in a stranding involving four different species: minke whales (Balaenoptera acutorostrata), one spotted dolphin (Stenella frontalis), Cuvier’s beaked whales (Ziphius cavirostris), and Blainville’s beaked whales (Mesoplodon densirostris), (Balcomb & Claridge, 2001; Evans & England, 2001).
Despite the lack of a clear avoidance of this area by melon-headed whales, suggesting that they are not directly affected by the regular use of sonars, indirect effects related to chronic stress, for example, might occur. Claridge (2013) compared Blainville’s beaked whales’ abundance estimates within the AUTEC area, with abundance estimates from another location in the Bahamas, outside the navy range, and concluded that abundance was lower in the navy range. The author suggested the exposure to navy sonars as a possible explanation for differences in abundance inside and outside the navy range. Chronic stress induced by acoustic disturbance has been hypothesised to reduce fitness, leading to low reproductive success, which in turn, may result in lower abundance (Moore & Barlow, 2013; Wright et al., 2007).
This study establishes baseline estimates of abundance, survival, and recruitment rates for melon-headed whales inhabiting the northern Bahamian islands, and highlights the importance of long-term surveys to assess demographic parameters. Knowledge on melon-headed whales is sparse, and future studies are key to develop our understanding of this species.
39
5 General conclusions
This study has contributed novel information on melon-headed whales in the Bahamas, which can be useful in future research on this species, as population size estimation plays an important role in conservation and management efforts.
Cetaceans wide-ranging distribution, high mobility, and the heterogeneity of environmental conditions, pose constraints to research on cetaceans, which often hampers the study. Thus, survey design may not always provide enough data to meet some model assumptions, such as the closure assumption. In this work, data concerning the years of 2011 and 2013 was proved to be not enough to make reliable estimates, as the result of few sampling occasions and low number of recaptures. The interval between sampling occasions and the wider distribution of this species also posed limitations to the estimates when failing to meet the closure assumption. These constraints highlight the need to increase the sampling effort and to cover more area within the entire extension of the Great Bahama Canyon, in order to try to maximize capture probabilities, and further the understanding of the distribution pattern and home range of this species. Also, to assess population structuring and social organization of melon-heads, genetic sampling should be included and combined with photo-identification data.
Closed and open population models were employed to assess demographic parameters such as abundance, survival, and recruitment. Closed-population models, in its simplicity - lower number of estimated parameters - have demanding assumptions namely on the population’s geographic and demographic closure, which was not met in this study. Both the Cormack-Jolly-Seber model (CJS), and the Jolly-Cormack-Jolly-Seber model (JS), had simplicity specifications in its implementation that might diminish the accuracy of the parameters estimation. CJS model was implemented with a constant apparent survival and recapture probabilities, and the JS model included random effects in survival, but recruitment and capture probabilities were set as constant over time. Although providing a higher number of parameters, and pooling more realist estimates, the constant recruitment and capture probabilities over time are a disadvantage since, as mentioned before, the assumption of homogeneous capture probabilities is seldom possible. Thus, a robust design (Pollock, 1982), which combines both closed and open population models, could be the most suitable option to assess demographic parameters in wildlife studies, as it improves estimates of demographic and detection parameters, which in turn are vital to precisely estimate population abundance (Rankin et al., 2016).
The design proposed by Pollock (1982), is suitable for long-term studies as it is robust to heterogeneity of capture probabilities. This design is a hybrid approach that recognizes that
40
over a long period of survey (primary period), there are short periods (secondary periods) in which the studied population in considered to be closed. Hence, this study combines the ability of closed population models to assess capture probabilities over the short periods, with the open population models that provide more precise and accurate estimates of demographic processes such as birth, death, immigration, and emigration.
Although the high precision and realistic estimates provided by some models, an exact rendering of nature is not possible in a model (Kéry & Schaub, 2012). Hence, estimates should always be interpreted with caution, bearing in mind that models do not reveal reality, rather, they provide the best representation of a process given the available data, for a given purpose.
This work provides the first abundance, survival, and recruitment estimates for melon-headed whales in the Bahamas. Despite the discussed limitations, these estimates are therefore a reference for future research. Further monitoring is critical to develop our knowledge about this population.