A Work Project, presented as part of the requirements for the Award of a Master’s Degree in International Finance from Nova School of Business and Economics
Momentum Investing: A Stylized Model
JOÃO FRANCISCO PÓLVORA MARTINS
N. 3166
A Directed Research Project carried out with the supervision of: Professor Fernando Anjos
1
Abstract
Momentum is one of the most important anomalies in the financial world, heavily used by investors, from hedge funds to individuals. Stock returns have other characteristics, such as reversals. This study proposes accounting for that to improve momentum, while also studying volatility reduction approaches. The developed model leads to a much higher Sharpe ratio and alpha for the US market and lower risk than unrestricted momentum. An improvement of this magnitude could affect investors significantly. However, the increase in turnover is so large that there is no significant difference in returns to unrestricted momentum after monthly trading costs of 1.1%.
2
Background and Motivation
Investment based on historical information poses dazzling challenges to financial theory. In light of market efficiency, these approaches should not yield satisfactory results. However, investors have consistently achieved superior performance while using it.
Among these approaches, one of the most popular is momentum. This self-financing strategy, that bets on the best performing stocks of the past against the worst performing, produced returns not explained by known risk-factors in several markets. From 1929 to 2016, momentum offered annual excess returns of 15.1% on average and a monthly alpha of 1.8% for the US market, using an equal-weight scheme for the portfolios (Table 3 and 5).
Despite being used before him, Richard Driehaus is regarded as “the father of momentum investing” for his use and explanation of some extent of the strategy, allowing him to achieve annual returns of more than 30% in the 80’s. Various other investors have been reported to use momentum, such as George Soros or the world-famous hedge funds Winton Capital and AQR. The latter is one of the most prominent defenders of the startegy, with key figures of the fund entering the scientific discussion and challenging academics, in papers such as Asness et al. (2014).
During the last decade, momentum’s performance was exceptionally poor. The post-crisis period significantly impacted the strategy cumulative returns, with a loss of 84.9% in 2009. However, this is not a unique period in history. During the 30’s, momentum performed very poorly as well and then it entered a highly profitable long period of time, fueling arguments that the last decade was just a temporary set-back.
3 Despite the long-term results, these sudden crashes pose too much of a risk for investors of certain risk aversion levels, as they take decades to recover from, shown by Barroso and Santa-Clara (2015). The search for improvements can have significant impact, and allow even the most risk averse investors to use momentum, confident that the returns justify this level of risk. This master thesis proposes a model that accounts for other characteristics of returns, stripping stocks of contradictory signals and improving the selection process. Momentum portfolios are formed on the basis that in the medium-term (6 to 12 months) stocks will exhibit returns continuation. However, academics have also documented that returns suffer a reversal in the short and in the long-term. To address such matter, portfolios were created, in which stocks were excluded if there were also signs of reversal.
Following such practice for short-term reversal signs considerably improves momentum, with a Sharpe ratio of 1.08 compared to 0.57 of the unrestricted model, and a monthly alpha of 2.6%, according to the Fama-French 3-Factor model, between 1929 and 2016. There is also evidence that risk is significantly reduced when looking at other measures such as skewness, kurtosis or drawdown. This strategy outperforms unrestricted momentum and the market in terms of risk-adjusted returns in 8 out of the 9 decades studied, with considerable robustness across time. Since 2009, the strategy underperformed the market, but did far better than unrestricted momentum. This thesis does not address the significance of the last decade for future prospects of momentum, but it is reasonable to state that if it recovers, then so will the enhanced model.
The impact of transaction costs on these returns was also analyzed.. The evidence shows that the increase in turnover is so significant that it leads the returns of the developed model to be
4 statistically no different than the ones of momentum, at a 95% level of confidence, for a monthly trading cost higher than 1.1%. This means that the value of the study for investors could be much more limited.
The exclusion of long-term reversal signs was also studied, and it is much more difficult to attain, as the reversion happens in a long period of time and the tests made did not show satisfactory results.
Finally, the high volatility of momentum was addressed by bringing in the risk-parity concept to capital allocation and a volatility screening approach for the winners and losers portfolios. These propositions were deemed ineffective in reducing risk, leading to the conclusion that momentum’s risk originates from the relation between the winners and losers portfolios, rather than from the risk of each of them individually.
This report is organized with the following structure: Section II provides an overview of the already studied and documented characteristics of momentum. Section III is a description of the data and variables used. Section IV explains the methodology of this study. Section V discuss the ideas and results obtained. Finally, section VI provides the concluding ideas of the thesis.
5
Literature Review
Momentum was first described academically by Jegadeesh and Titman (1993). The authors tested strategies of pursuing returns continuation over the period of 1965 to 1989 in the US. The results based on a 6-month looking-back period and a 6-month holding period, yielding 12.0% excess return per year, gave birth to one of the most important market anomalies. A possible justification proposed by the authors is that momentum returns can be explained by underreaction to short-term prospects of the firm. They also report that between 2 to 5 years after formation, the returns of portfolios created using momentum tend to revert, which they justify due to an overreaction to long-term prospects.
This longer-term reversal had previously been documented. De Bondt and Thaler (1985) report that from 1926 to 1982 past losers exhibit a cumulative return 25% higher than winners, 36 months after portfolio formation. They conclude that these results support the idea of overaction to company news. In a follow-up paper (1987), they find that these returns are not explained by market risk nor by the size effect.
Since Jegadeesh and Titman, several academics have written on the topic, searching for explanations. Barberies et al (1998), Daniel et al (1998) or Hong and Stein (1999) consider that biases on how investors interpret information are the cause of the anomaly, the so called behavioral models. Hong and Stein argue that the existence of two groups of traders explains momentum: news watchers act on new information about the company but underreact, allowing the second group, momentum traders, to explore the rest of the upside, eventually creating an overreaction. Daniel, Hirshleifer and Subrahmanyam (1998) explain it in light of how investors react to private and public information differently. However, Conrad and Kaul
6 (1998) argue that the excess returns of the strategy might simply be a compensation for cross-sectional differences in mean returns.
Jegadeesh and Titman (2001) elaborate an analysis of these rationales and find that winner stocks are typically larger and have lower B/M than losers, evidencing lower risk according to the Fama-French factors. The authors also find evidence supporting the behavior models’ explanation. Grundy and Martin (2001) conclude that the returns of momentum cannot be justified by dynamic exposure to the Fama-French factors nor to industry effects, and that they are driven by stock-specific returns (that is the part of total returns that is not justified by exposure to risk factors).
Some have argued that the abnormal returns are the compensation for sudden crashes of around 80% in short periods of time. Grundy and Martin (2001) argued that this is a time-varying systematic risk and can be hedged using the beta of the strategy itself. Barroso and Santa-Clara (2015) propose a different solution, based on the overall realized volatility of the strategy, setting the weight invested in momentum as a function of volatility.
Throughout the years, momentum has been documented in numerous markets and asset classes. Rouwenhorst (1999) shows that the pattern is also present in emerging markets. However, Hameed and Kusnadi (2002) conclude that it does not yield satisfactory results in Asian Pacific Basin stock markets. Fama and French (2012) provide evidence of momentum in several developed countries, finding Japan as the only exception. Moskowitz and Pederson (2013) document the existence of momentum in several asset classes and European countries.
7 Finally, academics have addressed the impact of trading costs and whether these justify the abnormal returns. Jegadeesh and Titman (1993) briefly refer to this matter, concluding that the returns are resistant to trading costs, which they assume to be around 0.5% per month. However, Lesmond, Schill, and Zhou (2004) propose a more complex model for the estimation of these costs and conclude they are much higher, between 1 and 2% for some stocks, but between 5 and 9% for others. They argue that the strategy relies mostly on stocks with higher transaction costs and conclude that the anomaly is not persistent when accounting for those. Korajczyk and Sadka (2004) also address the matter, but conclude that some momentum strategies are resilient to trading costs. Different academics have considered different costs and the debate on this topic is ongoing.
Departing from the existing research, investors can benefit from a model that accounts for some of the characteristics described above, leading to a stronger and more stable performance. This thesis investigates if there is an alternative way of screening and weighting stocks that could help account for these known trends and improve momentum.
Data
For this study, data was extracted from the CRSP database regarding prices, holding period and delisting returns, stock exchanges and share codes. All stocks traded on the NYSE, AMEX and NASDAQ were initially considered.
Data was extracted from December 1925 to December 2016, however the described results are for the period between January 1929 to November 2016, due to an initial construction
8 period and a needed correction on the data1, resulting in a sample of 1055 months. For any given month, the return of a stock includes the dividends received, and in case of delisting, it takes into account the value of the firm at delisting date.
Using only stocks with a share code of 10 or 11 (thus, excluding non-ordinary shares and others) and a positive market capitalization for the end of month T-1, other variables were constructed for each stock based on a looking-back period (to compute these variables for a stock, it must have a return for the entire period). For each month T, the continuously compounded cumulative returns of the last 12 months were calculated (excluding T-1, and therefore only including 11 months). Also, a second set of cumulative returns was calculated in the same way, but for the last 36 months (including T-1). The rolling standard deviation was computed for month T, using the prior 36 months.
After building the ranking rules, only stocks with price higher than $5 for the end of T-1 were included in the portfolios, thus excluding penny stocks, as in Bhootra (2011).
Finally, the data used for the final regressions, concerning the risk factors (SMB, HML and the market) was extracted from Kenneth French’s data library.
1 – To include the delisting returns for month T, prices for month T and T+1 must be 0.
Methodology
In this section, the creation of different strategies will be explained. All calculations leading to the portfolios’ returns were done using Matlab software. Tests were performed on the
9 returns using Microsoft Excel and Stata. Additionally, all strategies, stocks used, and variables created follow the rules described in the Data section.
Unrestricted Momentum:
As a first step, the unrestricted momentum strategy was created. The winners portfolio is composed by the 10% stocks with the highest past 12-month cumulative return, skipping T-1 as previously stated, while the losers portfolio is composed by the T-10% stocks with lowest cumulative return. Academics, such as Fama and French (1996), had already documented that skipping the last month of the cumulative return period improves momentum, arguing that a short-term reversal is more likely to be present when this is not done.
In a given month, the amount invested in the long position (winners) and the short position (losers) is the same, to assure the strategy is self-financing. Inside the winners and losers portfolios, two schemes of weighting stocks were initially tested. In the first one, stocks are value-weighted, using the market capitalization at the end of T-1. In the second, stocks have an equal weight. The returns of momentum correspond to the difference between the returns of the long position and the ones from the short position.
These portfolios are a replication of the already existing approach. An equal-weight scheme was deemed more effective (as described in the Results section) and will serve as a basis for comparison terms, sometimes called unrestricted momentum in other sections of the report. Exclusion of 1-month reversal signals:
As discussed, stocks can suffer two contradictory signals in any given moment. On the one hand, a stock might exhibit signs of returns continuation when looking at the 12-month
10 cumulative return, which momentum tries to capture. On the other hand, stock prices can exhibit a short-term reversal sign if they continued to move considerably in T-1. Thus, clearing momentum of stocks that exhibit these signs should improve the selection process, resulting in a superior performance.
Although skipping the last month had already been documented, this means we would not account for it. The proposition in this study is that we can account for it, and exclude stocks that are more likely to suffer a reversal, rather than “leaving it to luck”.
To do so, a new portfolio of winners was constructed by taking the 10% stocks with highest cumulative return from T-12 to T-2, as before, but all stocks that are also in the top 10% from T-11 to T-1 are excluded. Similarly, a new portfolio of losers was constructed by taking the 10% stocks with lowest cumulative return from T-12 to T-2, but all stocks that are also in the bottom 10% from T-11 to T-1 are excluded.
The rest remains the same as the equal-weighted portfolio and this represents momentum cleared of short-term, 1-month, reversal signals.
Exclusion of 3-year reversal signals:
Stocks can also suffer a long-term reversion after moving considerably in one direction. This has been discussed to happen between 2 to 5 years after portfolio formation and, as before, an investor can encounter signs of such reversal together with signs of momentum.
Working very much in the same way as before, stocks were excluded from the initial winners (losers) portfolios if they were also winners (losers) using the cumulative return from T-36 to T-1.
11 This portfolio represents momentum cleared of long-term, 3-years, reversal signals.
Portfolios weighted by risk:
Several research papers have tried to deal with the high volatility and sudden crashes faced by momentum investors. Grundy and Martin (2001) or Barroso and Santa-Clara (2015) are examples of that. However, the study has been focused on searching for a hedging/allocation strategy to momentum investing that would correct that risk. The proposition in this thesis is different, it is an attempt at finding screening and weighting rules at portfolio formation that allow for a reduction in volatility, rather than a post-formation rule.
The first attempt builds on the well-known risk-parity strategy developed by the hedge fund Bridgewater Associates, which attempts at weighting stocks by risk. It uses the rolling standard deviation to assure that all stocks contribute equally to the risk of the portfolio. The idea of bringing this approach to momentum is that if the investor can reduce the volatility of the winners and losers portfolio in a separate way, than the volatility of the momentum portfolio could also be reduced.
The selection of stocks is done in exactly the same way as the unrestricted strategy, changing only the weight that each stock has (inside the portfolios).
After calculating the rolling 36-month standard deviation of each stock, this value is used to weight the stock inside the portfolio, using the following approach:
𝑤𝑖 = 1 𝜎𝑖 ∑ 1 𝜎𝑗 𝑧 1
12 Where 𝑤𝑖 is the weight of each stock inside the portfolio of winners or losers, 1
𝜎𝑖 is the inverse of the rolling 36-month standard deviation of the stock and ∑ 1
𝜎𝑗 𝑧
1 is the sum of all inversed volatilities of the included stocks.
This is a standard risk-parity approach, giving more weight to stocks with lower risk and less weight to riskier stocks, and the rolling period follows the example of Asness et al. (2012). Momentum portfolios excluding the most volatile stocks:
The second approach to reduce volatility consists of a simple exclusion of the most volatile stocks. The fact that stock returns are characterized by volatility clustering is well known. This means that periods of low (high) volatility would be followed by periods of low (high) volatility for a given stock. Considering the broad market, one could expect that if volatility for each stock is highly correlated with past periods, then the low (high) volatility stocks will remain as such. Departing from this idea, the investor who chooses the least volatile stocks, could expect them to continue being the least volatile, thus reducing the risk.
Portfolios are formed in the same way as equal-weighted momentum, but exclude all stocks with rolling standard deviation above the median for the past 36 months, maintaining the same rolling period of the Risk-Parity approach.
Other formation rules:
For all strategies and portfolios, if in any given month there are no stocks that match the screening criteria, then the portfolio (of winners or losers) is simply invested in the risk-free asset. This maintains the self-financing profile of the strategy.
13 Transaction Costs:
The average turnover of the strategies (the percentage of the portfolio that is sold each month) was computed in the same way as Grundy and Martin (2001). After this, the monthly round-trip costs that would turn profits insignificantly different from 0 at a 95% level of confidence were computed assuming a normal distribution. Also, the level of costs that would turn the difference between the returns of unrestricted momentum and of the developed model insignificantly different was calculated.
Analysis and Results
The discussion of the developed tests will take the following structure: Unrestricted momentum analysis; Elimination of reversal signals; Volatility reduction mechanisms; Final tests and robustness of the model; Transaction costs. Tables 1 to 8 summarize the results discussed and can be found in page 21 to 23 of this report.
Unrestricted momentum:
A brief analysis of Table 3, for the equal-weighted and value-weighted statistics, allows for a confirmation of the already documented characteristics of momentum and provides evidence on the superior performance of an equal-weighting scheme.
An annual excess return of 13.1% on average over the sample period and a Sharpe ratio of 0.40, confirms the magnitude of the results reported by other studies for the value-weighted strategy. Furthermore, the risk exposure analysis shows that these returns are not justified by known risk factors. Using the Fama-French 3-Factor model, the monthly alpha is 1.7%,
14 significant at a 99% confidence level, and there is negative exposure to all risk factors, meaning it diversifies risk and making momentum a very important anomaly in financial markets.
By comparison, the equal-weighted strategy delivered a much better performance, with an annual excess return of 15.1% and a Sharpe ratio of 0.57. In this case, the monthly alpha is 1.8% and the exposure to the SMB factor is no longer significant, but it still has negative exposure to the Market and HML factors. Being so, this weighting strategy was considered more effective and serves as a basis for comparison, referred to as unrestricted momentum in other parts of the report.
The results also confirm the high volatility reported in previous studies, with an annual standard deviation of 26.6% from 1929 to 2016 (for the equal-weighted portfolio), and the tendency for sudden crashes. This is not only confirmed by a very high level of kurtosis (21.3) and significantly negative skewness (-2.5), but also by two historical crashes in 1932 and 2009, in which the strategy lost more than 80%.
Elimination of reversal signals:
Clearing momentum of short-term reversal signs produces an increase in Sharpe Ratio to 1.08, due to a significant increase in excess return. The likelihood of extreme events is much lower and the probability of them being negative also decreases considerably, as measured by kurtosis and skewness. This supports the hypothesis that accounting for the last month of the cumulative return, and using it to exclude stocks that are more likely to enter a reversal period, is more effective than ignoring it.
15 The strategy developed to exclude stocks with long-term reversion signs does not improve momentum. The risk increases significantly when measured in terms of standard deviation or in terms of skewness and kurtosis, while the excess return barely changes.
A possible explanation, that also reconciles the results achieved for short-term reversion, is that the latter happens in a short period of time, 1 month, and so, using that month is very effective in clearing reversal signals. Long-term reversal happens in a much longer period, it is documented to happen between 2 and 5 years after formation. Thus, it is much harder to avoid the period in which reversal specifically happens. A more complex strategy of excluding stocks could be tested, such has excluding stocks that are winners/losers in any cumulative period between 2 and 3 years. However, it would likely result in a selection process that does not pick any stocks most of the times.
Volatility reduction mechanisms:
The results were not satisfying, as can be seen in Table 3, and did not prove the original ideas. None of the approaches has a positive effect on momentum, especially when compared to the simple equal-weighted scheme.
The tests made for the use of a risk-parity approach do not confirm the initial hypothesis, as it falls short of improving the equal-weighted momentum (however performing better than a value-weighted strategy). The Sharpe ratio of 0.48 is half-way between value-weight and equal-weight momentum, and the level of kurtosis and skewness is worse. The higher risk is also confirmed by a worse performance during the historical crashes.
16 For the volatility screening strategy, the results are slightly worse and again do not confirm the hypothesis. Sharpe ratio decreases to 0.44, with lower return and higher volatility. Other measures of risk improve slightly, but the performance under the historical crashes is inconclusive.
This shows that attempts to reduce momentum risk at portfolio formation are not effective. The conclusion can then be drawn that most of the risk comes from the relationship between the winners and losers portfolios, and not from the volatility of each of them individually. This means that only rules changing the allocation of capital to momentum can accurately reduce risk for investors by timing the strategy better.
Further analysis and tests:
Building on the study previously described, the strategy that excludes all stocks remaining in the winners/losers portfolio during T-1 was further analyzed to fully understand its benefits. The result is a dramatic improvement to momentum. The Sharpe ratio almost doubles to 1.08, caused by an increase in average annual excess return from 15.1% to 28.6%. While standard deviation remains the same, other measures of risk provide much more encouragement, with kurtosis decreasing to 11.3 and negative skewness reduced to -0.7, exhibiting a lower tendency to extreme cases, and especially to extreme negative cases.
This new momentum model achieves a positive and significant alpha both according to the CAPM and to the Fama-French 3-Factor model. The analysis made using the latter shows that the monthly alpha is 2.6% and the strategy has a negative exposure to the HML factor
17 (the exposure to the SMB and Market factor is not significant). The results can be summarized in the following equations (significance levels in Table 5):
Unrestricted model: 𝑟𝑊𝑀𝐿,𝑡 = 1.8 − 0.084𝑟𝑆𝑀𝐵,𝑡− 0.689𝑟𝐻𝑀𝐿,𝑡 − 0.332𝑟𝑅𝑀𝑅𝐹,𝑡
Final model: 𝑟𝑊𝑀𝐿,𝑡 = 2.6 − 0.113𝑟𝑆𝑀𝐵,𝑡− 0.495𝑟𝐻𝑀𝐿,𝑡 − 0.05𝑟𝑅𝑀𝑅𝐹,𝑡
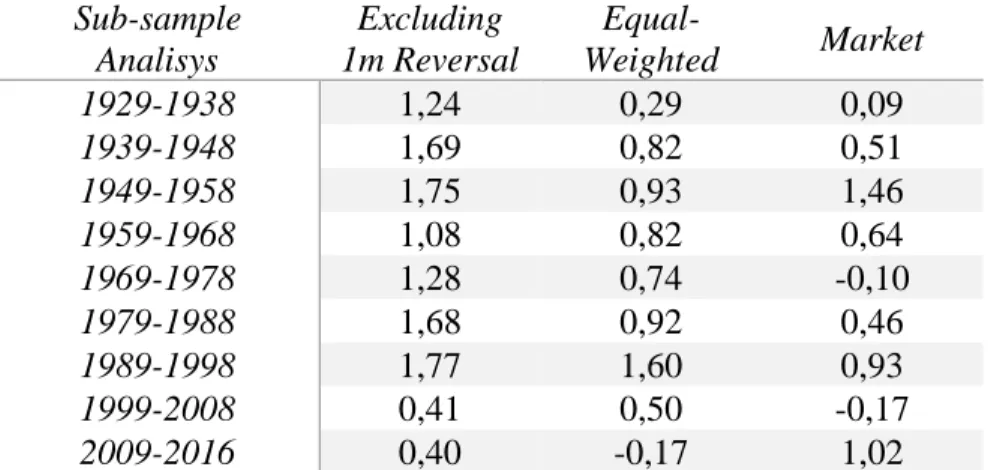
As a robustness check, the performance in several sub-samples was studied and shown in Table 4. In every full decade of the studied period, the new model outperforms unrestricted momentum considerably, except for 1999 to 2008. The period since 2009 has been the worst in history for unrestricted momentum and while it also was for the developed model, the latter performed much better, with a Sharpe ratio of 0.40. The last decade was the only period in history in which the final model underperforms the market.
Transaction Costs:
Finally, one last topic that must be addressed are the trading costs of the strategy (Tables 7 and 8 provides a summary). These costs have been researched for unrestricted momentum and there is no universally accepted agreement on how much they impact the strategy. They are composed of trading commissions, taxes, bid-ask spread, and sometimes other costs are considered, such as the price impact of the trade. For the purpose of this thesis, a comparison between the final developed model (analyzed in the previous sub-section) and the unrestricted momentum trading costs was studied.
First, the turnover of the developed strategy is now 100%, as it is a rule that no stocks that remained in the winners/losers group are included in the portfolio. This compares to an
18 average turnover of 33.2% of unrestricted momentum (a value lower than the one found by Grundy and Martin (2001), possibly due to different screening and weighting rules).
With a turnover much higher than unrestricted momentum, the final model must have much higher costs. Another important remark is that the strategy and unrestricted momentum only include stocks with price higher than $5, meaning that penny stocks are avoided, which are known to have higher transaction costs, as for instance, bid-ask spread.
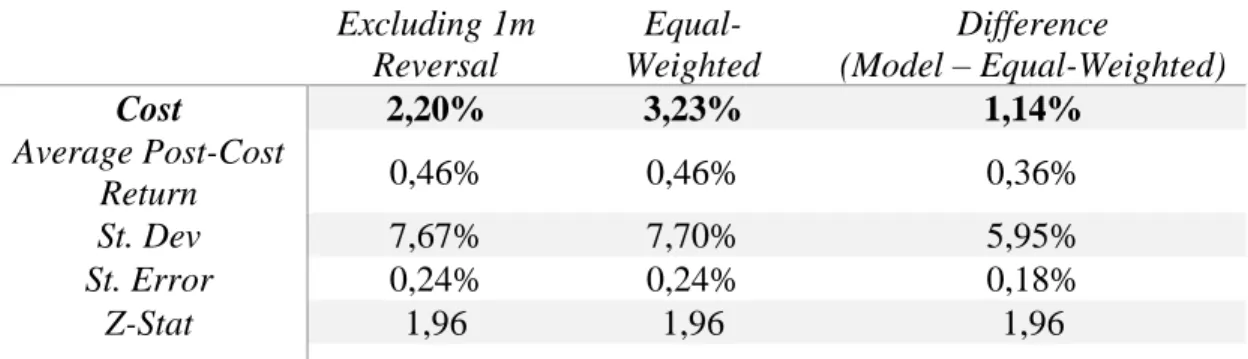
Finally, the level of round-trip transaction costs that would turn the average returns of the strategy insignificantly different than 0 at 95% level of confidence is 2.2% per month, compared to 3.2% found for unrestricted momentum. The costs that remove significance from the returns of the final strategy are therefore 30% lower than for momentum.
Furthermore, after costs there would be no significant difference between the returns of the model developed and the returns of momentum at a 95% level of confidence if monthly costs are higher than 1.1%, which several academics have estimated to be the case.
Trading costs have a much larger impact on the model and they can easily prevent investors from taking advantage of the higher returns. As Grundy and Martin (2001) argue, this does not explain the pattern observed but it has important implications for investors, who must be careful with the application of the strategy.
19
Concluding Arguments
The aim of this thesis was to create practices of accounting for other characteristics of stock returns in momentum trading, such as reversal trends and volatility control mechanisms, improving the already highly satisfactory returns of the strategy.
To account for the short-term reversal experienced by stocks over a 1-month period after 12 months of returns continuation trend, stocks which exhibit signs of this feature were excluded from the winners/losers portfolios. This version of momentum investing achieves a dramatic improvement to the unrestricted strategy, with a Sharpe ratio of 1.08 and a monthly alpha of 2.6%, creating an even bigger puzzle for financial theory. However, the drawback of the model is the significant increase in transaction costs due to a monthly turnover of 100%. After monthly costs of 1.1%, there is no significant difference between the returns of momentum and the ones of the created model.
Pursuing the same idea, the exclusion of stocks showing signs of long-term reversal was tested. The results are not as encouraging, and this could be explained by the fact that this type of reversal happens in a broader period of time, and thus it is more difficult to avoid. The risk-parity and the volatility screening approaches used to reduce risk were also not effective. The conclusion was drawn that momentum’s risk is due to the interaction between the portfolios of losers and winners, and not by the risk of each of them individually.
As a suggestion for possible research in the future, it would be important to check how this new model holds internationally and if it can be combined with other improvements that have already been suggested by academics. The model seems to do a very good job in improving
20 momentum under normal market circumstances, but it is not effective in doing so under crisis periods. Combining the model with the strategy developed by Barroso and Santa-Clara (2015), which reduces the sudden crashes faced by momentum, would be very interesting for future research.
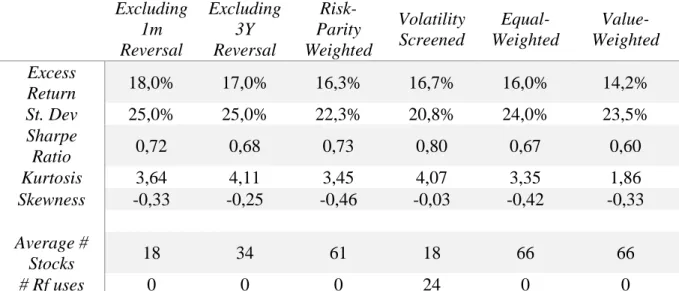
21 Appendix Excluding 1m Reversal Excluding 3Y Reversal Risk-Parity Weighted Volatility Screened Equal-Weighted Value-Weighted Excess Return 18,0% 17,0% 16,3% 16,7% 16,0% 14,2% St. Dev 25,0% 25,0% 22,3% 20,8% 24,0% 23,5% Sharpe Ratio 0,72 0,68 0,73 0,80 0,67 0,60 Kurtosis 3,64 4,11 3,45 4,07 3,35 1,86 Skewness -0,33 -0,25 -0,46 -0,03 -0,42 -0,33 Average # Stocks 18 34 61 18 66 66 # Rf uses 0 0 0 24 0 0
Table 1 – Statistics for Winners portfolios (1929-2016). Excess Return; St. Dev; Sharpe Ratio – annualized. Kurtosis; Skewness –Monthly returns
Excluding 1m Reversal Excluding 3Y Reversal Risk-Parity Weighted Volatility Screened Equal-Weighted Value-Weighted Excess Return -13,9% -2,9% -0,9% 0,3% -2,4% -2,2% St. Dev 32,9% 38,2% 35,8% 32,7% 35,2% 36,6% Sharpe Ratio -0,42 -0,08 -0,02 0,01 -0,07 -0,06 Kurtosis 11,13 17,62 17,76 22,42 15,40 13,24 Skewness 0,99 2,17 1,97 2,03 1,77 1,43 Average # Stocks 13 25 37 15 39 39 # Rf uses 5 10 0 160 0 0
Table 2 – Statistics for Losers portfolios (1929-2016). Excess Return; St. Dev; Sharpe Ratio – annualized. Kurtosis; Skewness – Monthly returns
22 Excluding 1m Reversal Excluding 3Y Reversal Risk-Parity Weighted Volatility Screened Equal-Weighted Value-Weighted Market Excess Return 28,6% 16,6% 13,8% 13,1% 15,1% 13,1% 7,3% St. Dev 26,5% 30,4% 29,1% 29,5% 26,6% 32,4% 18,7% Sharpe Ratio 1,08 0,55 0,48 0,44 0,57 0,40 0,39 Kurtosis 11,35 25,55 24,01 17,47 21,29 12,64 7,83 Skewness -0,75 -2,86 -2,65 -1,61 -2,47 -1,72 0,20 % Positive Months 67,01% 63,60% 61,80% 61,04% 63,89% 60,19% 59,53% Max Drawdown -84,6% -98,1% -96,5% -95,9% -90,1% -93,8% -83,7% 1932 -26,8% -66,7% -93,8% -91,9% -80,8% -79,0% -8,4% 2009 -76,3% -85,4% -86,7% -3,2% -84,9% -78,1% 28,4%
Table 3 – Statistics for WML portfolios (1929-2016). Excess Return; St. Dev; Sharpe Ratio – annualized. Kurtosis; Skewness – Monthly returns Sub-sample Analisys Excluding 1m Reversal Equal-Weighted Market 1929-1938 1,24 0,29 0,09 1939-1948 1,69 0,82 0,51 1949-1958 1,75 0,93 1,46 1959-1968 1,08 0,82 0,64 1969-1978 1,28 0,74 -0,10 1979-1988 1,68 0,92 0,46 1989-1998 1,77 1,60 0,93 1999-2008 0,41 0,50 -0,17 2009-2016 0,40 -0,17 1,02
23
Table 5 – Fama-French 3 Factor Model (monthly returns)
Table 6 – CAPM Model (monthly returns)
Excluding 1m Reversal Equal-Weighted Difference (Model – Equal-Weighted) Cost 2,20% 3,23% 1,14% Average Post-Cost Return 0,46% 0,46% 0,36% St. Dev 7,67% 7,70% 5,95% St. Error 0,24% 0,24% 0,18% Z-Stat 1,96 1,96 1,96
Table 7 – Summary of trading cost that renders the returns insignificant at a 5% confidence level
Losers Winners Total
Equal-Weighted 28,8% 37,6% 33,2%
Excluding 1m
Reversal 100% 100% 100%
24
References
Asness, C. S., Frazzini, A., & Pedersen, L. H. (2012). Leverage aversion and risk parity. Financial Analysts Journal, 68(1), 47-59.
Asness, C. S., Moskowitz, T. J., & Pedersen, L. H. (2013). Value and momentum everywhere. The Journal of Finance, 68(3), 929-985.
Asness, C., Frazzini, A., Israel, R., & Moskowitz, T. (2014). Fact, fiction, and momentum investing. The Journal of Portfolio Management, 40(5), 75-92.
Barberis, N., Shleifer, A., & Vishny, R. (1998). A model of investor sentiment. Journal of financial economics, 49(3), 307-343.
Barroso, P., & Santa-Clara, P. (2015). Momentum has its moments. Journal of Financial Economics, 116(1), 111-120.
Bhootra, A. (2011). Are momentum profits driven by the cross-sectional dispersion in expected stock returns?. Journal of Financial Markets, 14(3), 494-513.
Chan, L. K., Jegadeesh, N., & Lakonishok, J. (1996). Momentum strategies. The Journal of Finance, 51(5), 1681-1713.
Chan, K., Hameed, A., & Tong, W. (2000). Profitability of momentum strategies in the international equity markets. Journal of financial and quantitative analysis, 35(2), 153-172. Conrad, J., & Kaul, G. (1998). An anatomy of trading strategies. The Review of Financial Studies, 11(3), 489-519.
Daniel, K., Hirshleifer, D., & Subrahmanyam, A. (1998). Investor psychology and security market under‐and overreactions. the Journal of Finance, 53(6), 1839-1885.
Bondt, W. F., & Thaler, R. (1985). Does the stock market overreact?. The Journal of finance, 40(3), 793-805.
De Bondt, W. F., & Thaler, R. H. (1987). Further evidence on investor overreaction and stock market seasonality. Journal of finance, 557-581.
Fama, E. F., & French, K. R. (1996). Multifactor explanations of asset pricing anomalies. The journal of finance, 51(1), 55-84.
Fama, E. F., & French, K. R. (2012). Size, value, and momentum in international stock returns. Journal of financial economics, 105(3), 457-472.
Frazzini, A., Israel, R., & Moskowitz, T. J. (2012). Trading costs of asset pricing anomalies.
25 Griffin, J. M., Ji, X., & Martin, J. S. (2003). Momentum investing and business cycle risk: Evidence from pole to pole. The Journal of Finance, 58(6), 2515-2547.
Grundy, B. D., & Martin, J. S. M. (2001). Understanding the nature of the risks and the source of the rewards to momentum investing. The Review of Financial Studies, 14(1), 29-78.
Gulen, H., & Petkova, R. (2015). Absolute Strength: Exploring Momentum in Stock Returns.
Hameed, A., & Kusnadi, Y. (2002). Momentum strategies: Evidence from Pacific Basin stock markets. Journal of financial research, 25(3), 383-397.
Hong, H., & Stein, J. C. (1999). A unified theory of underreaction, momentum trading, and overreaction in asset markets. The Journal of finance, 54(6), 2143-2184.
Jegadeesh, N., & Titman, S. (1993). Returns to buying winners and selling losers: Implications for stock market efficiency. The Journal of finance, 48(1), 65-91.
Jegadeesh, N., & Titman, S. (2001). Profitability of momentum strategies: An evaluation of alternative explanations. The Journal of finance, 56(2), 699-720.
Korajczyk, R. A., & Sadka, R. (2004). Are momentum profits robust to trading costs?. The Journal of Finance, 59(3), 1039-1082.
Lee, C., & Swaminathan, B. (2000). Price momentum and trading volume. the Journal of Finance, 55(5), 2017-2069.
Lesmond, D. A., Schill, M. J., & Zhou, C. (2004). The illusory nature of momentum profits. Journal of financial economics, 71(2), 349-380.
Moskowitz, T. J., & Grinblatt, M. (1999). Do industries explain momentum?. The Journal of Finance, 54(4), 1249-1290.
Rouwenhorst, K. G. (1999). Local return factors and turnover in emerging stock markets. The journal of finance, 54(4), 1439-1464.