Integrated Master in Chemical Engineering
Carbon Dioxide Separation from Industrial
Streams
Master’s Dissertation
byRute Agostinha Gomes Seabra
Developed for the Dissertation course unit at:
LSRE – Laboratory of Separation and Reaction Engineering
Supervisor: Doutora Ana Mafalda Ribeiro Supervisor: Doutor Alexandre Ferreira
Chemical Engineering Department
Acknowledgments
Nesta secção encontram-se notas de agradecimento a pessoas que contribuíram para a realização desta tarefa que começou muito antes da faculdade e que depende de muito mais que capacidade.
Começo por ti meu irmão, por me teres apoiado a todos os níveis e acreditares em mim. Obrigada por muitas vezes me teres citado Sun Tzu dizendo que «Every battle is won before it’s ever fought», para ter confiança e ir à luta!
Agradeço aos meus pais que sempre me deram tudo o que precisei e lutaram para eu ter as oportunidades que eles não tiveram. Obrigada não chega para descrever o tamanho da gratidão que tenho por aqueles que me deram vida e ajudam a crescer.
Agradeço à minha madrinha, exemplo de persistência, por todo o apoio e por ter exigido de mim responsabilidade e mérito desde o momento em que aprendi a segurar um lápis.
Ao meu amigo Ângelo por não demonstrar a menor dúvida de que eu vou conseguir tudo o que me propuser a fazer e que dentro de todas as peripécias e obstáculos, tudo se resolve, tudo se aprende e tudo se faz. Às minhas amigas que me acompanharam ao longo desta aprendizagem e que partilham comigo histórias que levamos para a vida. É quando a exigência é grande e o esforço e o cansaço atingem o máximo que damos mais valor àqueles que tornam a nossa vida mais feliz. Obrigada!
Agradeço ao Luís Carlos Matos por todos os ensinamentos e sobretudo amizade!
Todos os meus professores foram importantes, desde a primária à faculdade, desde os que ensinavam de forma exemplar aos que incentivavam o ensino autónomo. Contudo e desta casa destaco aqueles que me fizeram ver mais além e aos quais devo o gosto por aquilo que tenho feito e ao que farei: os meus orientadores Dra. Ana Mafalda Ribeiro e Dr. Alexandre Ferreira por todo o conhecimento, acompanhamento, dedicação e tempo, e aos professores José Miguel Loureiro, Adélio Mendes, João Campos, Fernando Martins, Romualdo Salcedo e Madalena Dias por representarem para mim exemplos a seguir.
Agradeço ao professor Alírio Rodrigues pela disponibilização das instalações para a realização da tese e ao LSRE pela oportunidade de desenvolvimento desta dissertação.
Finalmente, agradeço-te a ti, José Pedro Alves, por todo o amor, coragem, força e perseverança que partilhaste comigo e me fizeste aperceber que tinha. Obrigada por acreditares sempre em mim e seres a razão quando a emoção fala mais alto.
Carbon dioxide separation from industrial streams
Este trabalho foi financiado por: Projeto POCI-01-0145-FEDER-006984 - Laboratório Associado LSRE-LCM - financiado pelo Fundo Europeu de Desenvolvimento Regional (FEDER), através do COMPETE2020 – Programa Operacional Competitividade e Internacionalização (POCI) e por fundos nacionais através da Fundação para a Ciência e a Tecnologia I.P.
Resumo
De forma a limitar as emissões de CO2 e a diminuir o seu conteúdo no gás natural, tecnologias de captura e armazenamento de dióxido de carbono tem sido desenvolvidas. Separação e purificação de misturas gasosas através de fenómenos de adsorção tem sido valorizadas pelas indústrias química e petroquímica devido ao baixo consumo energético e ao baixo investimento de capital exigido. A necessidade de capacidade de adsorção adequada restringe a escolha de adsorventes para processos de separação. Neste trabalho, zeolitos 4A e 13X serão estudados com o objetivo de avaliar as capacidades adsortivas para a captura de dióxido de carbono de correntes de gases de escape e tratamento do gás natural.
Em primeiro lugar, de forma a caracterizar os materiais e, por consequência obter informação útil para o equilíbrio de adsorção e propriedades cinéticas, propriedades como isotérmicas de adsorção de N2 e de CO2 a 77 K e 273 K, respetivamente, intrusão de mercúrio, microscopia eletrónica de varrimento, raios X de energia dispersiva e difração de raios X foram estudadas. Isotérmicas de adsorção de gases puros (CO2, CH4 e N2) foram determinadas a 303, 343 e 373 K. A isotérmica de Dual site Langmuir foi usada para ajustar os resultados experimentais da adsorção do CO2 e a One site Langmuir para a adsorção do CH4 e N2. A capacidade de adsorção e o calor de adsorção para cada gás foi determinado. Dióxido de carbono foi o adsorvente com melhor afinidade tanto nos zeólitos 4A como nos 13X tendo atingido a maior capacidade de adsorção nos zeólitos 13X. Azoto foi o gás menos adsorvido em ambos os zeólitos tendo atingido a menor capacidade de adsorção nos zeólitos 4A. O calor isotérico de adsorção foi calculado segundo a equação de Clausius-Clapeyron e posteriormente comparado com valores descritos na literatura.
Estudos cinéticos foram efetuados a 308, 323, 343 e 373 K através da técnica de ZLC com análise da resposta a tempos longos e do modelo completo. Os resultados evidenciaram que o controlo de difusão se encontra nos microporos na adsorção de CO2 nos zeólitos 4A BFK 2.5 – 5.0 mm, 4A BFK 1.6 – 2.5 mm, in 13X BFK 1.2 – 2.0 mm e 13X BFK 6x8 mesh, e na adsorção de CO2 e CH4 no zeólito 4A BFK 1.6 – 2.5 mm HSD. Em termos de difusão, o azoto apresenta o coeficiente de difusividade mais elevado e o dióxido de carbono o mais baixo.
Abstract
In order to limit the CO2 emissions and to decrease its content in natural gas, technologies to capture and storage carbon dioxide have been developed. Separation and purification of gas mixtures by adsorption has gain interest to chemical and petrochemical industries due to the low energy requirements and low capital investment costs. The requirement for adequate adsorption capacity restricts the choice of adsorbents for practical separation processes. In this study, Zeolites 4A and 13X will be tested with the purpose of evaluating the adsorption properties for carbon dioxide capture from flue gas streams, and sweetening of natural gas. First, to characterize the materials, and therefore obtain useful information to adsorption equilibrium and adsorption kinetics properties, several properties as the N2 and CO2 physisorption isotherms measured at 77 K and 273 K, respectively, mercury intrusion, Scanning Electron Micrograph (SEM), Energy Dispersive X-ray and X-ray Diffraction (XRD) were performed. Adsorption isotherms of pure gases (CO2, CH4 and N2) were determined at 303, 343 and 373 K. The Dual site Langmuir was used to fit the experimental results for adsorption of CO2 and One site Langmuir for the adsorption of CH4 and N2. The adsorption capacity and the heat of adsorption for each gas was determined. The carbon dioxide was the adsorbate with best affinity for both 4A and 13X reaching greater adsorption capacity in 13X. The least adsorbed was nitrogen in both 4A and 13X reaching smallest adorption capacity in 4A. The isosteric heats of adsorption were calculated by the Clausius-Clapeyron equation and additionally compared with literature values.
The kinetics studies were performed at 308, 323, 343 and 373 K with the zero length technique analysing the long time response and the complete model. The results showed that the micropore diffusion is the controlling mechanism in the adsorption of CO2 in 4A BFK 2.5 – 5.0 mm, 4A BFK 1.6 – 2.5 mm, in 13X BFK 1.2 – 2.0 mm and 13X BFK 6x8 mesh and in adsorption of CO2 and CH4 in 4A BFK 1.6 – 2.5 mm HSD. In terms of diffusion the N2 has the highest diffusion coefficient and CO2 the lowest.
Keywords: adsorption, zeolite 4A, zeolite 13X, adsorption equilibrium isotherm, zero length column
Declaração
Declara, sob compromisso de honra, que este trabalho é original e que todas as contribuições não originais foram devidamente referenciadas com identificação da fonte.
Table of Contents
1 Introduction ... 1
1.1 Motivation and Relevance ... 1
1.2 Outline ... 2
2 State of the art ... 3
2.1 Zeolites ... 3
2.2 Zero Length Column ... 4
3 Material and Methods ... 5
3.1 Materials used ... 5
3.1.1 Adsorbent ...5
3.1.2 Gases ...6
3.2 Methods ... 6
3.2.1 Adsorption equilibrium ...6
3.2.2 Adsorption equilibrium experimental ...7
3.2.3 Zero Length Column ...9
4 Results and Discussion ... 13
4.1 Zeolites characterization ... 13
4.1.1 Zeolite 4A ... 13
4.1.2 Zeolite 13X ... 16
4.2 Adsorption equilibrium isotherms ... 19
4.3 Isosteric heat of adsorption ... 22
4.4 Adsorption kinetics ... 24
4.4.1 4A BFK 2.5-5.0 mm ... 25
4.4.2 4A BFK 1.6-2.5 mm ... 27
4.4.3 4A BFK 1.6-2.5 mm HSD ... 29
4.4.4 4A BFK Zeolites – Determination of the diffusional controlling mechanism and the difusivity coefficients ... 31
4.4.5 13X BFK 1.2-2.0 mm ... 36
4.4.7 13X BFK Zeolites – Determination of the diffusional controlling mechanism and the
difusivity coefficients ... 40
5 Conclusions ... 45
6 Evaluation of the work done ... 47
6.1 Accomplished objectives ... 47
6.2 Limitations and future work ... 47
6.3 Final appreciation ... 47
References ... 49
Appendix 1 Helium pycnometries ... 51
Appendix 2 Liquid densities ... 53
Appendix 3 SEM ... 55
Appendix 4 Isotherms of 4A and 13X zeolites ... 61
Isotherms of zeolites 4A BFK 1.6-2.5 mm HSD, 4A BFK 2.5-5.0 mm ... 61
Isotherms of 13X BFK 6x8 mesh and 13X BFK 1.2 – 2.0 mm ... 62
Isotherms of CO2, CH4 and N2 at 303, 343 and 373 K in 4A and 13X zeolite samples in terms of amount adsorved per volume of adsorbent. ... 64
Appendix 5 Calibration of the volumetric flow rate of the Gas Chromatographer ... 67
Appendix 6 ZLC columns ... 69
Appendix 7 ZLC results ... 71
Experimental results in each ZLC column ... 71
Comparison of experiments with the same flow rate and temperature but different zeolite ... 76
List of Figures
Figure 1- Zero length column. ...4 Figure 2- Zeolite: a) 4A BFK 2.5-5.0 mm; b) 4A BFK 1.6-2.5 mm; c) 4A BFK HSD 1.6-2.5 mm; d) 13X BFK 1.2-2.0 mm; e) 13X BFK 6x8 mesh. ...5 Figure 3- (a) Crystal structure of type A zeolite. (b) Crystal structure of type X zeolite [17]. Silicon atoms are teal, red atoms are oxygen and the orange spheres fill the voids of the sodalite cages ...6 Figure 4- a) Magnetic suspension microbalance (Rubotherm, Germany); b) Acquisition system of the magnetic microbalance. ...7 Figure 5- Schematic diagram of the experimental set-up for adsorption equilibrium measurements. ...8 Figure 6- Varian gas chromatography (Varian, Holland). ...9 Figure 7- Zero length column experimental set-up. ... 10 Figure 8- SEM images of zeolites: a) 4A BFK 2.5-5.0 mm, b) 4A BFK 1.6-2.5 mm, c) 4A BFK HSD 1.6-2.5 mm. ... 13 Figure 9- Pore size distribution by mercury intrusion of zeolite 4A. ... 13 Figure 10- Adsorption isotherms in Zeolites 4A of Nitrogen at 77 K (a) and of Carbon Dioxide at 273 K (b). ... 14 Figure 11- X-Ray diffraction data of the 4A zeolite samples. ... 15 Figure 12- SEM images of zeolites: a) 13X BFK 1.2-2.0 mm, b) 13X BFK 6x8 mesh (2.36-3.35 mm). .... 16 Figure 13- Pore size distribution by mercury intrusion of zeolites: a) 13X BFK 1.2 - 2.0 mm, b) 13X BFK 6x8 mesh (2.36-3.35 mm). ... 16 Figure 14- Adsorption isotherms in Zeolite 13X BFK of Nitrogen at 77 K (a) and of Carbon Dioxide at 273 K (b). ... 17 Figure 15- X-Ray diffraction data of the 13X zeolite samples. ... 18 Figure 16- Amount of a) CO2, b) CH4 and c) N2 adsorbed on 4A 1.6-2.5 mm zeolite: experimental points
(closed adsorption, open desorption) at 303, 343, 373 K and Dual site Langmuir fiiting for CO2 and One
site Langmuir for CH4 and N2 (lines). ... 19
Figure 17- Comparison between the adsorption capacities per volume of adsorbent of CO2 in 4A
zeolites at 303 K. ... 20 Figure 18- Adsorption equilibrium isoterms of N2 on 13X BFK 6x8 mesh zeolite: experimental points
(closed adsorption, open desorption) at 303, 343, 373 K and One site Langmuir (lines). ... 21 Figure 19- Single-component isosteric heats of adsorption on 4A BFK 1.6-2.5 mm for CO2, CH4 and N2 as
function of the amount adsorbed in the temperature range of 303 – 373 K; Lines are the values
Figure 20- Single-component isosteric heat of adsorption on 13X BFK 6x8 mesh for N2 as function of the
amount adsorbed in the temperature range of 303 – 373 K; Lines are the values obtained through the Langmuir fitting. ... 23 Figure 21- ZLC curves for CO2 in 4A BFK 2.5 – 5.0 mm zeolite at 308 - 373 K. Solid lines in (a) represent
the results using the long time response and (b) the complete ZLC model results. ... 25 Figure 22- ZLC curves for CH4 in 4A BFK 2.5 – 5.0 mm zeolite at 308, 323, 343 and 373 K. Solid lines in
(a) represent the results using the long time response and (b) the complete ZLC model results. ... 26 Figure 23- ZLC curves for CO2 in 4A BFK 1.6 – 2.5 mm zeolite at 308, 323, 343 and 373 K. Solid lines in
(a) represent the results using the long time response and (b) the complete ZLC model results. ... 27 Figure 24- ZLC curves for CH4 in 4A BFK 1.6 – 2.5 mm zeolite at 308, 323, 343 and 373 K. solid lines in
(a) represent the results using the long time response and (b) the complete ZLC model results. ... 28 Figure 25- ZLC curves for CO2 in 4A BFK 1.6 – 2.5 mm HSD zeolite at 308, 323, 343 and 373 K. Solid
lines in (a) represent the results using the long time response and (b) the complete ZLC model results. ... 29 Figure 26- ZLC curves for CH4 in 4A BFK 1.6 – 2.5 mm HSD zeolite at 308, 323, 343 and 373 K. Solid
lines in (a) represent the results using the long time response and (b) the complete ZLC model results. ... 30 Figure 27- Dependence of the apparent diffusivity coeficient for CO2 in 4A zeolites with temperature.
... 32 Figure 28- Dependency of the pore diffusivity in 4A BFK zeolites with 𝑇3/2. ... 33 Figure 29- Dependence of the apparent diffusivity coeficient for CH4 in 4A zeolites with temperature.
... 34 Figure 30- Comparison of the blank test with the results of 4A zeolites for: a) 308 K, b) 343 K and c) 373 K and a flow rate of 5.83 x 10 -7 m3 s-1 in PTN conditions. ... 35
Figure 31- ZLC curves for CO2 in 13X BFK 1.2 – 2.0 mm zeolite at 308, 323, 343 and 373 K. Solid lines in
(a) represent the results using the long time response and (b) the complete ZLC model results. ... 36 Figure 32- ZLC curves for CH4 in 13X BFK 1.2 – 2.0 mm zeolite at 308, 323, 343 and 373 K. Solid lines in
(a) represent the results using the long time response and (b) the complete ZLC model results. ... 37 Figure 33- ZLC curves for CO2 in 13X BFK 6x8 mesh zeolite at 308, 323, 343 and 373 K. Solid lines in (a)
represent the results using the long time response and (b) the complete ZLC model results. ... 38 Figure 34- ZLC curves for CH4 in 13X BFK 6x8 mesh zeolite at 308, 323, 343 and 373 K. Solid lines in (a)
represent the results using the long time response and (b) the complete ZLC model results. ... 39 Figure 35- Dependence of the apparent diffusivity coeficient of CO2 in 13X zeolites with temperature.
... 40 Figure 36- Dependency of the pore diffusivity in 13X BFK zeolites with 𝑇3/2. ... 41
Figure 37- Dependence of the apparent diffusivity coeficient for adsorption of CH4 in 13X zeolites with
temperature. ... 42 Figure 38- Dependency of the pore diffusivity in 13X BFK zeolites with 𝑇3/2. ... 43 Figure 39- Comparison of the blank test with 13X zeolites for: a) 308 K, b) 343 K and c) 373 K and a 5.83 x 10 -7 m3 s-1 in PTN conditions. ... 44
List of Tables
Table 1- Total intrusion volume, surface area, average pore diameter, apparent and solid density obtained from mercury intrusion and solid density obtained form helium picnometry in the 4A
zeolites. ... 14 Table 2- Surface area of zeolite 4A BFK 2.5-5.0 mm obtained from physisorption isotherms of Nitrogen at 77 K and Carbon Dioxide at 273 K. ... 15 Table 3- Total intrusion volume, surface area, average pore diameter, apparent and solid density obtained from mercury intrusion and solid density obtained form helium picnometry in the 13X zeolites. ... 17 Table 4- Surface area of zeolite 13X BFK of Nitrogen 77 K and Carbon Dioxide at 273 K. ... 17 Table 5- Fitting parameters of the Langmuir model for CO2, CH4 and N2 adsorption equilibrium on 4A
BFK 1.6-2.5 mm. ... 20 Table 6- Fitting parameters of the Langmuir model for N2 adsorption equilibrium on 13X BFK 6x8
mesh. ... 21 Table 7- Flow rate of the experiments at different temperatures (at the experimental conditions). . 24 Table 8- Experimental conditions for the ZLC runs with 4A BFK 2.5 – 5.0 mm. ... 25 Table 9- Long time response and complete ZLC model parameters for CO2 in 4A BFK 2.5 - 5.0 mm
zeolite at 308, 323, 343 and 373 K. ... 25 Table 10- Long time response and the complete ZLC model parameters for CH4 in 4A BFK 2.5 - 5.0 mm
zeolite at 308, 323, 343 and 373 K. ... 26 Table 11- Experimental conditions for the ZLC runs with 4A BFK 1.6 – 2.5 mm. ... 27 Table 12- Long time response and the complete ZLC model for CO2 in 4A BFK 1.6 – 2.5 mm zeolite at
303, 323, 343 and 373 K. ... 27 Table 13- Long time response and the complete ZLC model parameters for CH4 in 4A BFK 1.6 – 2.5 mm
zeolite at 308, 323, 343 and 373 K. ... 28 Table 14- Experimental conditions for the ZLC runs with 4A BFK 1.6 – 2.5 mm HSD. ... 29 Table 15- Long time response and the complete ZLC model parameters for CO2 in 4A BFK 1.6 – 2.5 mm
HSD zeolite at 303, 323, 343 and 373 K. ... 29 Table 16- Long time response and the complete ZLC model parameters for CH4 in 4A BFK 1.6 – 2.5 mm
HSD zeolite at 308, 323, 343 and 373 K. ... 30 Table 17- Diffusivity coeficient for CO2 in zeolites: 4A BFK 2.5 – 5.0 mm, 4A BFK 1.6 – 2.5 mm and 4A
BFK 1.6 – 2.5 mm HSD at different temperatures. ... 31 Table 18- Molecular and Knudsen diffusivity coefficients for the CO2/He mixture. ... 32
Table 19- Henry’s law constant and equilibrium constant for 4A zeolites. ... 33 Table 20- Diffusivity coeficient for CH4 in zeolites: 4A BFK 2.5 – 5.0 mm, 4A BFK 1.6 – 2.5 mm and 4A
BFK 1.6 – 2.5 mm HSD at different temperatures. ... 33 Table 21- Crystal diffusivity in 4A zeolites of CO2 and CH4. ... 35
Table 22- Experimental conditions for the ZLC runs with 13X BFK 1.2 – 2.0 mm. ... 36 Table 23- Long time response and the complete ZLC model parameters for CO2 adsorption in 13X BFK
1.2 – 2.0 mm zeolite at 308, 323, 343 and 373 K. ... 36 Table 24- Long time response and the complete ZLC model parameters for CH4 adsorption in 13X BFK
1.2 – 2.0 mm zeolite at 308, 323, 343 and 373 K. ... 37 Table 25- Experimental conditions for the ZLC runs with 13X BFK 6x8 mesh. ... 38 Table 26- Long time response and the complete ZLC model parameters for CO2 adsorption in 13X BFK
6x8 mesh zeolite at 308, 323, 343 and 373 K... 39 Table 27- Long time response and the complete ZLC model parameters for CH4 adsorption in 13X BFK
6x8 mesh zeolite at 308, 323, 343 and 373 K... 39 Table 28- Diffusivity coeficient for CO2 in zeolites: 13X BFK 1.2 – 2.0 mm, 13X BFK 6x8 mesh at
different temperatures. ... 40 Table 29- Molecular and Knudsen diffusivity coefficients for the CO2/He mixture. ... 40
Table 30- Henry’s law constant and equilibrium constant for 13X zeolites. ... 41 Table 31- Diffusivity coeficient for adsorption of CH4 in zeolites: 13X BFK 1.2 – 2.0 mm, 13X BFK 6x8
mesh at different temperatures. ... 42 Table 32- Molecular and Knudsen diffusivity coefficients for the CH4/He mixture. ... 42
Notation and Glossary
𝐶 instantaneous concentration mol m-3
𝐶0 initial gas phase concentration mol m-3
𝐷𝑎𝑝 apparent diffusivity cm2 s-1
𝐷𝑐 crystal diffusivity cm2 s-1
𝐷𝑐0 limiting diffusivity at infinite temperature cm2 s-1
𝐷𝑖𝑗 binary molecular diffusivity of component i and j cm2 s-1
𝐷𝑚 molecular diffusivity m2 s-1
𝐷𝑝 pore diffusivity cm2 s-1
𝐷𝐾 Knudsen diffusivity m2 s-1
𝐸𝑎 activation energy of micropore/crystal diffusivity kJ mol-1
𝐻 Henry’s constant mol kg-1 Pa-1
𝐽0, 𝐽1 Bessel functions
𝐾𝑒𝑞 dimensionless equilibrium constant
𝐾𝑖 adsorption constant or Langmuir constant of component i bar-1
𝐾𝑖0 adsorption constant at infinite temperature bar-1
𝑙 representative spatial dimension of the pellet m
𝐿 zero length column parameter
𝑚𝑠 adsorbent mass kg
𝑀𝑤 adsorbate molecular weight kg mol-1
n ZLC geometrical factor of the adsorbent
𝑃 pressure bar
𝑞𝑖 adsorbed amount of component i mol kg-1
𝑞𝑚,𝑖 maximum adsorption capacity of component i in the adsorbent mol kg-1
𝑄𝑝 purge flowrate m3 s-1
𝑟𝑐 crystal representative spatial dimension m
𝑅𝑔 universal gas constant J mol-1 K-1
𝑟𝑝 pore spatial dimension m
𝑇 temperature K
𝑉𝑐 volume of the permanent magnet, of the sample basket and the
glass wool used to hold the sample
m3
𝑉𝑠 volume of the solid adsorbent m3
Greek letters
𝛽𝑗 ZLC roots dependent of the adsorbent shape
(−∆𝐻) heat of adsorption kJ mol-1
(−∆𝐻)𝑖 isosteric heat of adsorption of component i kJ mol-1
∆𝑚 difference in weight between two measurements kg
e bed porosity
e
p porosity of the pellet𝜌𝑎𝑝 apparent density kg m-3
𝜌𝑔 density of the gas phase at the measuring conditions (T,P) kg m-3
𝜌𝐿 density of the adsorbed liquid phase kg m-3
𝜌𝑠,𝐻𝑔 density of the solid measured by mercury intrusion kg m-3
𝜌𝑠,𝐻𝑒 adsorbent density measured by helium pycnometry kg m-3
𝜎 collision molecular diameter 𝜏𝑝 tortuosity
Ω𝐷𝑖𝑗 dimensionless collision integral of the diffusivity
List of Acronyms
BFK Binder-Free molecular sieves EDS Energy Dispersive X-Ray FID Flame Ionization Detector GC Gas Chromatographer MFC Mass Flow Controller
SEM Scanning Electron Micrograph PT Pressure Transducer
TCD Thermal Condutivity Detector TT Temperature Transducer XRD X-Ray Diffraction
1 Introduction
1.1 Motivation and Relevance
Due to the increase of world population, industrialization and technology advancement the use of fossil fuel has released considerable amounts of greenhouse gases such as carbon dioxide which contributes up to 60% of the global warming effects [1].In order to limit the CO2 emissions and to decrease its content in natural gas, which is an energy source with expected consumption growth of 50% over the next 20 years [2], technologies to capture and storage carbon dioxide have been developed.
The existing techniques for CO2 separation from gas streams include advanced technologies such as wet scrubber, membranes, cryogenics, pressure and temperature swing adsorption [3]. Separation and purification of gas mixtures by adsorption has gain interest to chemical and petrochemical industries due to the low energy requirements and low capital investment costs [2].
The requirement for adequate adsorption capacity restricts the choice of adsorbents for practical separation processes. Zeolites, porous crystalline aluminosilicates, have different frameworks which allows the tailoring of adsorptive properties to achieve an aimed selectivity. In this study, Zeolites 4A and 13X will be tested with the purpose of evaluating the adsorption properties for carbon dioxide capture from flue gas streams, and sweetening of natural gas. In order to study the adsorbents, adsorption equilibrium and kinetic measurements ought to be made. Traditionally, these studies have been carried out by straightforward and accurate gravimetric or volumetric techniques. However, for kinetic measurements these may not be the most adequate methods [4]. As different transport mechanisms may occur in adsorbents, the interpretation of kinetic data can be difficult, therefore, in 1988, Eic and Ruthven, with the aim of measuring the micropore diffusion of zeolite crystals, developed the zero length column (ZLC) [5]. This chromatographic technique has been widely used for diffusivity measurements in zeolites and for measuring the diffusion in bimodal porous materials [6]. This method uses a small amount of adsorbent and low adsorbate concentrations.
To test the adsorbents, adsorption equilibrium data of CO2, CH4 and N2 was measured in a gravimetric suspension balance and adsorption kinetics of the same pure gases were measured by the zero length column technique.
1.2 Outline
The present work is divided in five chapters.
In Chapter 1 the relevance of the study of carbon dioxide separation from industrial streams is described. In order to perform such separation, the selected sieves are introduced in Chapter 2, with a brief history, description of the materials and some applications. Along with zeolites, in Chapter 2 is presented the zero length column technique used to perform kinetic studies, that has been developed by Brandani and by Silva and Rodrigues.
Chapter 3 describes the materials and methods. The theory and matematical aproach behind the adsorption equilibrium and the kinetics studied are presented and the experimental set-ups and procedures described.
Chapter 4 consists in experimental results which starts with the zeolites characterization, shows the adsorption equilibrium isotherms of each adsorbent, the diffusional coefficient and the diffusion controlling mechanism determination.
2 State of the art
2.1 Zeolites
The history of zeolites began in 1756 when Cronstedt, a mineralogist, discovered the first zeolite mineral, stilbite. He called it a ‘’zeolite’’ which derived from two Greek words, zeo (to boil) and lithos (a stone). In 1940s, Milton developed a method to synthesize zeolites through hydrothermal crystallization of reactive alkali metal aluminosilicates gels at high pH and low temperatures and pressures. Since the late 1940s the Milton’s concept has been followed by several addictions and modifications[7].
Although there is no systematic nomenclature, the early synthetic materials discovered by Milton, Breck and coworkers at Union Carbide used the modern Latin alphabet, such as zeolites A, B, X, Y, to name the materials. Nowadays, the International Zeolite Association publishes and frequently updates the Atlas of Zeolite Structure Types where it assigns a three letter code to be used for a known framework topology irrespective of composition [7].
These molecular sieves are crystalline inorganic polymers based on an infinitely extending three-dimensional framework, four-connected framework of AlO4 and SiO4 tetrahedra linked by the oxygen ions. The framework bears a negative charge which is neutralised by an extra-framework cation from elements of group I or II such as sodium, potassium and calcium. The structure of the framework allows intracrystalline channels to be occupied by cations, which are mobile and may undergo ion exchange, and by water molecules [7]. Commercial molecular sieve zeolite crystals have typically 1 to 10 µm, and in order to prepare a practically useful adsorbent these crystals are converted into shaped materials, such as pellets or beads [5]. In the past decades, applications of zeolites showed a particularly growth in petroleum refining with emphasis on resid cracking and octane enhancement. The use of these molecular sieves in detergents as a replacement for phosphates became the single largest volume use for synthetic zeolites worldwide. In terms of ion exchange products, zeolites were used widely in nuclear waste clean-up after the Three Mile Island and Chernobyl nuclear accidents. Applications in adsorption and separation have been having a major growth in pressure swing adsorption processes such as in purification of hydrogen [8], purifications of biogas [9], CO2 sequestration [10] and propylene/propane separation [11], and more recently, application in removal of and recovery of volatile organic compounds[7].
2.2 Zero Length Column
The zero length column (ZLC) was introduced in 1988 by Eic and Ruthven with the objective of measuring diffusivities of hydrocarbons in zeolites. Prior to this invention, the Wicke-Kallenbach method was used to measure intracrystalline and macropore diffusivities, it depended on a steady-state measurement and it was not affected by finite heat transfer [12]. However, for micropore diffusivity calculation this method demanded a single crystal with regular large size, which was not feasible. Inverse chromatography was also an alternative that allowed a dynamic response of a packed column to a change in adsorbate concentration, with the disadvantage of being difficult to separate the effect of diffusion and axial dispersion by a single experiment [12].
The ZLC technique has the advantage of elimination of external mass and heat transfer resistances by the use of low adsorbate concentration, small amount of adsorbent sample and the use of high carrier flow rates during desorption.
In 1993, this study was extended to the measurement of diffusivities in pellets by Ruthven and Xu [13]. In 1996, a complete model which includes macropore and micropore diffusion in pellets applied to ZLC technique has been developed by Brandani [14], and by Silva and Rodrigues [15] who also suggested logarithms for data treatment.
3 Material and Methods
3.1 Materials used
3.1.1 Adsorbent
The adsorbents studied were 4A BFK zeolites with two particle diameters 1.6 - 2.5 mm and 2.5 -5.0 mm and a 4A BFK zeolite denominated high density with 1.6 - 2.5 mm diameter range, and 13X BFK zeolite also with two particle diameters 1.2 - 2.0 mm and 6x8 mesh which corresponds to 2.36 - 3.35 mm, in form of granulates, provided by KÖstrolith.
Figure 2- Zeolite: a) 4A BFK 2.5-5.0 mm; b) 4A BFK 1.6-2.5 mm; c) 4A BFK HSD 1.6-2.5 mm; d) 13X BFK 1.2-2.0 mm; e) 13X BFK 6x8 mesh.
All the studied adsorbents are classified as binder-free molecular sieves (BFK) as a result of a new synthesis pathway that has been developed to compensate the fact that in the synthesis of shaped LTA (A) and FAU (X) type zeolites is normally used 80-82 wt % of a zeolite powder and 20-18 wt % of binders that despite providing a specific shape and mechanical strength, reduces the adsorption capacity of the material. Therefore, it is expected that the tested molecular sieves have an adsorption capacity comparable to pure zeolites of the same structural types[16].
The structure of zeolite LTA (A) is shown in Figure 3 (a) and reveals eight cages located in the corners of a cube connected through four-membered oxygen rings. Each pseudo cell contains 24 tetrahedral units and since the Si/Al ratio in this zeolite is always close to 1.0 there are 12 univalent exchangeable cations per cell. As the tested zeolite is a 4A, there are 12 sodium cations per cage[12].
The structure of zeolite FAU (X) is also shown in Figure 3 (b) and the crystallographic unit cell consists of an array with eight cages containing a total of 192 tetrahedral units. The Si/Al ratio is within the range of 1-1.5 and the exchangeable univalent cations varies, being between 10-12 per cage[12].
Figure 3- (a) Crystal structure of type A zeolite. (b) Crystal structure of type X zeolite [17]. Silicon atoms are teal, red atoms are oxygen and the orange spheres fill the voids of the
sodalite cages
The materials were characterized by mercury porosimetry and nitrogen adsorption isotherms at 77 K as well as carbon dioxide adsorption isotherms at 273 K performed at Málaga University, scanning electron micrograph (SEM) at the Centro de Materiais da Univerdade do Porto (CEMUP) and X-ray Diffraction (XRD) was performed in Universidade de Aveiro.
3.1.2 Gases
The adsorption properties of carbon dioxide (CO2), methane (CH4) and nitrogen (N2) in the different zeolite samples were determined using gases provided by Air Liquide with the following specifications: carbon dioxide N48, methane N35 and nitrogen N45, which means purity greater than 99.998, 99.95 and 99.995%, respectively.
For adsorbent activation and regeneration, it was used Helium (He) with 99.999% purity, also provided by Air liquid.
3.2 Methods
3.2.1 Adsorption equilibrium
For separation processes it is necessary to know the interactions between adsorbates (fluid) and the adsorbent (solid) since different bonds involve different energies. For processes where adsorption and desorption are involved, the main focus is in the reversibility achieved by a change of operating conditions as temperature or pressure. As a spontaneous phenomenon, adsorption equilibrium releases heat and despite being a dynamic process after a certain amount of time it achieves equilibrium state.
In 1918, Langmuir gave the first coherent theory of adsorption as a dynamic equilibrium with equal rates of adsorption and desorption. This model assumes that the surface is energetically homogeneous, that there’s no interaction between adsorbed molecules and that each site has the same probability of adsorbing, being able to accommodate only one molecule.
The Langmuir equation is:
𝑞𝑖 = 𝑞𝑚,𝑖 𝐾𝑖𝑃
1+𝐾𝑖𝑃 (Equation 1)
where 𝑞𝑖 is the adsorbed amount of the component i, 𝑞𝑚,𝑖 is the maximum adsorption capacity
of the adsorbent (only considering monolayer adsorption) of component i, 𝐾𝑖 is the adsorption constant for component i and P is the pressure. The adsorption constant also known as the Langmuir constant is expressed by the Van´t Hoff equation:
𝐾𝑖 = 𝐾𝑖0𝑒 (−∆𝐻
𝑅𝑔𝑇) (Equation 2)
where 𝐾𝑖0 is the adsorption constant at infinite temperature, (−∆𝐻) is the heat of adsorption
on the homogeneous surface, 𝑅𝑔 is the universal gas constant and 𝑇 is the temperature of the system.
Under high values of pressure the term 𝐾𝑖𝑃 ≫ 1 and so the Langmuir isotherm reduces to 𝑞𝑖 =
𝑞𝑚,𝑖, which means the capacity saturation of the adsorbent is complete. For low values of
pressure the term 𝐾𝑖𝑃 ≪ 1 reducing the equation to the linear isotherm: 𝑞𝑖
𝑞𝑚,𝑖 = 𝐾𝑖𝑃.
3.2.2 Adsorption equilibrium experimental
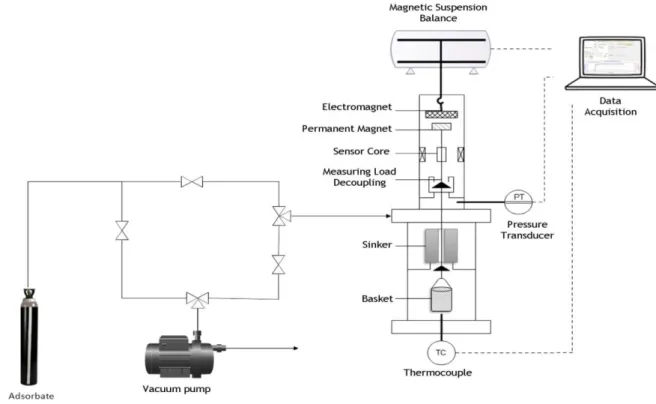
In order to measure the adsorption equilibrium isotherms of CO2, CH4 and N2 a magnetic suspension microbalance (Rubotherm, Germany), with a precision of 0.01 mg, was used (Figure 4). The schematic diagram of the experimental set-up is shown in Figure 5. The balance is connected to a three port valve, a thermocouple for temperature monitoring, one pressure transducer to measure the pressure inside the cell and a vacuum pump used for sample activation and cell depressurization. To control the temperature, an electric resistence was used. The system control and data acquisition is done by a Rubothermsoftware.
Figure 4- a) Magnetic suspension microbalance (Rubotherm, Germany); b) Acquisition system of the magnetic microbalance.
The adsorbent sample is weighed and placed in a basket linked to a permanent magnet. The permanent magnet interacts with the electromagnet (magnetic suspension coupling) allowing
the measurement of the weight variations inside the cell which is recorded in a computer. Before the experiments with the gases under study, the adsorbent was activated at 573 K under vacuum until no mass loss was observed. To achieve the activation temperature a heating rate of 1 K/min was used.
Figure 5- Schematic diagram of the experimental set-up for adsorption equilibrium measurements.
The measurements were performed for CO2, CH4 and N2 at 303, 343 and 373 K up to 9 bar. In all experiments, the values obtained corresponded to the excess adsorbed phase concentration and in order to correct the buoyancy effect two helium pycnometries were made assuming that helium is not adsorbed, one with the adsorbent and the other without (Appendix 1). Employing the buoyancy correction, the final equation to calculate the absolute amount adsorbed from the experimental data is:
𝑞 =∆𝑚+ 𝜌𝐺(𝑉𝑠+𝑉𝐶) 𝑚𝑠𝑀𝑤
𝜌𝐿
𝜌𝐿−𝜌𝐺 (Equation 3)
where ∆𝑚 is the difference of weight between measurements, 𝜌𝐺 is the density of the gas phase
at the measuring conditions (T,P), 𝑉𝑠 is the volume of the solid adsorbent, 𝑉𝐶 is the volume of
the permanent magnet, the sample basket and the glass wool used to hold the sample, 𝑚𝑆 is
the adsorbent mass, 𝑀𝑤 the adsorbate molecular weight and 𝜌𝐿 the density of the adsorbed
The system monitories the pressure, the temperature and the weight variations. In order to obtain one experimental point of the adsorption isotherm, a small amount of gas is added to the cell containing the adsorbent sample and when the change in weight is approximately zero equilibrium has been reached. Then, another small amount of gas is added to the cell and another point is determined. This procedure is repeated until the highest desired pressure is achieved. After that, desorption points of the isotherm are obtained with progressive depressurization.
3.2.3 Zero Length Column
In order to obtain the diffusion coefficients of carbon dioxide, methane and nitrogen, zero length column tests were performed with the experimental set-up shown in Figure 6 and shematically represented in Figure 7.
Figure 6- Varian gas chromatography (Varian, Holland).
The adsorbate was prepared by diluting a determined amount of pure gas in helium. For that, a mixture bottle was first cleaned. Using a vacuum pump, the bottle was initially cleaned by removing any existing gas. Then helium was injected and vacuum was again applied to remove any remaining impurities. A sampling tank of known volume was connected to the pure adsorbate bottle and filled up to a desired pressure. Then, the sampling tank was connected to the mixture bottle and the pure gas was pushed into the mixing bottle by passing helium until a total desired pressure was achieved.
The adsorbent was placed in the ZLC cell inside the gas chromatograph which allows experiments up to 673 K. The outlet stream was connected to a thermal conductivity detector (TCD) where the concentration of the gas was measured and then to a flame ionization detector (FID), which also ensures that emissions to the laboratory environment are avoided. Prior to
the ZLC cell exists a multiport valve to switch the inlet stream from mixture (helium plus adsorbate) for saturation and pure helium for desorption. After the saturation of the column the run started by switching to a pure helium stream at time zero. The concentration of the adsorbate is followed continuously for enough time to ensure complete desorption of the sample.
ZLC experiments of CO2, CH4 and N2 were performed at 308, 323, 343 and 373 K.
Figure 7- Zero length column experimental set-up.
In all experiments the mixture had 0.5% of the adsorbate diluted in helium so that the velocity variations within the column were reduced, the processed occurred under isothermal conditions and, above all, the measurements are carried out in the linear zone of the adsorption isotherm. The activation of the adsorbents was performed at 573 K at a heating rate of 1 K/min under a flow of Helium.
Therefore, considering that the homogeneous equation and the Fick’s law of diffusion can be applied to the kinetic measurements of a sorbate in an extrudate, the mass transfer control is limited either by macropore or micropore diffusion, and that the used sorbate concentration is low enough to describe adsorption equilibrium by Henry law, solution for infinite slabs, infinite cylinders and spheres were obtained [5]:
𝐶 𝐶0= 2𝐿 ∑ exp (−𝐷𝑎𝑝𝛽𝑗2𝑡 𝑙2 ) 𝛽𝑗2+𝐿(𝐿+1−𝑛) ∞ 𝑗=1 (Equation 4)
Where 𝑛 is equal to 0, 1 or 2 for slabs, cylinders and spheres respectively, 𝐶 and 𝐶0 are the
instantaneous and initial gas phase concentration respectively, 𝐷𝑎𝑝 is the apparent diffusivity,
𝑙 is the representative spatial dimension of the pellet (radius for spheres and infinite cylinders and half length for infinite slabs), 𝐿 is the ZLC parameter (Equation 5) and 𝛽𝑗 the roots obtained
from the transcendental equations (Equation 6). 𝐿 =(𝑛+1)𝐾𝑄𝑝𝑙∗2
where 𝑄𝑝 is the purge flowrate, 𝑉𝑠 is the volume of the adsorbent in the cell, 𝐾∗= 𝜀
𝑝+ (1 −
𝜀𝑝)𝐾𝑒𝑞 where 𝜀𝑝 is the porosity of the pellet and 𝐾𝑒𝑞 = 𝜌𝑠𝐻𝑅𝑔𝑇 where 𝜌𝑠 is the density of the
solid and 𝐻 the Henry constant.
Slabs Cylinder Spheres
𝛽𝑗tan(𝛽𝑗) − 𝐿 = 0 𝛽𝑛𝐽1(𝛽𝑛) − 𝐿𝐽0(𝛽𝑛) = 0 𝛽𝑗cot(𝛽𝑗) + 𝐿 − 1 = 0 (Equation 6)
where 𝐽0 and 𝐽1 are Bessel functions of first kind of order zero and one respectively.
For the case of micropore control the 𝐷𝑎𝑝⁄𝑙2 has to be replaced by the crystal diffusivity and
the spatial coordinate is the crystal representative spatial dimension (𝐷𝑐⁄𝑟𝑐2). For the case of
macropore control the pore diffusivity (𝐷𝑝) is calculated throught Equation 7. 𝐷𝑎𝑝=
𝜀𝑝𝐷𝑝
𝜀𝑝+(1−𝜀𝑝)𝐾𝑒𝑞 (Equation 7)
The long time response (LTR) for spherical pellets assuming linear adsorption equilibrium model is: ln (𝐶𝐶 0) ≅ 𝑙𝑛 ( 2𝐿 𝛽12+𝐿(𝐿+1−𝑛)) − 𝛽12𝐷𝑎𝑝𝑡 𝑙2 (Equation 8)
The pore diffusivity (𝐷𝑝) is related with the interaction of the adsorbate molecules with the
pore walls (𝐷𝑘) and the interaction between molecules (𝐷𝑚). The Equation of Bosanquet (Equation 9) translates this relation, where 𝜏𝑝 is the tortuosity.
1 𝐷𝑝= 𝜏𝑝( 1 𝐷𝑚+ 1 𝐷𝑘) (Equation 9)
4 Results and Discussion
4.1 Zeolites characterization
To characterize the materials, and therefore obtain useful information for adsorption equilibrium and adsorption kinetics properties, several properties must be known. The N2 and CO2 physisorption isotherms measured at 77 K and 273 K, respectively, and mercury intrusion were performed at the Universidad de Málaga. Additionally, Scanning Electron Micrograph (SEM) and Energy Dispersive X-ray were performed at the Centro de Materiais da Universidade do Porto; and X-ray Diffraction (XRD) was performed in Universidade de Aveiro.
4.1.1 Zeolite 4A
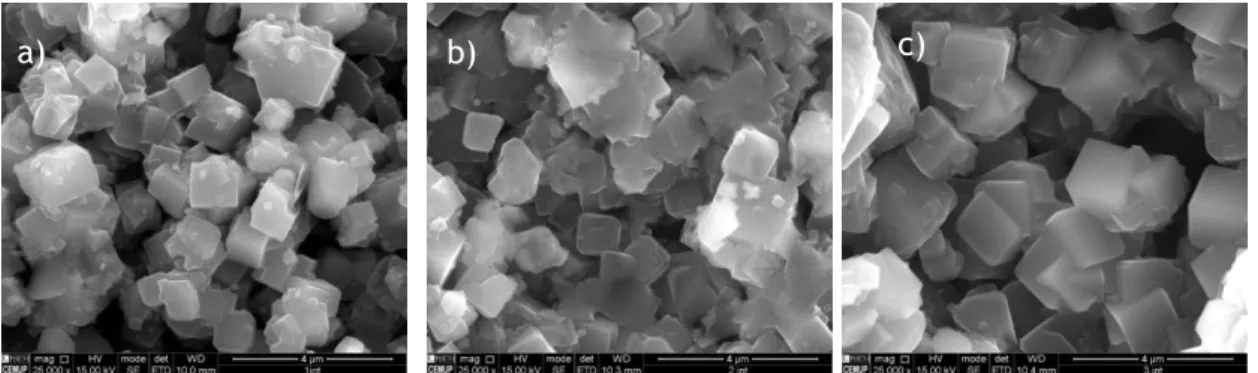
SEM images of the 4A zeolite samples are presented in Figure 8 and in Appendix 3. Crystals with an average size of 1 µm can be observed. The characteristic cubic shape of the 4A zeolite crystals is observed for the three samples. However, some intergrowth of the crystals is also visible for the three samples. From the EDS spectra the expected elements were found (O, Na, Al, Si).
Figure 8- SEM images of zeolites: a) 4A BFK 2.5-5.0 mm, b) 4A BFK 1.6-2.5 mm, c) 4A BFK HSD 1.6-2.5 mm.
The pore size distribution obtained by mercury intrusion in the studied zeolite samples are presented in Figure 9.
Figure 9- Pore size distribution by mercury intrusion of zeolite 4A. b)
From the mercury intrusion it can be concluded that all the samples have similar pore distribution and average pore diameter. The high density sample has the higher apparent and bulk density at 0.035 mPa standing out in Figure 9 due to the lower volume of pores.
A summary of the main measured properties assessed by mercury intrusion is presented in Table 1. The pellet density (apparent density, 𝜌𝑎𝑝 = 𝑚𝑎𝑠𝑠 𝑝𝑒𝑙𝑙𝑒𝑡 𝑣𝑜𝑙𝑢𝑚𝑒⁄ ) and the apparent solid density (𝜌𝑠,𝐻𝑔= 𝑚𝑎𝑠𝑠 (𝑝𝑒𝑙𝑙𝑒𝑡 𝑣𝑜𝑙𝑢𝑚𝑒 −⁄ macro/𝑚𝑒𝑠𝑜 𝑝𝑜𝑟𝑒 𝑣𝑜𝑙𝑢𝑚𝑒)) obtained by mercury
intrusion are given as well as the solid density (𝜌𝑠,𝐻𝑒 = mass solid volume⁄ ) obtained by helium picnometry (Appendix 1).
Table 1- Total intrusion volume, surface area, average pore diameter, apparent and solid density obtained from mercury intrusion and solid density obtained form helium picnometry
in the 4A zeolites. 4A BFK 2.5-5.0 mm 4A BFK 1.6-2.5 mm 4A BFK HSD 1.6-2.5 mm
Total Intrusion Volume cm³ g-1 0.3012 0.3147 0.1606
Surface Area m2 g-1 3.837 3.491 2.004
Average Pore Diameter nm 314.0 360.5 320.0
Pellet Density kg m-3 1091 1109 1406
Apparent Solid Density kg m-3 1624 1707 1819
Solid Density kg m-3 2063 2429 1667
The adsorption isotherm of Nitrogen at 77 K and of Carbon Dioxide at 273 K are presented in Figure 10 and the surface area data is summarized in the Table 2.
Figure 10- Adsorption isotherms in Zeolites 4A of Nitrogen at 77 K (a) and of Carbon Dioxide at 273 K (b). 0 2 4 6 8 0 0.5 1 1.5 Q u ant it y ad so rbed (cm ³/g STP) P/P0 4A 2.5-5 mm 4 A 1.6-2.5 HSD 4A 1.6 - 2.5 mm 0 30 60 90 120 0 0.02 0.04 Q u ant it y Ad so rbed (cm ³/g STP) P/P0 4A 2.5-5.0 mm 4A 1.6-2.5 mm HSD 4A 1.6-2.5 mm a) b)
As the diffusion of Nitrogen at 77 K in zeolite 4A is kinetically restricted, it is not possible to obtain meaningful physical values through this procedure. From the adsorption of Carbon Dioxide at 273 K, as the temperature is higher and therefore the kinetic energy of the molecules is greater, the diffusion into the narrow pores is speeded up allowing the determination of the surface area presented in Table 2. As the quantity adsorbed reaches a maximum for relative pressures below 0.04 it can be concluded that the adsorption only happens in the crystals.
Table 2- Surface area of zeolite 4A BFK 2.5-5.0 mm obtained from physisorption isotherms of Nitrogen at 77 K and Carbon Dioxide at 273 K.
4A BFK 2.5-5.0 mm 4A BFK 1.6-2.5 mm 4A BFK HSD 1.6-2.5 mm Surface Area m2 g-1 510.4 501.4 509.8
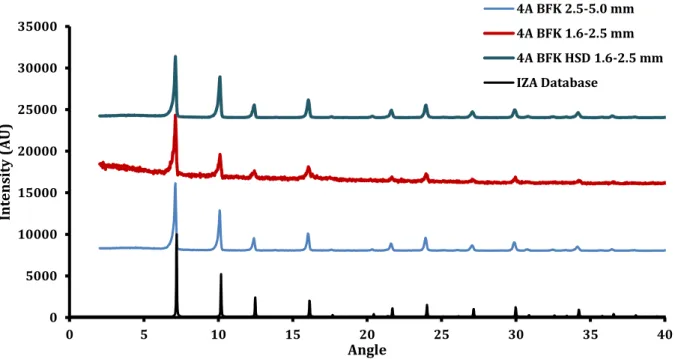
The X-Ray diffraction results of the 4A zeolites studied as well as the one obtained from the International Zeolite Association (IZA) [18] is represented in Figure 11. A good match can be found.
Figure 11- X-Ray diffraction data of the 4A zeolite samples.
0 5000 10000 15000 20000 25000 30000 35000 0 5 10 15 20 25 30 35 40 Int ens it y (AU) Angle 4A BFK 2.5-5.0 mm 4A BFK 1.6-2.5 mm 4A BFK HSD 1.6-2.5 mm IZA Database
4.1.2 Zeolite 13X
SEM images of the zeolite are presented in Figure 12 and in Appendix 3. The shape of the crystals is not regular. From the EDS spectra the expected elements were found (O, Na, Al, Si).
Figure 12- SEM images of zeolites: a) 13X BFK 1.2-2.0 mm, b) 13X BFK 6x8 mesh (2.36-3.35 mm).
The results of the pore size distribution are presented in Figure 13.
Figure 13- Pore size distribution by mercury intrusion of zeolites: a) 13X BFK 1.2 - 2.0 mm, b) 13X BFK 6x8 mesh (2.36-3.35 mm).
From the Figure 13 it can be concluded that both samples have similar average pore diameter. The sample with smaller pellets stands out due to the lower volume of pores.
The results from mercury intrusion are presented in Table 3. The pellet density (apparent density, 𝜌𝑎𝑝= 𝑚𝑎𝑠𝑠 𝑝𝑒𝑙𝑙𝑒𝑡 𝑣𝑜𝑙𝑢𝑚𝑒⁄ ) and the apparent solid density (𝜌𝑠,𝐻𝑔=
𝑚𝑎𝑠𝑠 (𝑝𝑒𝑙𝑙𝑒𝑡 𝑣𝑜𝑙𝑢𝑚𝑒 −⁄ macro/𝑚𝑒𝑠𝑜 𝑝𝑜𝑟𝑒 𝑣𝑜𝑙𝑢𝑚𝑒)) obtained by mercury intrusion are given as well as the solid density (𝜌𝑠,𝐻𝑒= mass solid volume⁄ ) obtained by helium picnometry (Appendix 1).
Table 3- Total intrusion volume, surface area, average pore diameter, apparent and solid density obtained from mercury intrusion and solid density obtained form helium picnometry
in the 13X zeolites. 13X BFK 1.2 - 2.0 mm
13X BFK
6x8 mesh (2.36-3.35 mm)
Total Intrusion Volume cm³ g-1 0.2295 0.2964
Surface Area m2 g-1 6.509 9.099
Average Pore Diameter nm 141.0 130.3
Pellet Density kg m-3 1117 1036
Apparent Solid Density kg m-3 1502 1495
Solid Density kg m-3 - 2025
The 13X zeolites show higher surface areas and lower densities in comparison to 4A zeolites. The adsorption isotherm of Nitrogen at 77 K and of Carbon Dioxide at 273 K are presented in Figure 14 and the obtained properties are sumarized in the Table 4.
Figure 14- Adsorption isotherms in Zeolite 13X BFK of Nitrogen at 77 K (a) and of Carbon Dioxide at 273 K (b).
Table 4- Surface area of zeolite 13X BFK of Nitrogen 77 K and Carbon Dioxide at 273 K. Surface Area m2 g-1 13X BFK 1.2-2.0 mm 13X BFK 6x8 mesh (2.36-3.35 mm)
N2 at 77 K 875.2 ± 0.5 864.4 ± 0.6
From both Nitrogen at 77 K and Carbon Dioxide at 273 K adsorption isotherms it can be concluded that the 13X zeolite samples have similar surface areas and, as the 4A samples, the quantity adsorbed reaches a maximum for relative pressures below 0.04 which allows to reach the conclusion that the adsorption also happens only in the crystals.
Figure 15- X-Ray diffraction data of the 13X zeolite samples.
The X-Ray diffraction of the 13X zeolites, represented in Figure 15, matches the one provided by the International Zeolite Association.
0 5000 10000 15000 20000 25000 30000 35000 40000 45000 0 5 10 15 20 25 30 35 40 Int ens it y (AU) Angle 13X 1.2-2.0 mm 13X 6x8 mesh IZA Database
4.2 Adsorption equilibrium isotherms
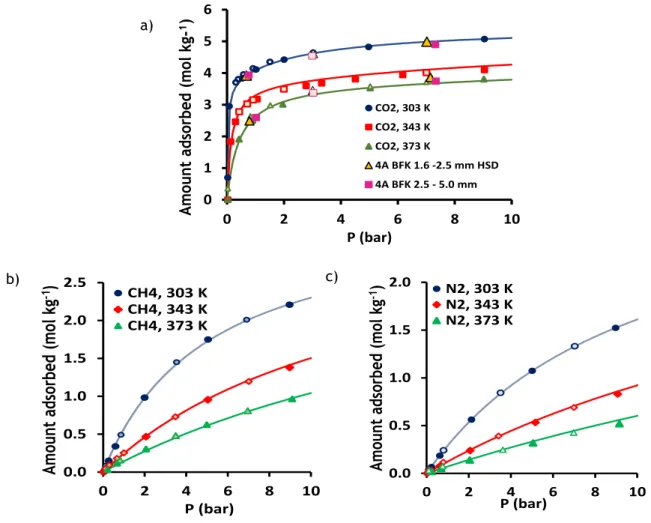
Adsorption equilibrium of CO2, CH4 and N2 on zeolite 4A BFK 1.6-2.5 mm was determined at 303, 343 and 373 K in the pressure range of 0 to 9 bar. Some points were also measured for the other 4A samples. The experimental results as well as adsorption isotherm model fittings (as described below) are presented in Figure 16. The 4A BFK 2.5-5.0 mm and 4A BFK 1.6-2.5 mm zeolites interactions with the adsorbate were equally well described by the model determined for the 4A BFK 1.6-2.5mm zeolite which was expected since the three samples have the same type of crystals. In Appendix 4 the isotherms of the different samples in terms of the amount adsorbed per mass and volume are presented in more detail. Figure 17 shows a comparison of the adsorption isotherms of amount adsorbed per volume of adsorbent for CO2 where it can be clearly seen that in terms of capacity by volume the 4A BFK HSD is significantly better. A gain of 29% is observed. The advantagens of this material in terms of adsortion capacity are evident, significantly smaller equipement can be used.
Figure 16- Amount of a) CO2, b) CH4 and c) N2 adsorbed on 4A 1.6-2.5 mm zeolite:
experimental points (closed adsorption, open desorption) at 303, 343, 373 K and Dual site
Langmuir fiiting for CO2 and One site Langmuir for CH4 and N2 (lines).
0 1 2 3 4 5 6 0 2 4 6 8 10 Am oun t ads orb ed (mol kg -¹) P (bar) CO2, 303 K CO2, 343 K CO2, 373 K 4A BFK 1.6 -2.5 mm HSD 4A BFK 2.5 - 5.0 mm a) 0.0 0.5 1.0 1.5 2.0 0 2 4 6 8 10 Amo un t adso rbe d (mo l kg -1) P (bar) N2, 303 K N2, 343 K N2, 373 K 0.0 0.5 1.0 1.5 2.0 2.5 0 2 4 6 8 10 Amou nt ads orb ed (mol kg -1) P (bar) CH4, 303 K CH4, 343 K CH4, 373 K b) c)
Figure 17- Comparison between the adsorption capacities per volume of adsorbent of CO2 in
4A zeolites at 303 K.
As some equilibrium points were determined in adsorption (closed symbols) and others with desorption (open symbols) it was possible to conclued that inside the experimental error the sample has not shown hysteresis for any adsorbate at the three different temperatures. 𝑞𝑖 = 𝑞𝑚1,𝑖
𝐾1,𝑖𝑃
1+𝐾1,𝑖𝑃+ 𝑞𝑚2,𝑖 𝐾2,𝑖𝑃
1+𝐾2,𝑖𝑃 (Equation 10)
The carbon dioxide results were fitted with Equation 10 (Dual-site Langmuir). The parameters 𝑞𝑚1,𝑖, 𝑞𝑚2,𝑖, 𝐾1,𝑖0, 𝐾2,𝑖0, (−∆𝐻)1 and (−∆𝐻)2 for the carbon dioxide fitting and the 𝑞𝑚,𝑖, 𝐾𝑖0 and
the (−∆𝐻) for methane and nitrogen were obtained by minimizing the sum of the absolute error between the experimental and calculated values. For the other adsorbates a Single site Langmuir proved to be sufficient. A good fitting was achieved.
The isotherm parameters are given in Table 5.
Table 5- Fitting parameters of the Langmuir model for CO2, CH4 and N2 adsorption
equilibrium on 4A BFK 1.6-2.5 mm.
Species 𝐪𝐦 (mol kg-1) 𝐊𝐢𝟎 (bar-1) (−∆𝐇) (kJ mol
-1) CO2 𝐪𝐦𝟏 𝐪𝐦𝟐 𝐊𝟏,𝐢𝟎 𝐊𝟐,𝐢𝟎 (−∆𝐇)𝟏 (−∆𝐇)𝟐 1.81 3.68 2.01 x 10⁻⁸ 1.7581 x 10⁻⁵ 42.3 36.6 CH4 3.47 5.88 x 10⁻⁵ 20.5 N2 3.24 3.98 x 10⁻⁵ 19.7
0
2000
4000
6000
8000
0
2
4
6
8
10
Am
oun
t
ads
orb
ed
(mol
m
-³)
P (bar)
4A 2.5 - 5,0 mm
4A 1.5 - 2.5 mm
4A 1.5 - 2.5 mm HSD
In terms of amount adsorbed, CO2 is the most adsorbed gas in the 4A zeolites studied and N2 the less adsorbed. The value of the heat of adsorption is higher for CO2 and smaller for N2. In a previous study [19] performed in LSRE, adsorption isotherms of CO2 and CH4 on the binderless 13X zeolite 1.2 – 2.0 mm had already been measured. In this work, some equilibrium points were measured on the other sample under study in order to compare the results. In Appendix 4, a comparison between the fitted model of the previous work and the poinst determined in this study is made. It can be seen that a good agreement is obtained. The adsorption equilibrium isotherms of N2 in 13X BFK 6x8 mesh was then determined at 303, 343 and 373 K in the pressure range of 0 to 9 bar. The results are presented in Figure 18.
The nitrogen results were fitted with Equation 1 (Langmuir One-site). The 𝑞𝑚,𝑖, 𝐾𝑖0 and the
(−∆𝐻) were obtained by minimizing the sum of the absolute error between the experimental and calculated values.
The isoterm parameters are given in Table 6.
Table 6- Fitting parameters of the Langmuir model for N2 adsorption equilibrium on 13X BFK
6x8 mesh.
Species 𝐪𝐦 (mol kg-1) 𝐊𝐢𝟎 (bar-1) (−∆𝐇) (kJ mol-1)
N2 4.10 8.61 x 10⁻⁵ 17.7
Figure 18- Adsorption equilibrium isoterms of N2 on 13X BFK 6x8 mesh zeolite: experimental
points (closed adsorption, open desorption) at 303, 343, 373 K and One site Langmuir (lines). A good fitting was achieved. In terms of amount adsorbed, CO2 is the most adsorbed gas in the 13X zeolites studied and N2 the less adsorbed. The heat of adsorption is also higher for the CO2 and smaller for N2.
0.0
0.4
0.8
1.2
1.6
2.0
0
2
4
6
8
10
Am
ou
nt
ads
orbe
d
(m
ol
kg
-1)
P (bar)
N2, 303 K
N2, 343 K
N2, 373 K
4.3 Isosteric heat of adsorption
The isosteric heat of adsorption determines the extent of adsorbent temperature changes within the adsorber during the adsorption and desorption steps of the processes [20]. It can be estimated by the Clausius-Clapeyron equation:
(−∆𝐻𝑖) = 𝑅𝑔𝑇2(𝜕𝑙𝑛𝑃𝑖
𝜕𝑇 )𝑞 (Equation 11)
where ∆𝐻𝑖 is the isosteric heat of adsorption of componente i, 𝑅𝑔 is the universal gas constant and 𝑇 is the temperature of the system. The derivative is evaluated at constant amount adsorbed, 𝑞. From the slope of the plot of 𝑙𝑛𝑃𝑖 as a function of 1/𝑇 the isosteric heat of
adsorption can be estimated.
Figure 19 shows the single component isosteric heats of adsorption on 4A BFK 1.6-2.5 mm zeolite as a function of the amount adsorbed as well as the heat of adsorption obtained from the Langmuir isotherm model.
Figure 19- Single-component isosteric heats of adsorption on 4A BFK 1.6-2.5 mm for CO2, CH4
and N2 as function of the amount adsorbed in the temperature range of 303 – 373 K; Lines are
the values obtained through the Langmuir fitting.
In the literature, values of the isosteric heat of adsorption in 4A zeolite of 47.8 kJ mol-1 for the adsorption of CO2 [21], 23.8 kJ mol-1 for N2 and 16.72 kJ mol-1 for CH4 [22] were found. Comparing the heats of adsorption of this material with the values reported in literature it can be concluded that in the case of CO2 and N2 the values in the present work are slightly lower and slightly higher for CH4.
15 20 25 30 35 40 45 0.0 1.0 2.0 3.0 4.0 Is oste ric heat o f a dso rpt ion (k J mol ˉ¹ )
Amount adsorbed (mol kgˉ¹)
CO2 CH4 N2
Figure 20 shows the single component isosteric heats of adsorption on 13X BFK 6x8 mesh zeolite as a function of the amount adsorbed as well as the heat of adsorption obtained from the Langmuir isotherm model.
Figure 20- Single-component isosteric heat of adsorption on 13X BFK 6x8 mesh for N2 as function of the amount adsorbed in the temperature range of 303 – 373 K; Lines are the values obtained through the Langmuir fitting.
Comparing the heats of adsorption of N2 in this material with values reported in literature (15.7 kJ mol-1) it can be concluded that the values in the present work are higher which indicates a stronger adsorption of this gas [2].
0 5 10 15 20 0.0 0.1 0.2 0.3 0.4 0.5 0.6 0.7 Is oste ric heat o f a dso rpt ion (k J mo l -1)
Amount adsorbed (mol kg-1)
4.4 Adsorption kinetics
In order to determine the diffusion control mechanism and the diffusivity coefficients, of carbon dioxide, methane and nitrogen in 4A and 13X zeolites, several experiments with different flow rates and at different temperatures were performed. A thermal condutivity detector was used to detect CO2 and N2 and a flame ionization detector was used to detect CH4, due to the highest sensitivity offered. The temperatures studied were 308, 323, 343 and 373 K.
Nitrogen desorption could not be analysed by this technique because the decrease in concentration dropped from the saturation value to zero almost instantaneously.
In order to determine the diffusivity coefficient of the adsorption of CO2 and CH4, the parameters 𝐷𝑎𝑝/𝑙2, 𝐾∗ and 𝛽 were calculated through the long time response (LTR) using the fact that 𝛽 should be approximatly equal to 𝜋 for spheres and, analysing the fitting to the complete model (TS). Using the long time response results, as a first estimate for the complete model, another set of parameters were determinated.
The calibration of the flow rates and the caracteristics of the ZLC columns are presented in Appendix 5 and 6, respectively.
Table 7- Flow rate of the experiments at different temperatures (at the experimental conditions).
Temperature (K) Flow rate x 107 (m3 s-1)
CO2 CH4
308 5.28 6.58
323 5.54 6.90
343 5.88 9.84
373 6.39 10.70
4.4.1 4A BFK 2.5-5.0 mm
The experimental conditions used in the ZLC measurements of CO2 and CH4 in 4A BFK 2.5-5.0 mm are reported in Table 8. The ZLC results for CO2 at each temperature and at 4.68 x 10⁻⁷ m3 s-1 flow rate (PTN conditions) are shown in Figure 21. The ZLC results for CH
4 at 5.83 x 10⁻⁷ m3 s-1 (PTN conditions) for experiments at 308 and 323 K and 7.83 x 10⁻⁷ m3 s-1 (PTN conditions) for experiments at 343 and 373 K are shown in Figure 22. The flow rate at the conditions of the experiment can be found in Table 7.
Table 8- Experimental conditions for the ZLC runs with 4A BFK 2.5 – 5.0 mm.
Adsorbate CO2 CH4
Adsorbate partial pressure (bar) 0.005
Mass of adsorbent x 103 (kg) 0.0685 Cell height x 102 (m) 0.89 Cell volume x 107 (m3) 1.18 Cell porosity, ε 0.43
Figure 21- ZLC curves for CO2 in 4A BFK 2.5 – 5.0 mm zeolite at 308 - 373 K. Solid lines in (a) represent the results using the long time response and (b) the complete ZLC model results. The results from the determination of the parameters 𝐷𝑎𝑝/𝑙2, 𝐾∗, 𝐿 and 𝛽 for carbon dioxide
and methane are summed up in Tables 9 and 10.
Table 9- Long time response and complete ZLC model parameters for CO2 in 4A BFK 2.5 - 5.0
mm zeolite at 308, 323, 343 and 373 K. T (K) Q x 107 (m3 s-1) Dap l -2 x 10⁴ ( 𝒔−𝟏) K* L 𝜷 LTR TS LTR TS LTR TS LTR 308 5.28 2.41 1.07 446 470 24 52 3.03 0.01 0.1 1 0 200 400 600 C/ C0 Time (s) CO2, 308 K CO2, 323 K CO2, 343 K CO2, 373 K 0.01 0.1 1 0 200 400 600 C/ C0 Time (s) CO2, 308 K CO2, 323 K CO2, 343 K CO2, 373 K a) b)
323 5.54 3.42 3.17 353 332 23 26 3.00
343 5.88 6.96 6.47 266 255 16 18 2.95
373 6.39 19.1 17.3 147 143 11 13 2.87
Figure 22- ZLC curves for CH4 in 4A BFK 2.5 – 5.0 mm zeolite at 308, 323, 343 and 373 K. Solid
lines in (a) represent the results using the long time response and (b) the complete ZLC model results.
Table 10- Long time response and the complete ZLC model parameters for CH4 in 4A BFK 2.5 -
5.0 mm zeolite at 308, 323, 343 and 373 K. T (K) Q x 107 (m3 s-1) Dap l -2 x 10³ ( 𝒔−𝟏) K* L 𝜷 LTR TS LTR TS LTR TS LTR 308 6.58 9.50 6.14 1.4 1.3 242 416 3.13 323 9.26 9.64 5.00 2.5 2.2 195 413 3.13 343 7.33 9.77 5.94 1.4 1.3 261 487 3.13 373 10.70 10.3 6.06 2.6 2.3 197 380 3.13 0.001 0.01 0 10 20 30 C/C 0 Time (s) CH4, 308 K CH4, 323 K CH4, 343 K CH4, 373 K 0.001 0.01 0 10 20 30 C/C 0 Time (s) CH4, 308 K CH4, 323 K CH4, 343 K CH4, 373 K a) b)
4.4.2 4A BFK 1.6-2.5 mm
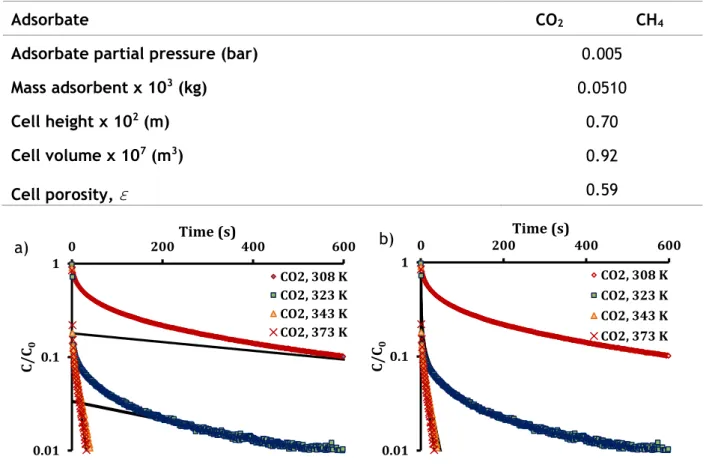
The experimental conditions used in the ZLC measurements of CO2 and CH4 in 4A BFK 1.6-2.5 mm are reported in Table 11. The ZLC results for CO2 at each temperature and at 4.68 x 10⁻⁷ m3 s-1 flow rate (PTN conditions) are shown in Figure 23. The ZLC results for CH
4 at 5.83 x 10⁻⁷ m3 s-1 (PTN conditions) for experiments at 308 and 323 K and 7.83 x 10⁻⁷ m3 s-1 (PTN conditions) for experiments at 343 and 373 K are shown in Figure 24 (CH4). The flow rate at the conditions of the experiment can be found at Table 7.
Table 11- Experimental conditions for the ZLC runs with 4A BFK 1.6 – 2.5 mm.
Adsorbate CO2 CH4
Adsorbate partial pressure (bar) 0.005
Mass adsorbent x 103 (kg) 0.0442 Cell height x 102 (m) 0.86 Cell volume x 107 (m3) 1.14 Cell porosity, ε 0.67
Figure 23- ZLC curves for CO2 in 4A BFK 1.6 – 2.5 mm zeolite at 308, 323, 343 and 373 K. Solid
lines in (a) represent the results using the long time response and (b) the complete ZLC model results.
The results from the determination of the parameters 𝐷𝑎𝑝/𝑙2, 𝐾∗, 𝐿 and 𝛽 for carbon dioxide
and methane are given in Tables 12 and 13.
Table 12- Long time response and the complete ZLC model for CO2 in 4A BFK 1.6 – 2.5 mm
zeolite at 303, 323, 343 and 373 K. T (K) Q x 107 (m3 s-1) Dap l -2 x 10⁴ ( 𝒔−𝟏) K* L β LTR TS LTR TS LTR TS LTR 0.01 0.1 1 0 200 400 600 C/C 0 Time (s) CO2, 308 K CO2, 323 K CO2, 343 K CO2, 373 K 0.01 0.1 1 0 200 400 600 C/C 0 Time (s) CO2, 308 K CO2, 323 K CO2, 343 K CO2, 373 K a) b)