ISSN 0104-6632 Printed in Brazil
www.abeq.org.br/bjche
Vol. 28, No. 03, pp. 533 - 544, July - September, 2011
Brazilian Journal
of Chemical
Engineering
MODELING OF THE FIXED-BED ADSORPTION
OF CARBON DIOXIDE AND A CARBON
DIOXIDE-NITROGEN MIXTURE ON ZEOLITE 13X
T. L. P. Dantas
1,3*, F. M. T. Luna
2, I. J. Silva Jr.
2, A. E. B. Torres
2, D. C. S. de Azevedo
2,
A. E. Rodrigues
3and R. F.P.M. Moreira
11
Federal University of Santa Catarina, Department of Chemical and Food Engineering, Laboratório de Energia e Meio Ambiente (LEMA), Phone: + (55) (48) 33319448, Ext. 211, Fax: + (55) (48) 33319687, Campus Universitário,
Trindade, P.O. Box 476, 88040-900, Florianópolis - SC, Brazil.
*
Permanent Address: Federal University of Paraná, Department of Chemical Engineering, Phone + (55) (41) 33613173, Fax: + (55) (41) 33613277, Centro Politécnico, 81531-980, Jardim das Américas, Curitiba - PR, Brazil.
E-mail: [email protected], [email protected]
2
Federal University of Ceará, Department of Chemical Engineering, Grupo de Pesquisa em Separações por Adsorção, (GPSA), Phone: + (55) (85) 3366-9611, ext. 28, Campus do Pici, 60455-760, Fortaleza - CE, Brazil.
E-mail: [email protected]; [email protected]; [email protected]; [email protected]
3
University of Porto, Faculty of Engineering, Department of Chemical Engineering, Laboratory of Separation and Reaction Engineering (LSRE), Associate Laboratory LSRE/LCM, Phone: (351) 22 508 1669,
Fax: (351) 22 508 1674, Rua Dr. Roberto Frias s/n, P.O. Box 4200-465, Porto - Portugal. E-mail: [email protected]
(Submitted: June 21, 2010 ; Revised: February 23, 2011 ; Accepted: April 30, 2011)
Abstract - In this study, the fixed-bed adsorption of carbon dioxide and a carbon dioxide-nitrogen mixture on
zeolite 13X was investigated. The adsorption equilibrium and breakthrough curves were determined at different temperatures – 301-306 K, 323 K, 373 K and 423 K. A model based on the LDF approximation for the mass transfer, considering the energy and momentum balances, was used to describe the adsorption kinetics of carbon dioxide and a carbon dioxide-nitrogen mixture. The model acceptably reproduced all of the breakthrough curves and can be considered as adequate for designing a PSA cycle to separate carbon dioxide-nitrogen mixtures.
Keywords: Adsorption; Carbon dioxide; Nitrogen; Zeolite 13X; Modeling.
INTRODUCTION
The emission of CO2 from power plants that burn fossil fuels is the major reason for the increase in the concentration of this gas in the atmosphere. The amount of carbon dioxide in the atmosphere is currently increasing globally by around six billion tons per year (Zhao et al., 2007).
The capture and storage of carbon dioxide is a technically feasible method of making significant reductions in carbon dioxide emissions. Capturing carbon dioxide involves separating the CO2 from other
flue gases. The technological advances that are being developed around the world capture carbon dioxide from flue gases by using different schemes: post-combustion, pre-combustion and oxy-fuel processes.
534 T. L. P. Dantas, F. M. T. Luna, I. J. Silva Jr., A. E. B. Torres, D. C. S. de Azevedo, A. E. Rodrigues and R. F.P.M. Moreira
and Yee, 2002; Grande and Rodrigues, 2008). Pressure swing adsorption technology has become an interesting alternative due to low energy requirements and cost advantages. The PSA processes can be operated at high temperatures and overcome the need to cool the fuel gas to ambient temperature prior to the removal of carbon dioxide (Gaffney et al., 1999).
The capture of carbon dioxide by adsorptive processes is mainly based on preferential adsorption of this gas on a porous adsorbent. Thus, the first and most important step is to find a suitable adsorbent. In industrial processes, zeolite 13X is frequently used as an adsorbent due to its high adsorption capacity (Lee et al., 2002; Siriwardane et al., 2001). For any such case, the basic information required is the adsorption equilibrium behavior of the pure components, in this case carbon dioxide. The design of a PSA system also requires the development of a model that can describe the dynamics of the adsorption on a fixed-bed with the selected adsorbent.
In this study, the adsorption of carbon dioxide and a carbon dioxide-nitrogen mixture on zeolite 13X packed in a fixed-bed was studied. The Linear Driving Force (LDF) model, considering the energy and momentum balances, was used to describe the kinetics of the carbon dioxide and the carbon dioxide-nitrogen mixture adsorption on zeolite 13X.
EXPERIMENTAL SECTION
The gases used for the carbon dioxide breakthrough curves were provided by White Martins S.A/Brazil: Helium 4.5 (99.99%) and standard mixtures of carbon dioxide/helium (20% CO2/He v/v) and carbon dioxide/nitrogen (20% CO2/N2 v/v). Pure CO2 (99.99%) and N2 (99.995%) were supplied by Air Liquid S.A. (Portugal). The adsorbent used was zeolite 13X (TradeShinli, China) and its characterization (BET area, pore size distribution and micropore volume), as well as information on the adsorption equilibrium of the pure carbon dioxide and pure nitrogen components, have been reported in a previous study (Dantas et al., 2008).
Fixed-Bed CO2 and CO2/N2 MixtureAdsorption
The experimental breakthrough curves were obtained by passing the appropriate gas mixture (20% CO2/He v/v or 20% CO2/N2 v/v) through the column packed with zeolite 13X. The solid adsorbent was pre-treated by passing helium over it at a flow rate of 5x10⁻⁷ m3.s-1 at 593K for 2 hours. These breakthrough curves were obtained at 301K, 323K,
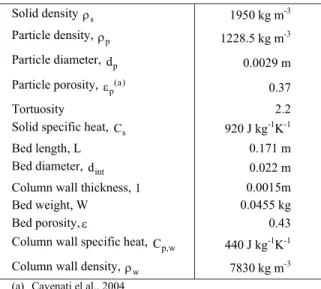
373K and 423 K. The total gas flow rate was maintained at 5x10⁻⁷ m3.s-1 for the CO2 breakthrough curves and at 10x10-7 m3.s-1 for the CO2/N2 breakthrough curves. The reversibility of the adsorption was studied in desorption experiments by passing pure helium through the packed column at a total flow rate of 5x10⁻⁷ m3.s-1. The gas flow was controlled by a mass flow unit (Matheson, USA). A Model CG35 gas chromatograph (CG Instrumentos Científicos, Brazil) equipped with a Porapak-N packed column (Cromacon, Brazil) and with a thermal conductivity detector (TCD) was used to monitor the carbon dioxide and nitrogen concentration at the bed exit, using helium as the reference gas. The column was located inside a furnace with controlled temperature. The experimental system (column and furnace) was considered to be adiabatic because it was isolated with a layer of 0.10 m of fiberglass and with a refractory material. The properties of the adsorbent and of the fixed-bed are given in Table 1.
Table 1: Physical properties of the adsorbent and
of the bed used in the CO2 and CO2/N2 adsorption
experiments.
Solid density ρs 1950 kg m-3
Particle density, ρp 1228.5 kg m-3
Particle diameter, d p 0.0029 m
Particle porosity, (a) p
ε 0.37
Tortuosity 2.2 Solid specific heat, C s 920 J kg-1K-1
Bed length, L 0.171 m
Bed diameter, dint 0.022 m
Column wall thickness, l 0.0015m
Bed weight, W 0.0455 kg
Bed porosity,ε 0.43
Column wall specific heat, Cp,w 440 J kg-1
K-1
Column wall density, ρw 7830 kg m-3
(a) Cavenati el al., 2004
Fixed-Bed CO2 Adsorption from a CO2/N2
Mixture in a Nitrogen-Saturated Fixed-Bed
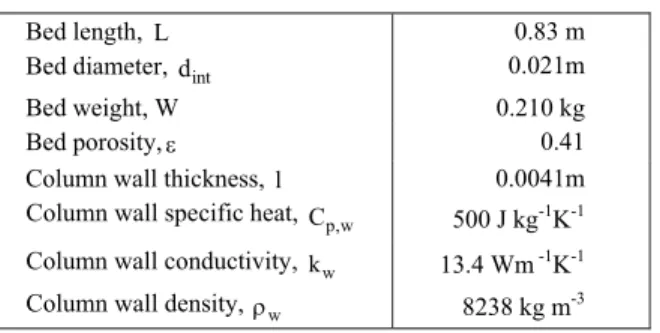
flow controllers (Teledyne Brown Engineering, USA). At the end of the column, the carbon dioxide concentrations were periodically analyzed using a GA-40T Gas Analyzer (Madur Electronics, USA). The temperature inside the column was continuously monitored using a K-thermocouple placed at 0.17 m and 0.43 m from the bottom of the column. The column was located inside a convective furnace and thus the system was considered to be non-adiabatic. The characteristics of the fixed bed and the column are presented in Table 2.
Table 2: Properties of the bed and column used in
the CO2 adsorption on zeolite 13X in a
nitrogen-saturated fixed bed.
Bed length, L 0.83 m
Bed diameter, dint 0.021m
Bed weight, W 0.210 kg
Bed porosity,ε 0.41
Column wall thickness, l 0.0041m
Column wall specific heat, Cp,w 500 J kg-1K-1 Column wall conductivity, k w 13.4 Wm -1K-1
Column wall density, ρw 8238 kg m-3
MODEL DESCRIPTION
The model used to describe the fixed-bed dynamics was derived from the mass balance taking into account the energy balance. For the model used to describe the fixed-bed dynamics of the adsorption of the CO2/N2 mixture and of CO2 from the CO2/N2 mixture in a nitrogen-saturated fixed-bed, the momentum balance was also considered. The model was based on the following assumptions:
(i) The flow pattern is described by the axially dispersed plug flow model;
(ii) The mass transfer rate is represented by a linear driving force (LDF) model;
(iii) The gas phase behaves as an ideal gas mixture; and (iv) Radial concentration and temperature gradients are negligible.
With these assumptions, the fixed-bed model is described by the following equations (Eq. 1-7). The mass balance for each component is given by Eq. (1) (Ruthven, 1984):
2
i i i i
L 2 p
C (uC ) C q
D (1 )
t z z t
∂ ∂ ∂ ∂
ε + = ε − − ε ρ
∂ ∂ ∂ ∂ (1)
where ε is the bed porosity, Ci is the concentration of component i in the gas phase, D is the axial L
dispersion coefficient, u is the superficial velocity, andρp is the particle density. The rate of mass transfer to the particle for each component is given by Eq. (2):
* i
L,i i i
q
K (q q ) t
∂ = −
∂ (2)
where K is the LDF overall mass transfer L coefficient, q is the adsorbed equilibrium *i concentration, i.e., q*i =f (C )i given by the isotherm, and q is the average adsorbed concentration. The i total concentration C is given by:
g
P C
RT
= (3)
where P is the total pressure, Tg is the gas phase temperature and R is the universal gas constant. The Ergun equation considers the terms of the pressure drop and velocity changes:
2
g 2
g
3 2 3
p p
(1 )
P (1 )
150 u 1.75 u
z d d
μ − ε
∂ − ε
− = + ρ
∂ ε ε (4)
where μg is the gas phase viscosity, ρg is the gas phase density and dp is the particle diameter.
The energy balance is:
(
)
g g
g g
2
g s
L 2 p s
i w
p i g w
int i
T (uT )
CC CC
t z
T T
(1 ) C t z
q 4h
(1 ) H (T T )
t d
∂ ∂
ε + =
∂ ∂
∂ ∂
ελ − − ε ρ +
∂ ∂
∂
− ε ρ −Δ − −
∂
∑
(5)
where C is the molar specific heat of the gas phase, g
L
536 T. L. P. Dantas, F. M. T. Luna, I. J. Silva Jr., A. E. B. Torres, D. C. S. de Azevedo, A. E. Rodrigues and R. F.P.M. Moreira
(
)
s f
p s g s
p
i
p i
i
T 6h
C (T T )
t d
q H
t
∂
ρ = − +
∂
∂
ρ −Δ
∂
∑
(6)
where h is the film heat transfer coefficient f between the gas and the adsorbent. For the column wall, the energy balance can be expressed by:
w
w p,w w w g w
wl w
T
C h (T T )
t
U(T T )∞
∂
ρ = α − −
∂
α −
(7)
where ρw is the column wall density, Cp,wis the column wall specific heat, αw is the ratio of the internal surface area to the volume of the column wall, αwl is the ratio of the logarithmic mean surface area of the column shell to the volume of the column (Da Silva and Rodrigues, 2002), U is the overall heat transfer coefficient between the column wall and the external air, and T∞ is the furnace external air temperature.
For an adiabatic system, the last term of Eq. (7) must not been considered. The boundary conditions are the following:
z = 0: L i iz iz
z
C
D . u(C C )
z + − +
∂
ε = − −
∂ (8)
z = L: i
z
C
0 z −
∂ =
∂ (9)
z = 0: L g p,g g g
z z z
T
. uCC (T T )
z + − +
∂
ελ = − −
∂ (10)
z = L: g
z
T
0 z −
∂ =
∂ (11)
z = 0: u Cz− =u Cz+ (12)
The initial conditions for the adiabatic system are:
w g s i 0
T T T T ; P P
(for no constant velocity system) and
= = = =
(13)
i i
C (z,0)=q (z,0) 0=
The initial conditions for the non-adiabatic system are the following:
w g s i
T =T =T =T ; P=P0;
and
i i
2
i i sat
g 2
C (z,0) q (z,0) 0 for the CO component
P
C (z,0) , q (z,0) q RT
for the N component
⎧
⎪ = =
⎪ ⎪ ⎨
⎪ = =
⎪ ⎪ ⎩
(14)
The mathematical model was solved with the commercial software gPROMS (Process System Enterprise Limited, UK), which uses the method of orthogonal collocation on finite elements for resolution. The bed was divided into fifty sections with three collocation points for each element of the adsorption bed.
Estimation of the Model Parameters
According to Ruthven and Farooq (1993) and Sircar and coworkers (1999), the kinetics of the diffusion of nitrogen into zeolite 13X is controlled by molecular diffusion in the macropores. In this study, it was considered that the diffusion of both nitrogen and carbon dioxide into the zeolite 13X is controlled by molecular diffusion in the macropores. In fact, when the LDF overall mass transfer coefficient was evaluated considering micropores, macropores and Knudsen diffusion, the fitting of the model to the experimental data was not satisfactory (Dantas, 2009).
The LDF overall mass transfer coefficient is related to the effective diffusivity of the macropore molecular diffusion-controlled system by the following relationship:
p m,i o
L 2
p p o
D C
K 15
r q
ε =
τ (15)
Henry’s law. The molecular diffusivity (Dm,i) is evaluated from the Chapman-Enskog equation. A particle tortuosity (τp) of 2 was assumed and a value of 0.37 for the particle porosity was used (Cavenati et al., 2004).
The axial dispersion coefficient was evaluated using the correlation of Wakao and Funazkri (1978):
L o m
D
0.5Sc Re D
ε = ε + (16)
where εo is the term corresponding to the stagnant contribution to axial dispersion. For low Reynolds numbers, the value of this term has an important effect on the fixed-bed dynamics. For Reynolds numbers lower than 1 (Re < 1), a value of 0.23 was
used for this term and, for higher Reynolds numbers (Re > 10), a value of 20 was used for this term. These values are consistent with those previously observed by other authors who used this correlation to model a fixed-bed adsorption process in the gas phase with similar Reynolds numbers (Cavenati et al., 2006; Delgado et al., 2006).
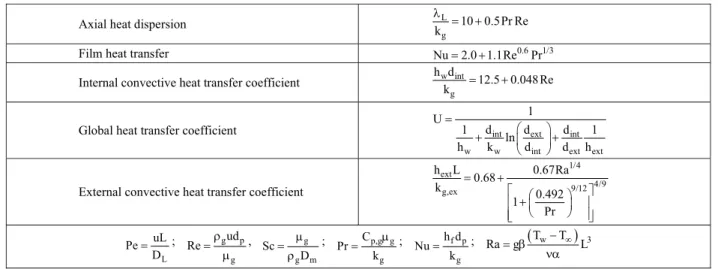
The gas phase viscosity was estimated from Wilke’s equation (Bird, 1060). The mass and heat transport parameters were estimated according to correlations reported in the literature (Bird, 1960; De Wash and Froment, 1972; Incropera and De Witt, 1996).The correlations used to evaluate the mass and heat transport parameters are summarized in Table 3. The values for some of the physical and transport properties of the gas phase, used for the calculation of the breakthrough simulation parameters, are shown in Table 4.
Table 3: Correlations used for estimation of mass and heat parameters.
Axial heat dispersion L
g
10 0.5Pr Re k
λ = +
Film heat transfer Nu=2.0 1.1Re+ 0.6Pr1/3
Internal convective heat transfer coefficient w int
g
h d
12.5 0.048 Re
k = +
Global heat transfer coefficient int ext int
w w int ext ext
1 U
1 d d d 1
ln
h k d d h
=
⎛ ⎞
+ ⎜ ⎟+
⎝ ⎠
External convective heat transfer coefficient
1/4 ext
4/9 9/12 g,ex
h L 0.67Ra
0.68 k
0.492 1
Pr
= +
⎡ ⎛ ⎞ ⎤
+
⎢ ⎜⎝ ⎟⎠ ⎥
⎢ ⎥
⎣ ⎦
L
uL Pe
D
= ; g p
g
ud Re=ρ
μ , g
g m
Sc D
μ =
ρ ;
p,g g
g
C Pr
k
μ
= ; f p
g
h d Nu
k
= ; Ra= βg (Tw−T∞)L3 να
Table 4: Gas phase physical and transport properties
Run yF T, K Dm, 104 m2s-1 Sc Re DL, 104 m2s-1
1 301 0.535 0.803 0.09 0.08
2 323 0.602 0.807 0.08 0.08
3 373 0.766 0.812 0.06 0.08
4
0.2
423 0.943 0.819 0.05 0.08
5 301 0.153 0.894 0.55 0.15
6 323 0.175 0.886 0.49 0.15
7 373 0.224 0.891 0.38 0.15
Adiabati
c
8
0.2
423 0.281 0.883 0.30 0.15
9 306 0.155 0.817 21.65 7.33
10 323 0.170 0.823 19.52 7.81
11 373 0.217 0.835 15.18 9.31
No
n
-ad
ia
b
a
tic
12
0.1
538 T. L. P. Dantas, F. M. T. Luna, I. J. Silva Jr., A. E. B. Torres, D. C. S. de Azevedo, A. E. Rodrigues and R. F.P.M. Moreira
RESULTS AND DISCUSSION
Adsorption Equilibrium of Carbon Dioxide and Nitrogen
The basic information required to describe the fixed-bed dynamics of the adsorption of carbon dioxide and a carbon dioxide-nitrogen mixture is the adsorption equilibrium behavior of the single components. The adsorption equilibria of the pure components on the zeolite 13X used in this study have been previously reported (Dantas, 2009). The CO2 and N2 adsorption equilibrium data were fitted using the Toth model (Eq. (17)) (Toth, 1971; Do, 1998) and the temperature dependence of the equilibrium was described according to the Van’t Hoff equation (Eq. (18)).
m eq n 1/n eq
q K P
q
[(1 (K P) ]
=
+ (17)
eq o
H
K K exp
RT
−Δ
⎛ ⎞
= ⎜ ⎟
⎝ ⎠ (18)
In this study, the adsorbed equilibrium concentration of carbon dioxide on zeolite 13X was estimated as a function of the feed concentration from a mass balance in the fixed bed. For each experimental breakthrough curve, the adsorbed equilibrium concentration is given by:
(
C Q tF F st) (
CF)
qV V 1
ε
= −
− ε − ε (19)
where C is the feed concentration, V is the bed F volume, Q is the feed volumetric flow rate and F t st is the stoichiometric time given by:
st
F o
C
t 1 dt
C
∞
⎛ ⎞
= ⎜ − ⎟
⎝ ⎠
∫
(Ruthven, 1984). The adsorbed equilibrium concentrations of nitrogen could not be measured due to the very fast breakthrough time, which generates large errors in the adsorbed equilibrium estimates.The resulting adsorbed equilibrium concentrations are given in Table 5. The differences between some of the values are attributed to the different methodologies used. It can be observed that the zeolite 13X adsorption capacity for CO2 in the CO2/He and CO2/N2 mixtures is very close to that predicted by the Toth isotherm using the fitting parameters previously reported (Dantas, 2009). This is to be expected if the active sites for N2 and CO2 are independent. The amount of CO2 adsorbed predicted by the multicomponent Toth isotherm has a higher deviation (28.58%) than that predicted by the pure gas Toth isotherm (14.53%).
Thus, the pure component equilibrium isotherms predicted very well the equilibrium of each component in the CO2/N2 mixture. Moreover, this solid adsorbed carbon dioxide to its total capacity. This assumption agrees with Siriwardane and coworkers (2001), who observed the same results for adsorption of CO2/N2 mixtures on 13X zeolite. Table 6 shows the equilibrium parameters of the Toth model for carbon dioxide and nitrogen adsorption on zeolite 13X.
Table 5: Experimental conditions and adsorbed concentrations from the mass balance of some breakthrough experiments and predicted by the Toth isotherms for pure components and bicomponent.
Run T, K P, bar q(a), mol kg-1
-1 (b)
q , mol kg q(c), mol kg-1
1 301 1.02 2.16 2.49
2 323 1.02 1.45 1.97
5 301 1.02 2.35 2.49 2.20 6 323 1.02 1.83 1.97 1.36 9 306 1.20 2.30 2.15 1.46 10 323 1.2 1.80 1.65 0.97 (a) calculated from the mass balance; (b) predicted by the Toth isotherms for pure components; (c) predicted by the bicomponent Toth isotherm.
Table 6: Adsorption equilibrium parameters of the Toth model for zeolite 13X*.
Gas qm, mol/kg n Ko, bar-1 -ΔH, kJ/mol
CO2 5.09 0.429 4.31 x10⁻⁴ 29.38
N2 3.08 0.869 8.81 x10⁻⁵ 17.19
Breakthrough Curve Modeling
Fixed-Bed CO2 MixtureAdsorption
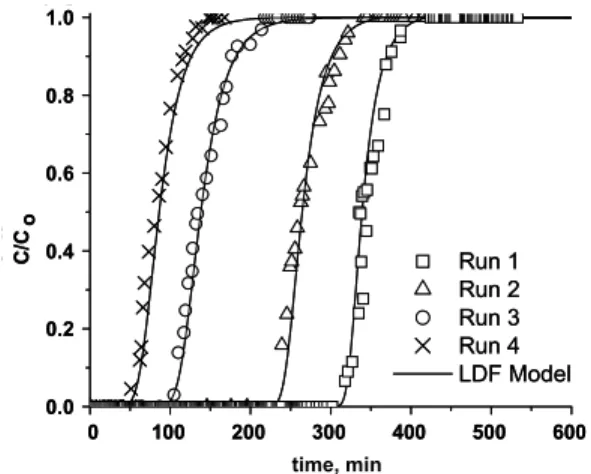
For the carbon dioxide breakthrough curves, a set of experiments was performed changing the initial temperature of the bed (runs 1 to 4) and the results were simulated using the model described above. Because the feed consists of a small concentration of a single adsorbable component (carbon dioxide), the velocity through the bed was considered to be constant. As mentioned previously, the system was also considered to be adiabatic. Figure 1 shows a comparison between the experimental and theoretical curves obtained for CO2 adsorption on zeolite 13X under the conditions of runs 1 to 4. It can be observed that, when the temperature is increased, the carbon dioxide breakthrough times are shorter due to
the exothermic nature of the adsorption. It was also observed that the simulated curves reproduce adequately the experimental data for the different feed concentrations and temperatures studied, suggesting that the assumptions on which the model is based could be valid for this system. The LDF overall mass transfer coefficients calculated and used in these simulations are shown in Table 7.
The simulated temperature profiles at the end of the bed are shown in Figure 2 for the conditions of run 1 and run 4 where the large and small temperature peaks are expected. It can be observed that the temperature peaks are very large. In Figures 2 (a) and 2 (b), the temperature peaks correspond to the differences of around 35 K and 5 K, respectively. This is due to the high heat of adsorption for carbon dioxide on zeolite 13X and heat effects during the adsorption process must therefore be considered.
0 100 200 300 400 500 600 0.0
0.2 0.4 0.6 0.8 1.0
Run 1 Run 2 Run 3 Run 4 LDF Model
C/
C o
time min
0 100 200 300 400 500 600
0.0 0.2 0.4 0.6 0.8 1.0
C/
Co
time, min
0 100 200 300 400 500 600 0.0
0.2 0.4 0.6 0.8 1.0
Run 1 Run 2 Run 3 Run 4 LDF Model
C/
C o
time min
0 100 200 300 400 500 600
0 100 200 300 400 500 600
0.0 0.2 0.4 0.6 0.8 1.0
0.0 0.2 0.4 0.6 0.8 1.0
C/
Co
C/
Co
time, min
Figure 1: Breakthrough curves for CO2 adsorption on zeolite 13X.
Symbols: experimental data; Lines: LDF model.
Table 7: LDF overall mass transfer coefficients for N2 and CO2
adsorption on zeolite 13X
-1 L
K , s Run
N2 CO2
1 ⎯ 0.226
2 ⎯ 0.370
3 ⎯ 1.196
4 ⎯ 2.525
5 2.733 0.065
6 5.102 0.108
7 9.566 0.353
8 31.844 0.758
9 2.792 0.067
10 5.014 0.106
11 9.324 0.344
540 T. L. P. Dantas, F. M. T. Luna, I. J. Silva Jr., A. E. B. Torres, D. C. S. de Azevedo, A. E. Rodrigues and R. F.P.M. Moreira
0 100 200 300 400 500 600 301 310 320 330 340 (a) Tempe rature , K time min
0 100 200 300 400 500 600
301 310 320 330 340 T e mp e rat ure, K time, min
0 100 200 300 400 500 600 301 310 320 330 340 (a) Tempe rature , K time min
0 100 200 300 400 500 600
0 100 200 300 400 500 600
301 310 320 330 340 301 310 320 330 340 T e mp e rat ure, K time, min
0 100 200 300 400 500 600 423 424 426 428 430 (b) Temperatu re , K time min
0 100 200 300 400 500 600
423 424 426 428 430 Te m p e ra tu re , K time, min
0 100 200 300 400 500 600 423 424 426 428 430 (b) Temperatu re , K time min
0 100 200 300 400 500 600
0 100 200 300 400 500 600
423 424 426 428 430 423 424 426 428 430 Te m p e ra tu re , K time, min (a) (b)
Figure 2: Simulated temperature profile, at the end of the column, of the gas phase for CO2 adsorption on
zeolite 13X. (a) Run 1 and (b) run 4.
Fixed-Bed CO2/N2 MixtureAdsorption
Figure 3 shows a comparison between the experimental and theoretical curves obtained for N2 and
CO2 adsorption on zeolite 13X under the conditions of runs 5 to 8. In Table 7 is possible to observe the LDF overall mass transfer coefficient used for these carbon dioxide and nitrogen breakthrough curves.
0 50 100 150 200 250 300 0.0 0.2 0.4 0.6 0.8 1.0 1.2 1.4 (a) C/C o ti i
0 50 100 150 200 250 300
0.0 0.2 0.4 0.6 0.8 1.0 1.2 1.4 C/ Co time, min
0 50 100 150 200 250 300 0.0 0.2 0.4 0.6 0.8 1.0 1.2 1.4 (a) C/C o ti i
0 50 100 150 200 250 300
0.0 0.2 0.4 0.6 0.8 1.0 1.2 1.4 C/ Co time, min
0 50 100 150 200 250 300
0 50 100 150 200 250 300
0.0 0.2 0.4 0.6 0.8 1.0 1.2 1.4 0.0 0.2 0.4 0.6 0.8 1.0 1.2 1.4 C/ Co C/ Co
time, min 0 50 100 150 200 250 300
0.0 0.2 0.4 0.6 0.8 1.0 1.2 1.4 (b) C/C o ti i
0 50 100 150 200 250 300
0.0 0.2 0.4 0.6 0.8 1.0 1.2 1.4 C/ Co time, min
0 50 100 150 200 250 300 0.0 0.2 0.4 0.6 0.8 1.0 1.2 1.4 (b) C/C o ti i
0 50 100 150 200 250 300
0 50 100 150 200 250 300
0.0 0.2 0.4 0.6 0.8 1.0 1.2 1.4 0.0 0.2 0.4 0.6 0.8 1.0 1.2 1.4 C/ Co C/ Co time, min (a) (b)
0 50 100 150 200 250 300 0.0 0.2 0.4 0.6 0.8 1.0 1.2 1.4 (c) C/C o i i
0 50 100 150 200 250 300
0.0 0.2 0.4 0.6 0.8 1.0 1.2 1.4 C/ Co time, min
0 50 100 150 200 250 300 0.0 0.2 0.4 0.6 0.8 1.0 1.2 1.4 (c) C/C o i i
0 50 100 150 200 250 300
0 50 100 150 200 250 300
0.0 0.2 0.4 0.6 0.8 1.0 1.2 1.4 0.0 0.2 0.4 0.6 0.8 1.0 1.2 1.4 C/ Co C/ Co
time, min 0 50 100 150 200 250 300
0.0 0.2 0.4 0.6 0.8 1.0 1.2 1.4 (d) C/ C o ti i
0 50 100 150 200 250 300
0.0 0.2 0.4 0.6 0.8 1.0 1.2 1.4 C/ Co time, min
0 50 100 150 200 250 300 0.0 0.2 0.4 0.6 0.8 1.0 1.2 1.4 (d) C/ C o ti i
0 50 100 150 200 250 300
0 50 100 150 200 250 300
0.0 0.2 0.4 0.6 0.8 1.0 1.2 1.4 0.0 0.2 0.4 0.6 0.8 1.0 1.2 1.4 C/ Co C/ Co time, min (c) (d)
Figure 3: Breakthrough curves for N2 and CO2 adsorption on zeolite 13X. Symbols: experimental data;
The model reproduces very well all of the breakthrough curves, for all feed concentrations, including the experimental breakthrough curves obtained for nitrogen. It was observed that the adsorbent is very selective toward carbon dioxide, as shown by the difference between the breakthrough times. As previously stated, the theoretical curves for CO2 and N2 adsorption on zeolite 13X were simulated by considering the Toth equation for the pure components to describe the equilibrium. The simulation results show that the zeolite 13X capacity for CO2 adsorption is not affected by the presence of N2. These results are in line with the observations reported by Goj et al. (2002) obtained by molecular simulation and by Harlick and Tezel (2003). The observations showed mixture isotherms in which the amount of CO2 adsorption is almost unchanged from the analogous single component isotherm. These results are attributed to the lateral interactions between carbon dioxide molecules due to their higher quadrupole moment (Delgado et al., 2006).
Figure 4 shows the simulated temperature profile for the carbon dioxide/nitrogen mixture adsorption on zeolite 13X, at the end of column, under experimental conditions of temperature of 301 K (run 5). The temperature peak correspond to a difference around 30 K, very similar to the temperature peak observed for the CO2 adsorption only. In the inset, it is possible to observe that there is a first temperature peak at the beginning of the adsorption. This is to be expected, since, at the beginning, there is also nitrogen adsorption.
0 50 100 150 200 250 300 301 305 310 315 320 325 330 Temperature , K time min
0 50 100 150 200 250 300
301 305 310 315 320 325 330 T e m p era ture, K time, min
0 50 100 150 200 250 300 301 305 310 315 320 325 330 Temperature , K time min
0 50 100 150 200 250 300
0 50 100 150 200 250 300
301 305 310 315 320 325 330 301 305 310 315 320 325 330 T e m p era ture, K time, min
Figure 4: Simulated temperature profile of the gas
phase for CO2/N2 mixture adsorption on zeolite 13X. Conditions: run 5.
Fixed-Bed CO2 Adsorption from a CO2/N2
Mixture in a Nitrogen-Saturated Fixed-Bed
A set of experiments was performed changing the initial temperature of the bed to obtain the breakthrough curves of CO2 adsorption from CO2/N2 mixtures on zeolite 13X in a nitrogen-saturated fixed
bed (runs 9 to 12). Figure 5 shows the experimental and simulated breakthrough curves for the CO2 adsorption. The model was suitable for describing the dynamics of CO2 adsorption. The LDF overall mass transfer coefficient used to simulate these breakthrough curves can be seen in Table 7.
0 20 40 60 80 100
0.0 0.2 0.4 0.6 0.8 1.0 C/C o time min
0 20 40 60 80 100
0.0 0.2 0.4 0.6 0.8 1.0 C/ Co time, min
0 20 40 60 80 100
0.0 0.2 0.4 0.6 0.8 1.0 C/C o time min
0 20 40 60 80 100
0.0 0.2 0.4 0.6 0.8 1.0 C/ Co time, min
0 20 40 60 80 100
0 20 40 60 80 100
0.0 0.2 0.4 0.6 0.8 1.0 0.0 0.2 0.4 0.6 0.8 1.0 C/ Co C/ Co time, min
Figure 5: Breakthrough curves for CO2 adsorption from
CO2/N2 on zeolite 13X in a nitrogen-saturated fixed bed. Symbols: experimental data; CO2. Lines: LDF model. Conditions: □ run 9; ∆ run 10; ○ run 11 and × run 12.
The system is non-adiabatic and a variation in the fluid phase temperature was noted during the adsorption (Figure 6) at the differential position of 0.17 m for run 9. The temperature peak is high, even considering that in this system there is a contribution from nitrogen desorption. This is because zeolite 13X is very selective toward carbon dioxide; there is a large difference between the heat of adsorption of carbon dioxide and of nitrogen on this adsorbent and the presence of nitrogen does not affect the CO2 adsorption. Moreover, the thermal effects must be considered for all of the CO2 adsorption systems discussed herein.
0 20 40 60 80 100
306 310 320 330 340 350 Temperatute , K time mim
0 20 40 60 80 100
306 310 320 330 340 350 T e m p era tut e, K time, mim
0 20 40 60 80 100
306 310 320 330 340 350 Temperatute , K time mim
0 20 40 60 80 100
0 20 40 60 80 100
306 310 320 330 340 350 306 310 320 330 340 350 T e m p era tut e, K time, mim
Figure 6: Temperature profile, at 0.17 m () and
542 T. L. P. Dantas, F. M. T. Luna, I. J. Silva Jr., A. E. B. Torres, D. C. S. de Azevedo, A. E. Rodrigues and R. F.P.M. Moreira
CONCLUSIONS
In this study, the fixed-bed adsorption of carbon dioxide on zeolite 13X was investigated. A model based on the LDF for the mass transfer, considering the thermal effects, was able to suitably describe the carbon dioxide breakthrough curves.
The fixed-bed adsorption of carbon dioxide from CO2/N2 mixtures on zeolite 13X was also studied. The adsorption dynamics were investigated at several temperatures and under different conditions: considering N2 adsorption and desorption. It was demonstrated that zeolite 13X adsorbed carbon dioxide and nitrogen to its total capacity and, thus, the equilibrium of CO2 and N2 adsorption for CO2/N2 mixtures can be very well described by the pure component adsorption isotherms. A model based on the LDF for the mass transfer, considering the energy and momentum balances, was able to describe adequately the adsorption kinetics of carbon dioxide and nitrogen.
The LDF overall mass transfer coefficient was related to the effective diffusivity for a macropore molecular diffusion-controlled system. The zeolite 13X used in this study has high selectivity for CO2 and it is suitable for CO2/N2 separation processes. The model proposed here can be used to design a PSA cycle to separate CO2/N2 mixtures, where pressure drop and thermal effects are very important.
ACKNOWLEDGEMENTS
The authors are grateful to CAPES for financial support and CAPES/GRICES for the International Brazil/Portugal Cooperation Project.
NOMENCLATURE
C total concentration of the gas phase
mol.m3
F
C feed concentration mol.m3
g
C molar specific heat at constant volume for the gas phase
J.kg-1.K-1
i
C concentration of component i in the gas phase
mol.m3
s
C solid specific heat J.kg-1.K-1
p,w
C column wall specific heat J.kg-1.K-1
p
d particle diameter m
ext
d column diameter m
int
d bed diameter m
DK, i Knudsen diffusivity of component i
m2.s-1 DL axial dispersion coefficient m2.s-1 Dm,i molecular diffusivity of
component i
m2.s-1 hext external convective heat
transfer coefficient
W.m-2.K-1 hf film heat transfer coefficient
between the gas and the adsorbent
W.m-2.K-1
hw internal heat transfer coefficientbetween the gas and the column wall
W.m-2.K-1
kf film mass transfer coefficient
m.s-1
ext
k external air conductivity W.m -1.K-1
g
k gas phase conductivity W.m -1.K-1
w
k column wall conductivity W.m -1.K-1 KL,i LDF overall mass transfer
coefficient of component i
s-1 Keq equilibrium constant bar-1 Ko pre-exponential factor bar-1
L bed length m
l column wall thickness m
Mi molecular weight of component i
kg.kmol-1 n parameter of Toth model
P total pressure Pa
QF feed volumetric flow rate m3.s-1 qo value of q (concentration at
the solid phase) at equilibrium with C o
mol.m-3
i
q average amount adsorbed of component i
mol.kg-1
* i
q amount adsorbed at
equilibrium of component i
mol.kg-1 qm maximum amount adsorbed
at equilibrium
mol. kg-1
rp particle radius m
R universal gas constant m3.Pa.mol-1.K-1
tst stoichiometric time s
Tg gas temperature K
Ts solid temperature K
Tw column wall temperature K T∞ furnace external air
temperature
K
u superficial velocity m.s-1 U external overall heat transfer
coefficient
W.m-2.K-1
V bed volume m3
Greek Letters
i
H
−Δ adsorption heat for the i
th
component at zero coverage
J.mol-1
α air thermal diffusivity at film temperature
m2.s-1
w
α ratio of the internal surface area to the volume of the column wall
m-1
wl
α ratio of the logarithmic mean surface area of the column shell to the volume of the
column wall
m-1
β thermal expansion coefficient
K-1
ε bed porosity
εp particle porosity
L
λ effective axial thermal conductivity
W.m-1.K-1
g
μ gas viscosity Pa.s-1
ν air kinematics viscosity at film temperature
m2.s-1
g
ρ gas density kg.m-3
ρp particle density kg.m
-3
s
ρ solid density kg.m-3
w
ρ column wall density kg.m-3
p
τ particle tortuosity
Dimensionless Numbers
Nu Nusselt number Pe Peclet number Pr Prandtl number Ra Rayleigh number
REFERENCES
Bird, R.B., Stewart, W. E., Lightfoot, E. N., Transport Phenomena. John Wiley & Sons, New York (1960). Cavenati, S., Grande, C. A., Rodrigues, A. E.,
Adsorption Equilibrium of Methane Carbon Dioxide and Nitrogen on Zeolita 13X. J. Chem. Eng. Data, v. 49, 1095-1101 (2004).
Cavenati, S., Grande, C. A., Rodrigues, A. E., Separation CH4/CO2/N2 mixtures by Layered Pressure Swing Adsorption for upgrade of natural gases.Chem. Eng. Sci., v. 61, 3893-3906 (2006). Chou, C. T., Chen, C. Y., Carbon dioxide recovery
by vacuum swing adsorption. Sep. Purif. Technol., v. 39, 51-65 (2004).
Dantas, T. L. P., Separação de dióxido de carbono por adsorção a partir de misturas sintéticas do tipo gás de exaustão. Ph.D. Thesis, University of Santa Catarina (2009).
Dantas, T. L. P., Rezende, R. V. P., Rodrigues, A. E., Moreira, R. F. P. M., Adsorção de CO2 e N2 sobre carvão ativado e zeólita 13X: Isotermas de Equilíbrio através de medidas gravimétricas. In: 7° Encontro Brasileiro sobre Adsorção- 1° Simpósio Sul-Americano sobre Ciência e Tecnologia de Adsorção (2008). (In Portuguese). Da Silva, F. A., Rodrigues, A. E., Propylene/Propane
separation by vaccum swing adsorption using 13X zeolite. AIChE J., v. 47, 341-355 (2001). Delgado, J. A., Uguina, M. A., Gómez, J. M., Sotelo,
J. L., Ruíz, B., Fixed-bed adsorption of carbon dioxide-helium, nitrogen-helium and carbon dioxide-nitrogen mixtures onto silicalite pellets. Sep. Purif. Technol., v. 49, 91-100 (2006).
De Wash, A. P., Froment, G., Heat transfer in packed beds. Chem. Eng. Sci, v. 27, 567-576 (1972). Do, D. D., Adsorption analysis: Equilibria and
kinetics. Imperial College Press, v. 2, London (1998).
Gaffney, T. R., Golden, T. C., Mayorga, S. G., Brzzowski, J. R., Tayler, F. W., Carbon dioxide pressure swing adsorption process using modified alumina adsorbents, U.S. Patent, 5,917,136 (1999).
Goj, A., Sholl, D. S., Akten, E. D., Kohen, D., Atomistic Simulations of CO2 and N2 Adsorption in Silica Zeolites: The Impact of Pore Size and Shape. J. Phys. Chem. B., v. 106, 8367-8375 (2002).
Gomes, V. G., Yee, K. W. K., Pressure Swing adsorption for carbon dioxide sequestration from exhaust gases. Sep. Purif. Technol., v. 28, 161-171 (2002).
Grande, C. A., Rodrigues, A. E., Electric Swing Adsorption for CO2 removal from flue gases. Int. J. Greenhouse Gas Control, v. 2, 194-202 (2008). Harlick, P. J. E., Tezel, F. H. Adsorption of carbon
dioxide, methane and nitrogen: pure and binary mixture adsorption for ZSM-5 with SiO2/Al2O3 ratio of 280. Sep. Purif. Technol., v. 33, 199-210 (2003).
Incropera, F. D., De Witt, D. P., Fundamentals of Heat and Mass Transfer, 4nd Ed., John Wiley & Sons: New York, U.S.A (1996).
544 T. L. P. Dantas, F. M. T. Luna, I. J. Silva Jr., A. E. B. Torres, D. C. S. de Azevedo, A. E. Rodrigues and R. F.P.M. Moreira
Ruthven, D. M., Principles of Adsorption and Adsorption Processes. John Wiley & Sons, New York (1984).
Ruthven, D. M., Xu, Z., Farooq, S., Sorption kinetics in PSA systems. Gas Sep. Purif., v. 7, 75-81 (1993). Sircar, S., Rao, M. B., Golden, T. C., Fractionation
of air by zeolites. Studies in Surface Science and Catalysis, v. 120, 395-423 (1999).
Siriwardane, R. V., Shen, M-S., Fisher, E. P., Poston, J. A., Adsorption of CO2 on Molecular Sieves and Activated Carbon. Energy Fuels, v. 15, 279-284 (2001).
Toth, J., State Equations of the Solid-gas Interface Layers. Acta Chim. Acad. Sci. Hung., v. 69, 311-328 (1971).
Wakao, N., Funazkri, T., Effect of fluid dispersion coefficients on particle-to-fluid mass transfer coefficients in packed beds: Correlation of Sherwood numbers. Chem. Eng. Sci., v. 33, 1375-1384 (1978).