!
!
Sagar BHATTA
Graduated in Bachelor of Science (Engineering) in Chemical Engineering & Polymer Science
Separation Of Bioactive Peptides From
Whey Hydrolysate Using
Electrodialysis With Ultrafiltration
Membrane: A Pilot-Scale Study And
Investigation On Process Parameters
Dissertation for obtaining the Master degree in Membrane Engineering
Erasmus Mundus Master in Membrane Engineering
Advisor: Laurent Bazinet, Professor, Université Laval
CONFIDENTIAL
Jury
Chair: Isabel Coelhoso, Assistant Professor, UNL
Examiner(s): Partice Bacchin, Professor, UPS
Damien Quemener, Associate Professor, UM
Vlastimil Fila, Assistant Professor, UCTP
Svetlozar Velizarov, Researcher, UNL
Sagar BHATTA
!
Graduated in
+
BACHELOR+OF+SCIENCE+(ENGINEERING)+IN+CHEMICAL+
ENGINEERING+&+POLYMER+SCIENCE+
!!
!!
!!
!
!
!
SEPARATION OF BIOACTIVE
PEPTIDES FROM WHEY
HYDROLYSATE USING
ELECTRODIALYSIS WITH
ULTRAFILTRATION
MEMBRANE: A PILOT-SCALE
STUDY AND INVESTIGATION
ON PROCESS PARAMETERS
!
!
!!!!!!!!!!!!!!!!!!!!
CONFIDENTIAL!
!
!
!!
Dissertation presented to Faculdade de Ciências e Tecnologia, Universidade Nova de Lisboa for obtaining the master degree in Membrane Engineering.
!
!
July 2015!
!
!
!
!
!
!
!
!
!
!
!
!
!
!
!
TITLE: Separation of Bioactive Peptides from whey hydrolysate using
Electrodialysis with Ultrafiltration Membrane: A pilot-scale study and
investigation on process parameters.
The EM3E Master is an Education Programme supported by the European Commission, the European Membrane Society (EMS), the European Membrane House (EMH), and a large international network of industrial companies, research centres and universities (http://www.em3e.eu).
Copyright @ BhattaS, FCT/UNL
A Faculdade de Ciências e Tecnologia e a Universidade Nova de Lisboa têm o direito, perpétuo e sem limites geográficos, de arquivar e publicar esta dissertação através de exemplares impressos reproduzidos em papel ou de forma digital, ou por qualquer outro meio conhecido ou que venha a ser inventado, e de a divulgar através de repositórios científicos e de admitir a sua cópia e distribuição com objectivos educacionais ou de investigação, não comerciais, desde que seja dado crédito ao autor e editor.
Projecto financiado com o apoio da Comissão Europeia. A informação contida nesta publicação vincula exclusivamente o autor, não sendo a Comissão responsável pela utilização que dela possa ser feita.
ACKNOWLEDGEMENTS
I profoundly express my gratitude to my supervisor, Laurent Bazinet, Professor, Department of food science, Institute of Nutrition and Functional Foods, Université Laval, for his motivation, vision, encouragement and moral support throughout this project. This manuscript would not have been completed without his conscientious attention to details and continuous constructive feedback.
I would like to thank Dr. Shyam Suwal for helping me with experiments and giving a critical judgment and advices during this project. I am thankful to Ms. Jacinthe Thibodeau for organizing this project efficiently in Université Laval and giving me practical advice while working in laboratory.
I express my sincere thanks to my EM3E program coordinator Prof. Andre Ayral, UM2- France and co-advisors Prof. Isabel Coelhoso, Prof. João Crespo, UNL for their support and guidance during this program. I am grateful to Dr. Elena Vallejo, Chargée de Projets, UM2, France for being so kind and listening to all problems throughout the entire master program. I express my special thanks to entire professors, research staffs of UM2-France, UPS III-France, ICT- Prague and FCT-UNL-Portugal for providing valuable support during this program.
I greatly appreciate the financial support received from the European Union in the form of scholarship throughout the master program.
Lastly, I would like to thank my family for their patience and everlasting support while studying abroad. I want to thank my brother for his moral support and advice. It would not have been possible without their love, believe and encouragement.
Abstract
A tryptic hydrolysis of whey protein isolate has generated 19 peptides from !-lactoglobulin source, out of 27 peptide sequences detected under HPLC-MS. Amongst 19 peptides, 12 were detected as anionic peptides and 5 as cationic peptides. The aim of this work was to investigate the process parameters for fractionating bioactive peptides from protein hydrolysate by pilot-scale electrodialysis with ultrafiltration membrane (EDUF) unit. Preliminary tests were performed to evaluate process parameters. A pressure-flow relation was studied for establishing no transmembrane pressure. Protein hydrolysate was fractionated during 60 minutes by EDUF on a pilot-scale EUR6 module. Under a constant pH of 6 and electric field strength of 0.7 V/cm, peptide migration rates of 0.57 ± 0.25!!/!!ℎ and
0.29 ± 0.09!!/!!ℎ were achieved in anionic and cationic peptides recovery compartments
respectively. An experiment was also further investigated under two electric field conditions: pulsed electric field (PEF) and reverse polarity (RP) to observe the effect on migration rate and selectivity. Total migration rates were found to be 0.51 ± 0.05 and 0.38 ± 0.15 !/!!ℎ
under PEF and RP conditions, respectively. An application of PEF and RP were able to separate selectively few of peptides. Peptide migration rate and selective separation of peptides found to be strongly depended on electric field strength and pressure/flow rate in each compartment. It is the low electric field and relatively higher pressure that hinders the simultaneous separation of anionic and cationic peptides in their respective compartment. To our knowledge, it was the first attempt to study separation of bioactive peptides from whey protein isolate in a pilot scale EDUF module
.
Keywords: Whey protein hydrolysate, !-lactoglobulin, Bioactive peptides, Electrodialysis, Ultrafiltration membrane, Peptide fractionation.
Index of figures
Figure 3.1 EDUF cell configuration for the simultaneous separation of anionic and cationic peptides+...+15! Figure 3.2 Calibration curve of conductivity as a function of NaCl concentration at room temperature.+....+17! Figure 4.1a A schematic representation of non-symmetric UFM.+...+21! Figure 4.1b Evolution of pressure as a function of flow rate in feed compartment (a,d), A!!" (b, e) and
C!"! (c, f) done only with de-ionized water (a, b, c) and KCl solution (d, e, f) at temperature, T= 37 ,
27 and 17 +...+22! Figure 4.2 I-V curve for determining limiting current density.+...+23! Figure 4.3 Change in current intensity with time during experiment of 60 minute at pH 6 and T=
27 .+...+24! Figure 4.4 Evolution of conductivity in feed (a) and A!!"!compartment (b) during 60 min- EDUF
treatment at pH 6, constant voltage of 10 V and at room temperature.+...+25! Figure 4.5 Concentration of anionic and cationic peptides as a function of time at pH 6, constant
voltage of 10 V and at room temperature.+...+26! Figure 4.6 I-V curve before performing DC, PEF and RP experimental conditions. DC: direct current, PEF: pulsed electric field, RP: reverse polarity.+...+27! Figure 4.7 Evolution of conductivity in feed (a) and A!!"!compartment (b) under DC, PEF and RP
experimental conditions at pH 6+...+28! Figure 4.8 Evolution of peptides concentration in the A!"! under PEF, DC and RP conditions during EDUF treatment at pH 6+...+29! Figure 4.9 Evolution of peptides concentration in the C!"! under PEF, DC and RP conditions during
EDUF treatment at pH 6.+...+30! Figure 4.10 Chromatogram of initial BiPro ( before enzymatic hydrolysis).+...+32! Figure 4.11 Chromatogram of BiPro hyrdolysate.+...+32! Figure 4.12 Chromatogram of peptides obtained in anionic peptide recovery compartment after 60 min of EDUF treatment.+...+34! Figure 4.13 Chromatogram of peptides obtained in cationic peptide recovery compartment after 60 min of EDUF treatment.+...+35! Figure 4.14 Chromatogram of peptides obtained in the A!"! under PEF, DC and RP conditions during EDUF treatment at pH 6.+...+36! Figure 4.15 Chromatograms of peptides obtained in the C!"! !under PEF, DC and RP conditions during
EDUF treatment at pH 6.+...+38!
!
!
!
!
!
!
Index of tables
Table 2.1 Specific physiological function and characteristics of some bioactive milk peptides in milk+...+6!
Table 2.2 Typical physico-chemical properties of whey protein (Adapted from Zydney et al,2000)+...+7!
Table 3.1 Physicochemical properties of membranes.+...+14!
Table 3.2 Preliminary tests done with different test solutions at various experimental conditions.+...+16!
Table 4.1 Peptide migration rates in A!!" and C!"! recovery compartment.+...+31!
Abbreviations
EDUF: Electrodialysis with ultrafiltration membrane ED: Electrodialysis
UFM: Ultrafiltration membrane NF: Nanofiltration
MWCO: Molecular weight cut-off PES: Polyether sulfone
IEM: Ion-exchange membrane AEM: Anion-exchange membrane CEM: Cation-exchange membrane
!!"! : Anionic peptides recovery compartment
!!"!: Cationic peptides recovery compartment
pI: Isoelectric point !-Lg: Beta-Lactoglobulin BSA: Bovine serum albumin
ACE: Angiotensin converting enzyme TMP: Transmembrane pressure
HPLC: High performance liquid chromatography MS: Mass spectroscopy
PEF: Pulsed electric field RP: Reverse polarity
STMR: Stirred-tank membrane reactor
Table of Contents ACKNOWLEDGEMENTS ... i Abstract ... iii Index of figures ... iv Index of tables ... v Abbreviations ... vi 1. Introduction ... 2
1.1 Background and motivation ... 2
1.2 Research objectives ... 3
2. Literature Review ... 5
2.1 Functional food and Nutraceuticals ... 5
2.1.1 Definition ... 5
2.1.2 Protein-precursor of bioactive peptides ... 5
2.1.3 Bioactive peptides from milk ... 6
2.2 Production and fractionation of bioactive peptides ... 7
2.2.1 Production of bioactive peptides ... 8
2.2.2 Separation and purification of bioactive peptides ... 8
3. Materials and Methods ... 14
3.1 Materials ... 14
3.2 EDUF cell configuration ... 14
3.3 Protocols ... 15 3.3.1 Hydrolysis of BiPro ... 15 3.3.2 Preliminary tests ... 16 3.3.3 Electroseparation procedure ... 17 3.4 Analysis method ... 17 3.4.1 Solution conductivity ... 17 3.4.2 pH ... 18
3.4.3 Total peptide concentration determination in liquid samples ... 18
3.4.4 Determination of total peptides in freeze dried sample………..18
3.4.5 Protein and peptide profiles ... 18
4. Results and Discussion ... 20
4.1 Preliminary tests ... 20
4.1.1 Pressure as a function of the flow rate (Case I and Case II) ... 20
4.1.2 Preliminary tests to study electrodialytic parameters (Case III) ... 23
4.2 Effect of application of PEF and RP conditions on peptide migration and selectivity ... 26
4.2.1 I-V curve ... 26
4.2.2 Evolution of conductivities ... 27
4.2.3 Total peptide migration in anionic and cationic compartments ... 29
4.3 Peptide profiles ... 31
4.3.1 Peptides profile & molecular weight of BiPro hydrolysate ... 31
4.3.2 Profiles of peptides recovered in anionic and cationic recovery compartments .... 34
5. Conclusions and Future Perspective ... 40
CHAPTER(1(
INTRODUCTION(
!
!
!
!
!
!
!
!
!
!
!
!
!
!
!
!
!
!
!
!
!
!
!
!
!
!
1. Introduction
1.1 Background and motivation
The use of specific food for the prevention or treatment of diseases in human societies dated back to the ancient ages. Nearly 2500 years ago, Hippocrates stated, “let food be thy medicine and medicine be thy food.” In an ancient time, Indian sage Charaka worked with medicinal qualities of foods and herbs for healing the malfunctioning of the body, which is nowadays called Ayurveda [1]. In the modern society, there is increasing number of health problems like obesity, cancer and cardiovascular diseases which are related to the unhealthy dietary behaviors. Thus, there has been a widespread upsurge of interest among scientists in functional foods and nutraceuticals. Consumers have been increasingly oriented towards healthy foods with a consciousness of interrelation between diet and health. A food that contains bioactive ingredient such as oligosaccharides, minerals, polyunsaturated fatty acids and fibers are considered as functional foods. Therefore, bioactive compounds that are largely found in natural food and plant have been extensively studied.
In the last decade, research has increased in the field of bioactive peptides from milk proteins. Such peptides cover a range of biological and physiological properties that may be important in development of new product of added value. This value added product could be used in replacement of synthetic drugs, particularly in the treatment of chronic diseases such as hypertension, cancer and obesity. Several reviews on bioactive peptides derived from the milk protein have been published recently. For instances, bioactive peptides produced from dairy [2] [3]; ACE inhibitory and opioid peptides from whey [4]. These peptides are encoded within the sequence of native protein. Various methods for isolation and production of bioactive peptides from their natural sources are attempted without losing its bioactivity. It may be generated in vitro by chemical and enzymatic hydrolysis. While enzymatic hydrolysis is more preferable because of high reaction specificity and reduced waste generation. Amongst other enzymes, hydrolysis with trypsin is the mostly used for generating peptides from whey protein since it produces wider range of bioactive peptides [3]. But these generated peptides are low in concentration and hence, their purification and concentration by various separation techniques are needed.
Membrane processes showed a prominent role in the separation of bioactive peptides from hydrolysate. Several studies were reported on the use of enzymatic membrane reactors for the continuous production of protein hydrolysates and peptides separation [5],[6]. In addition, pressure driven processes like ultrafiltration and nanofiltration have also been used to study the separation of peptides based on their molecular sizes. A further enrichment of peptides has been reported by using stepped-UF method [7], where two different MWCO of membrane were used. However, most of the pressure-driven processes have significant limitations such as fouling and poor selectivity. It also lacks the simultaneous separation of cationic and anionic peptides since the pressure-driven separation is mostly governed by size difference than charge of peptides.
Lapointe et al. (2005) reported the selective separation of cationic peptides from β-lactoglobulin using electrical field in nanofiltration membrane. Later, a simultaneous fractionation of cationic and anionic peptides has been successfully achieved by Poulin et al.[8] using electrodialysis with ultrafiltration membrane (EDUF), a process patented by Dr.
Bazinet [9]. Laboratory scale-EDUFs have been successfully investigated for separation and isolation of various bioactive peptides like anticancer and antibacterial from snow crab byproducts, antidiabetic and antihypertensive peptides from flaxseed and antioxidant polyphenol from cranberry juice. Moreover, EDUF has an advantage of lower fouling compared to conventional pressure driven process and no change in selectivity due to cake layer formation.
Despite of its wide application and perspective in the fractionation of bioactive peptides from various food sources, an industrial application of EDUF was still unexplored. In order to use EDUF successfully for an industrial application, an extensive study of process parameter on pilot scale is necessary. A scaling up of laboratory scale can be achieved by studying the influence of electric field strength, MWCO of ultrafiltration membrane (UFM), nature and conductivity of UFMs and configuration in pilot-scale. Different approaches of electric field conditions like reverse polarity (RP) and pulsed electric field (PEF) could be used for minimizing the fouling and scaling in the membrane and study the effect on membrane selectivity. A next step should account for the economic analysis of the process to be used commercially in a large-scale for the separation of bioactive compounds. This present work is to study a separation of peptides generated from tryptic hydrolysis of !-lactoglobulin using pilot-scale EDUF and observe the effect of various electric field on the performance of EDUF process.
1.2 Research objectives
As explained above, the aim of the present work is to produce peptides from an enzymatic hydrolysis of !-lactoglobulin and to investigate the feasibility of pilot-scale EDUF for the simultaneous separation of bioactive peptides using ultrafiltration membranes stacked in a batch recirculation process. The objectives of the current work were to:
(i) perform a preliminary test on pilot-scale EDUF for establishing pressure-flow relation in each compartment,
(ii) study the effect of electrodialytic parameters for the isolation of bioactive peptides from enzymatic hydrolysate of whey protein isolate and,
(iii) investigate the effect of electric fields on the performance of EDUF process, (iv) characterize the peptides in feed hydrolysate and recovery compartments after
CHAPTER(2(
LITERATURE(REVIEW(
!
!
!
!
!
!
!
!
!
!
!
!
!
!
!
!
!
!
!
!
!
!
!
2. Literature Review
2.1 Functional food and Nutraceuticals 2.1.1 Definition
The concept of functional foods has been widely spread as consumers are increasingly aware of the important link between diet and health. A balanced diet plays a vital role in combating chronic diseases and enhancing health. Thus an unbalanced diet and unhealthy eating habits have become major challenges in most of the countries around the world. It has caused a rise in conditions such as obesity, cancer, diabetes, cardiovascular diseases (CVD), osteoarthritis and allergies. For instance, 11 million people in the USA have type-2 diabetes [10]. Moreover, Soedamah-Muthu et al.[11] reported that cardiovascular diseases are the primary causes of death in the Western countries.
Research in the field of functional foods and nutraceuticals has been extensively carried out in the recent years. According to the Institute of Medicine’s Food and Nutrition Board, functional food is defined as “any food or food ingredient that may provide a health benefit beyond the traditional nutrients it contains”. On the other hand nutraceuticals, as defined by Wildman (2000), “are naturally occurring substances in foods which have been found to be effective in the prevention of treatment of one or more diseases, or the improvement of physiological performance, thereby enhancing human health [12].” However there is yet no universal definition of functional food and nutraceuticals.
As understood commonly, functional foods and nutraceuticals include the whole spectrum of foods with disease-preventive and health-promoting properties. Functional foods may be enriched with a specific health beneficial component, vitamin and mineral supplements, herbs, phytochemicals, and probiotics. Nutraceuticals can be derived from plant, animal, and microbial sources, including those from aquatic environment. Among various nutrients found from animal and plant sources, proteins have been broadly identified as sources of physiologically active peptides.
2.1.2 Protein-precursor of bioactive peptides
Bioactive peptides are those protein fragments that have a positive impact on body functions or conditions that may ultimately influence health. The bio-functionality of these peptides depends on their inherent amino acid composition and sequence. The size of peptides usually varies from 2 to 20 amino acids. These peptides are mostly inactive within the sequence of parent protein and can be released during gastrointestinal digestion or food processing. These bioactive peptides carry a wide range of biological, functional and nutritional properties. Depending on the amino acid sequence, these peptides may evoke numerous biological functions in vivo affecting, for instance, the cardiovascular, endocrine, digestive, immune and nervous systems. The beneficial health effects may further be classified as antimicrobial, antioxidant, antithrombotic, antihypertensive, antimicrobial or immunomodulatory, etc [13][14].
2.1.3 Bioactive peptides from milk
Milk is a rich source of protein and also considered as an important source of bioactive peptides. Milk contains critical nutritive elements which are vital to both neonates and adults. Bioactive peptides can be produced from milk proteins through fermentation of milk, whey and ripened cheese. A considerable evidence of multifunctional capacities and bio-specific role of bioactive peptides from milk can be found in the literature ([15], [16], [17], [18]). An overview of primary classes of bioactive milk peptides, based on their specific physiological function and characteristics are presented in Table 2.1. Bioactive peptides evoke immune-defense, neurological, physiological and vasoregulatory responses (Table 2.1).
Table 2.1 Specific physiological function and characteristics of some bioactive milk peptides in milk. (adapted from Claire et al.[19])
No. Peptide sequence Name AA segment Physiological classification
Release Protease Reference
1 FFVAP αs1-Casokinin-5 αs1-CN (f 23–27) ACE inhibitor Proline endopeptidase
[20] 2 AVPYPQR β-Casokinin-7 β-CN (f 177–183) ACE inhibitor Trypsin [20] 3 YGLF α-Lactorphin α-LA (f 50–53) ACE inhibitor and
opioid agonist Synthetic peptide [21] 4 ALPMHIR β-Lactorphin β-LG (f 142–148) ACE inhibitor Trypsin [22] 5 KVLPVPQ Antihypertensive
peptide β-CN (f 169–174) Antihypertensive peptide Lactobacillus CP790 protease [23] 6 MAIPPKKNQDK Casoplatelin κ-CN (f 106–116) Antithrombotic Trypsin & synthetic
peptide [24] 7 KDQDK Thrombin inhibitory peptide κ-CN glyco-macropeptide (f 112-116) Antithrombotic Trypsin [25] 8 KRDS Thrombin inhibitory peptide Lactotransferrin (f 39-42) Antithrombotic Pepsin [26] 9 QMEAESISSS
EEIVPNSVEQK Caseinophospho-peptide αs1-CN (f 59-79) Calcium binding and transport Trypsin [17] 10 LLY Immunopeptide β-CN (f 191–193) Immunostimulatory
(+) Synthetic [27] 11 FKCRRWQWRMK
KLGAPSITCVRRA F
Lactoferricin B Lactoferrin (f 17–
41) Immunomodulatory (+) and antimicrobial Pepsin [28], [29] 12 YQQPVLGPVR β-Casokinin-10 β-CN (f 193–202) Immunomodulatory
(+/-) & ACE inhibitor
Synthetic [30]
13 RYLGYLE α-Casein
exorphin αs1-CN (f 90–96) Opioid agonist Pepsin [31] 14 YGFQNA Serorphin BSA (f 399–404) Opioid agonist Pepsin [32] 15 YLLF-NH2 β-Lactorphin β-LG (f 102–105) Opioid agonist and
ACE inhibitor
Sythetic or Trypsin [21]
16 YIPIQYVLSR Casoxin C κ-CN (f 25–34) Opioid antagonist Trypsin [33] 17 YVPF PPF Casoxin D αs1-CN (f 158–
164) Opioid antagonist Pepsin-chymotrypsin [34] 18 YLGSGY-OCH3 Lactoferroxin A Lactoferrin (f
318-323)
In general, caseins and whey proteins are the two main groups of protein in bovine milk. Each of the sub-fractions found in casein or whey has its own unique biological properties. Caseins are sub-divided into !-, !- and !-caseins that comprises 80 percent of the total protein content in bovine milk. Whey comprises a heterogeneous group of proteins that remains in the supernatant after the precipitation of casein. Whey proteins are composed of ! -lactoglobulin, !-lactalbumin, immunoglobulins (IgGs), glycomacropeptides, bovine serum albumin (BSA), and minor proteins such as lactoperoxidase, lysozyme and lactoferrin. These proteins have a compact globular structure. These proteins are dephosphorylated, insensitive to Ca2+ and easily denatured upon heating at temperature 90℃ [36]. Typical physico-chemical properties of whey protein are tabulated in Table 2.2.
Table 2.2 Typical physico-chemical properties of whey protein (Adapted from Zydney et
al,2000)
Proteins Concentration (g/L) MW (kDa) Isoelectric point (pI)
! − !" 3-4 18.4 5.2
! − !" 1.5 14.2 4.7-5.1
BSA 0.3-0.6 69 4.7-4.9
IgG, IgA, IgM 0.6-0.9 150-1000 5.5-8.3
Lactoperoxidase 0.006 89 9.6
Lactoferrin 0.05 78 8.0
Protease-peptone 0.5 4-20
Caseinomacropeptide 7
! − !" is one of the major source of whey proteins used for the generation of bioactive peptides by microbial fermentation or enzymatic hydrolysis [3], [38]. Bioactivities of these peptides are encoded within the sequence of native protein precursors that can be generated in vitro by enzymatic hydrolysis which further can be purified by various separation techniques and assayed for bioactivity. Over the last decades, various proteases were used to produce bioactive peptides sequences from whey protein. The most commonly used protease for enzymatic digestion of ! − !" is trypsin. A tryptic digestion of ! − !" can produce peptides sequences (f15-20, f102-105 and f142-148) which possess ACE inhibitory activity [22]. In addition to ACE inhibitory activity, trypsin can release hypocholesterolemic peptides [39] of sequence f71-75, bactericidal peptides [40] of sequence f15-20 and f92-100, and peptide sequence f102-105 having opioid activity [17]. These bioactive molecules are usually low in concentration and present in complex matrices, therefore it is necessary to use a suitable method for production and fractionation of these bioactive peptides of interest.
!
2.2 Production and fractionation of bioactive peptides
There is increasing commercial interest in the production of bioactive peptides from various sources. There is a need to develop technologies which retain or even enhance the activity of bioactive peptides in food systems.
2.2.1 Production of bioactive peptides
Biologically active peptides can mainly be produced from milk proteins by microbial fermentation of milk, direct synthesis & DNA recombinant technology and enzymatic hydrolysis. Amongst the various methods, enzymatic hydrolysis is the most commonly and widely used method for production of bioactive peptides from milk. Sometimes, a combination of these methods can be used to produce short bioactive peptides.
2.2.1.1 Enzymatic hydrolysis
Enzymatic hydrolysis is so far the most important and preferred method for the production of bioactive peptides. It involves proteolytic enzymes (also called proteases) for the digestion of native proteins to produce shorter peptides. There are several advantages of proteolytic hydrolysis over chemical hydrolysis [41] which are pointed below:
i) defined product stereochemistry due to the high substrate and reaction specificity of biocatalyst,
ii) mild reaction conditions, and iii) reduced waste generation.
The function of generated peptides from enzymatic hydrolysis mainly depends on the primary sequence of the protein substrate, the specificity of enzyme and digestive conditions. The digestive conditions of hydrolysis depend on pH, temperature, reaction time and degree of hydrolysis [42]. Trypsin, chymotrypsin, pepsin, alcalase, etc are some of the enzymes used to generate bioactive peptides from proteins. Amongst these enzymes, trypsin is the most widely used enzyme for digestion of protein from bovine milk. It is because of its tendency to generate more bioactive peptides even without combining with other enzymes (Weiter et al, 1996). Whey proteins mainly containing β-lactoglobulin and α-lactalbumin are digested by trypsin to produce important bioactive peptides. Trypsin generated bioactive peptides from whey have not only ACE inhibitory properties but also antibacterial activity [22] and hyprocholesterolemic activity [39]. However hydrolysis of native proteins from whey leads to the formation of a complex mixture of peptides, non-hydrolyzed protein fraction and enzyme. In addition, the generated peptides after enzymatic hydrolysis are usually low in concentration. Therefore, an appropriate fractionation and purification method is important for recovery and concentration of peptides of interest for an industrial development.
2.2.2 Separation and purification of bioactive peptides
An efficient technique is crucial to separate and fractionate the bioactive peptides produced either from enzymatic hydrolysis or microbial fermentation method.
2.2.2.1 Chromatographic techniques
Novel membrane separation and ion-exchange chromatographic methods are employed by the emerging dairy ingredient industry. Chromatographic techniques (CTs) used mainly for
peptide purification are ion-exchange chromatography (IEC), size-exclusion chromatography (SEC), affinity chromatography, etc. CTs have advantages of higher sensitivity, purity and quality of final resultant product. These chromatography based techniques are found in industrial scale mostly in pharmaceuticals industry where high purity product is needed. However, it is limited to laboratory research purposes in food industry. Since they are very expensive, time consuming, applicable to only small sample volume and use a large quantity of solvents. Industrial-scale technologies suitable for the commercial production of bioactive whey peptides are consequently vital. Hence, a separation process that can be easily scaled-up for an industrial-scale at low cost using no or less solvent for the peptides separation and purification is needed. This need, therefore, can be achieved by using membrane-based processes.
2.2.2.2 Pressure-driven membrane processes
A number of membrane technologies have been developed and implemented in dairy processing since 1970s. Membrane separation processes were popular in a short span of time due to the fact that they are green technologies, use no solvent and need lower energy input in contrast to conventional methods. In a pressure driven membrane process, membrane pore size and size of particles are key factors since separation is based on size of particles applying a pressure gradient as a driving force. Pressure driven membrane separation processes include microfiltration (MF), ultrafiltration (UF), nanofiltration (NF) and reverse osmosis (RO). Among these, UF and NF are normally used for the separation of bioactive peptides from food and/or milk products.
Enzymatic membrane reactors (EMRs) have been widely studied for the continuous production of protein hydrolysates and peptides. Hydrolysis has been carried out in batch or continuous process using different combinations of membrane reactors and ultrafiltration membranes. Several studies have been reported on the production of bioactive peptides. For instances, Visser et al. [6] investigated continuous production and isolation of peptide fractions from plasmin-degraded !-casein using enzyme recycled reactor. This process has limitation of operating for short period of time as membrane fouling and loss of enzyme activity were observed after longer conversion periods. In addition, Bordenave et al. [5] used an ultrafiltration EMR to concentrate β-lactoglubulin from goat’s whey and recover !-lactalbumin derived peptides. β-Lactoglubulin was concentrated in the retentate while peptides from pepsin hydrolysis were obtained in permeate. They also suggested that a smaller molecular weight cut-off (MWCO) of membrane should be used for better fractionation of the peptides.
Bouhallab et al. [43] observed the effect of UF membrane area and their nature when stirred-tank membrane reactor (STMR) was used for the extraction of an immunomodulatory peptide from a bovine !-casein using chymosin as protease. They observed that feasibility of the process mainly depends on UFM area and its nature. Membrane recycled reactor was applied by Perea et al.[44] to hydrolyze whey proteins by alcalase considering to obtain higher conversion and productivity compared to batch process. However they found that the main limitation with this process was the membrane fouling resulting in reduction of productivity. Similarly, other researches were carried out using an immobilized enzyme reactor for partial
10% to minimize bitterness of hydrolysates. The resulting product contained a mixture of protein and peptides with lower ACE inhibitory activity. However, the main limitations of using membrane reactors employing UFM were membrane fouling with a subsequent decrease in productivity.
In order to use peptides as nutraceuticals, further purification and fractionation of hydrolysates will be required. In the literature, the enrichment of peptides has been found to be carried out mainly by ultrafiltration methods. Turgeon et al. [7] utilized a stepped UF method to limit the range of peptides to the narrow range. They used ultrafiltration membrane with MWCO of 1 and 30 kDa to enrich ACE inhibitory peptides from lactoglobulin and !-lactoglobulin. Gauthier and Pouliot (2003) employed a two-step ultrafiltration process; in the first step using 30 kDa membrane and second step using 1 kDa NF membrane for non-hydrolyzed protein separation and peptides fractionation respectively. Similarly, Butylina et al. [45] also used a combination of UF and NF for the peptides fractionation from sweet whey; first step to retain completely the whey proteins from sweet whey incorporating ultrafiltration membrane of MWCO of 10 kDa, while the resulting permeate fractions were fractionated by nanofiltration with MWCO of 1 kDa.
In previous studies, it was observed that ultrafiltration, nanofiltration and sometimes their combination were extensively used for the purification and fractionation of bioactive peptides. It was also evident that UF and NF significantly lead to a problem of membrane fouling and poor selectivity when fractionating peptides of similar sizes [46]. Bioactive peptides fractionation depending on the size was possible with pressure driven process, but it lacks the ability to separate peptides according to their charges.
2.2.2.3 Electromembrane Processes
Electromembrane processes are one of the innovative fractionation methods and include electrofiltration, which consists of the application of an electrical field in order to further improve and exploit separation by charge difference. It addressed the lacking of peptides separation depending on its charge and significant fouling on UF and NF membrane observed in pressure-driven processes. Peptides fractionation by electromembrane procedure involves a concept of transport of charged peptides by using electrical field.
In 1999, Recio and Vesser [47] used laboratory-scale ion-exchange membrane for the separation of lactoferrin from whey proteins. They achieved a yield of 50%, but it took 24 hours to complete and found to be limited for scalability of this process. Lapointe et al. [48] exploited the application of electrical field in nanofiltration membrane for selective separation of cationic peptides from a tryptic hydrolysate of β-lactoglobulin. However this method lacks an electrolyte recirculation compartment that could prevent pH changes caused by electrolysis of water at the electrodes. This could lead to bioactive peptides susceptible to oxidation when comes in contact with electrodes [49].
An innovative method “electrodialysis with ultrafiltration membrane” (EDUF) for the separation of bioactive peptides has recently been emerged and patented by Bazinet et al. [9]. EDUF is a batch process which allows the migration of molecules according to their charges
and molecular weights, where migration of peptides are solely driven by applied electric field. EDUF configuration consists of ultrafiltration (UFM) and ion-exchange membranes (IEM) stacked in a conventional electrodialysis (ED) cell. Therefore, EDUF process combines the charge selectivity of conventional ED process with size exclusion characteristic of UF membranes [49]. A typical EDUF cell is generally composed of a feed solution compartment corresponding to the solution to be separated and two recovery compartments for anionic (!!"! ) and cationic peptides (!
!"!) which contain a salt solution (KCl) for electrical current
circulation. The same or different MWCO of UFMs can be placed in between ion exchange membranes [50]. There is no transmembrane pressure (TMP) applied during this process. This technology has been found effective in numerous potential applications in the food and bio-pharmaceutical industry for the separation and the recovery of bioactive compounds. Poulin et al. (2006) studied a laboratory-scale EDUF for the simultaneous separation of bioactive peptides from β-lactoglobulin hydrolysate using a configuration of one UFM (20 kDa) between two IEM. Among 40 peptides present in the hydrolysate, 13 peptides were selectively fractionated in different compartments of EDUF cell based on their charges [8]. More recently, Doyen et al. (2011) used two UFMs between IEMs where they reported an anticancer peptide fraction from snow crab byproduct hydrolysate after a selective separation by EDUF with 20 kDa MWCO ultrafiltration membrane. In another study of Doyen et al. (2012), they used two different MWCO of UF (20 kDa and 50 kDa) under electric field strength of 2 and 14 V/cm to recover and concentrate an antibacterial fraction from the snow crab byproduct hydrolysate. In the study made by Roblet et al (2013), it is found that pH modulation can bring an efficient way to concentrate the low molecular weight peptides of 400 Da in the cationic recovery compartment and to limit the diversity of peptides recovered in the anionic peptides recovery compartment. They studied under three controlled pH conditions of 3, 6 and 9.
When compared to conventional technologies, EDUF has many advantages like: (a) it is a green technology since no solvent is used, (b) high selectivity of the process since it separates bioactive peptides based on size/charge in one operation, (c) reduced membrane fouling when charged molecules are only allowed to pass through membrane under applied electric field, unlike pressure driven process, (d) scale-up is simpler by stacking membranes according to the required production and (e) it can be easily integrated with an existing industrial production line.
EDUF technique has showed potential applications for diverse raw matrices, mainly for the separation and purification of bioactive peptides/compounds. Until now EDUF has demonstrated its novelty to fractionate several bioactive compounds such as antioxidant peptides from soy-protein hydrolysate [46], chitosan oligomers [51], [52], antihypertensive peptide from alfalfa white protein hydrolysate [53], antioxidant polyphenols from cranberry juice [54]–[56], antidiabetic and antihypertensive peptides from flaxseed protein hydrolysate [57]. It proved the versatility of EDUF technology is not only limited to separation of bioactive compound from protein source but also from other food sources.
However, a deterioration of process performance due to membrane fouling is a frequently observed problem. As a result, electrodialysis system are often operated in reverse mode, where the polarity of the electrodes is reversed to change the direction of ion movement [58],
minimizing the effect of membrane fouling and scaling. Successful uses of PEF for reducing membrane fouling were reported by Ruiz et al.[60] for protein deposit and Cifuentes-Araya et al.[61] for scaling.
EDUF has been successfully used in the basic laboratory research for bioactive molecules separation and purification. However, scale-up of laboratory scale for an industrial application has not yet been fully examined. Pilot-scale study should be studied to investigate the process parameters before testing an EDUF system at a large scale to carry-out a complete economic analysis of the process.
CHAPTER(3(
MATERIALS(AND(METHODS(
!
!
!
!
!
!
!
!
!
!
!
!
!
!
!
!
!
!
!
!
!
!
!
3. Materials and Methods 3.1 Materials
3.1.1 Chemicals
BiPro, whey protein isolate containing bovine beta-Lactoglobulin (!-Lg) with ≥90 % purity was purchased from Davisco (MN, USA) and bovine pancreatic trypsin, with an activity equal to 11,680 BAEE (!"-Benzoyl-L-Arginine-Ethyl-Ester) unit per mg proteins from Sigma-Aldrich (St. Louis, MO, USA). One BAEE unit produces Δ!!"# of 0.001 per minutes
in 3.2 mL at pH 7.6 at 25 ℃. HCl, NaOH and NaCl were obtained from Fischer Scientific (Montréal, Canada). KCl was provided by VWR International and Na2SO4 by Anachemia Canada Co. (Montréal, Canada).
3.1.2 Membranes
Polyether Sulphone (PES) ultrafiltration membranes (UFMs) with molecular weight cut-off (MWCO) of 100 kDa were purchased from Synder Filtration (USA). Neosepta CMX-SB cationic membranes (CEM) and Neosepta AMX-SB anionic membranes (AEM) were provided by Tokuyama Soda Ltd. (Tokyo, Japan). The physicochemical properties of membranes are enlisted in Table 3.1.
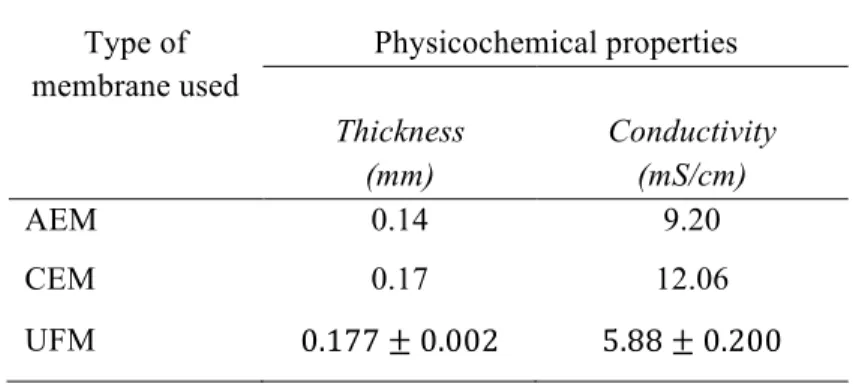
Table 3.1 Physicochemical properties of membranes.
Type of membrane used Physicochemical properties Thickness (mm) Conductivity (mS/cm) AEM 0.14 9.20 CEM 0.17 12.06 UFM 0.177 ± 0.002 5.88 ± 0.200
3.2 EDUF cell configuration
The electrodialysis cell used in this experiment was an EUR6 model, manufactured and configured by Eurodia with a total effective surface area of 0.734 m2. Electrodialysis with ultrafiltration (EDUF) cell consisted of 13 stacks each containing two UFMs sandwiched between ion-exchange membranes (IEMs) as shown in Figure 3.1. Both electrodes (anode and cathode) were made of nickel. A closed flow circulation was maintained with four external compartments using four centrifugal pumps with four external reservoirs. The cell was configured for a simultaneous separation of anionic and cationic peptides. A 3L of feed solution (hydrolysate of BiPro, 10 g/L) in feed compartment was circulated between two UFMs with filtration side facing towards the feed compartment. Next two compartments,
each containing 3L of KCl solution (2 g/L) were dedicated to the recovery of anionic !!"!
peptides and cationic !!"! peptides. The last compartment (electrolyte compartment) for the
electrode rinsing solution contained 3L of Na2SO4 (20 g/L).
Figure 3.1 EDUF cell configuration for the simultaneous separation of anionic and cationic
peptides. AEM: anion-exchange membrane, UFM: Ultrafiltration membrane, CEM: cation-exchange membrane, !!: cationic peptides, !!: anionic peptides,
!!: neutral peptides.
3.3 Protocols
3.3.1 Hydrolysis of BiPro
Hydrolysis of BiPro was carried out in two batches of 20 L. 250 g of BiPro were dissolved in 20L of distilled water maintaining pH 7.8 and left overnight at 4℃. The day after, enzymatic hydrolysis was initiated by adding 100 mL of trypsin solution (25 g/L) at controlled temperature of 37℃ in a double jacket reservoir (Scanima a/s, Aalborg, Denmark) while adjusting pH at 7.8 by adding 1N NaOH throughout an experiment of 120 minutes. The trypsin solution was prepared by weighing 2.5 g of trypsin in 100 mL of milli-Q water (conductivity ≤ 18.2!"/!"). After 120 minutes of enzymatic hydrolysis, tryptic action was inactivated by rising the temperature to 80℃ for 30 minutes. Then the final hydrolysate was freeze-dried and stored at 4℃.
3.3.2 Preliminary tests
Preliminary tests were carried out with three cases to optimize the operational parameters. An overview of the preliminary tests is outlined in Table 3.2. The first two cases were done without applying any voltage in order to observe the effect of flow rate with pressure at different temperature in EDUF cell. Case I: All compartments were filled with de-ionized water. Case II: An aqueous KCl solution (2 g/L, 3 L) was taken in both feed and permeate compartments and Na2SO4 (20 g/L, 3L) as an electrode rinsing solution. Both cases were performed at three different temperatures (37℃, 27℃ and 17℃ ) and the corresponding pressure was noted with increasing flow rate from 0.75 L/min to 3 L/min. Case III: A limiting current density was determined according to the method described by Cowan and Brown [62] and it was found to be 0.43 A/m2. This preliminary test was done with 10 g/L of BiPro hydrolysate solution (3 L), 2 g/L KCL solution (3 L) and 20 g/L Na2SO4 aqueous solution (3L) in feed, peptides recovery and electrolyte compartment respectively. The initial pH of feed solution was manually fixed to 6 by addition of HCl (0.1 N) and a constant electric field of 0.7 V/cm was applied between the two electrodes. The pressure of 10 psi was maintained in recovery and feed compartments to avoid transmembrane pressure in the cell. The experiment was run at room temperature and changes afterward were recorded. 1.5 mL samples were collected from the feed and recovery compartments before applying the voltage and every ten minutes during the experiment of one hour. Current intensity, pH, conductivity and temperature were recorded every ten minutes all along the treatment. The conductivity and pH were controlled by KCl solution (100 g/L) and NaOH solution (1 N) or HCl solution (0.1 N), respectively. A constant electrode solution flow rate of 4 L/min and pressure of 4 psi was kept for all preliminary cases. Three replicates of each experimental condition were performed.
Table 3.2 Preliminary tests done with different test solutions at various experimental
conditions.
Cases
Test Solution in different compartments Experimental conditions
Feed Recovery Electrolyte Voltage Temperature
I DI water DI water DI water NA 17, 27 & 37℃
(3 replicates each) II KCl solution (2 g/L, 3L) KCl solution (2 g/L, 3L) Na2SO4 solution (20 g/L, 3L) NA 17, 27 & 37℃ (3 replicates each) III Hydrolysate (10 g/L, 3L) KCl solution (2 g/L, 3L) Na2SO4 solution (20 g/L, 3L) 10 Volts Room temperature=27℃ (3 replicates) DI water: de-ionized water, NA: not applied
3.3.3 Electroseparation procedure
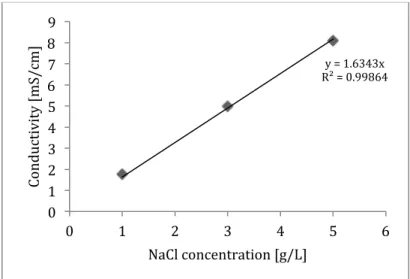
Three different experimental conditions were assessed namely, Direct Current (DC), Pulsed Electric Field (PEF) and Reverse Polarity (RP) to study the effect on migration rates of anionic and cationic peptides in EUR6 cell. The procedure for the three conditions were followed as described in abovementioned case III of preliminary tests except the conductivity of feed solution which was made equal to the permeate compartment by adding 3 g of NaCl solution. A calibration curve of NaCl conductivity as a function of concentration was plotted (shown in Figure 3.2). In this condition the limiting current density was found to be 0.553! ± 0.026!!/!!. EDUF was carried out by using constant voltage of 10 V using a
Xantrex power supply (Model HPD 60-5SX; Burnaby, BC, Canada). A pulse/pause of 2s/0.2s (ratio=10) was applied for PEF and a current application duration of 2s and reverse polarity (RP) of 0.2s was applied for RP. The RP and PEF generation was generated using a one mode generator (Pulsewave 760, Bio-rad, USA). Three replicates of each condition were performed. Membrane cleaning was done with demineralized water between two replicates while complete acid-base-acid cleaning was performed before starting third replicate.
Figure 3.2 Calibration curve of conductivity as a function of NaCl concentration at room
temperature.
3.4 Analysis method 3.4.1 Solution conductivity
The conductivity of feed and permeates (!!!" and !!"! ) was measured using a YSI conductivity meter (Model 3100) equipped with an automatic temperature compensation (ATC) YSI immersion probe model 3252, cell constant K= 1 cm-1 (Yellow Springs Inc, OH, USA). y!=!1.6343x! R²!=!0.99864! 0! 1! 2! 3! 4! 5! 6! 7! 8! 9! 0! 1! 2! 3! 4! 5! 6! Co nd uc ti vi ty ![mS /c m] ! NaCl!concentration![g/L]!
3.4.2 pH
A pH-meter model SP20 (Thermo Orion, West Chester, PA, USA) with a VWR Symphony epoxy gel combined pH electrode (Montréal, Canada) was used.
3.4.3 Total peptide concentration determination in liquid samples
The total peptide migration in !!"! and !!"! was determined using BCATM protein assay (Pierce Biotechnology Inc., Rockford, IL, USA) for all conditions. Samples were prepared in 96 wells microplate (Corning Inc. NY, USA) and incubated at 37℃ for 30 minutes and then cooled at room temperature. The absorbance was read at 562 nm on a microplate spectrophotometer (THERMOmax, Molecular devices, Sunnyvale, CA). The concentration of anionic and cationic peptides was determined with a standard calibration curve in a range of 25-2000 !"/!" of bovine serum albumin (BSA).
3.4.4 Determination of total peptides in freeze dried sample
The initial protein concentration of BiPro before and after hydrolysis was determined by the total nitrogen determination in the samples. Total nitrogen content in the sample was analyzed by combustion of 150 mg sample using a LECO-FP528 carbon and nitrogen analyzer (LECO, St. Joseph, Michigan, USA). Nitrogen content in the samples were converted into protein percentages by multiplying with a conversion factor of 6.38 that is the value commonly used for milk proteins [63].
3.4.5 Protein and peptide profiles
The peptide composition of the initial hydrolysate, !!!" and !!"! was determined by RP-HPLC according to the method of Firdaous et al. [53] which is adapted to the specific conditions of the !-Lg and peptides generated during enzymatic hydrolysis. A sample for analysis was prepared in a 2 ml vial with 0.2 !" PVDF (Canadian Life Science, ON, Canada) filter before passing into system. The system used was an Agilent 1100 series. Peptides were analyzed with a Luna 5 !" C18 column (2 i.d. × 250 mm, Phenomenex, Torrance, CA, USA). Trifluoroacetic acid (TFA) 0.1% (v/v) in water as solvent A and acetonitrile/water/TFA (90%/ 10%/ 0.1% (v/v)) as solvent B were used for elution at a flow rate of 0.2 mL/min. A linear gradient of solvent B, from 3% to 55% in 85 min was used. Peptide elution was monitored at a wavelength of 214 nm [53], [64].
!
!
CHAPTER!4!
RESULTS!AND!DISCUSSION!
!
!
!
!
!
!
!
!
!
!
!
!
!
!
!
!
!
!
!
!
!
4. Results and Discussion 4.1 Preliminary tests
4.1.1 Pressure as a function of the flow rate (Case I and Case II)
As mentioned in Table 3.2, different solutions were tested to verify the relationship between flow rate and pressure in each compartment (Figure 4.1b) of the cell as a function of temperature. Despite of test solutions used, a linear relation between the pressure and flow rate was observed in each compartments at different temperatures. It is observed that the pressure obtained for the respective flow rates in each compartments were slightly higher when test was done with water than KCl solution; 9.56 versus 8.70 psi/L.min-1, 6.84 versus 6.04 psi/L.min-1 and 5.75 versus 5.56 psi/L.min-1 for feed, !
!" ! and !
!"! compartments
respectively. A test done by either solutions (water or KCl) had higher slope in feed compartment than recovery compartments (slope=9.56 with respect to 6.84 and 5.75 for water and slope=8.70 with respect to 6.04 and 5.56 for KCl) which means a respective pressure can be achieved at lower flow rate in feed compartment than recovery compartments. It is also seen that the slope is quite similar (5.75 for water and 5.56 for KCl) in !!"! for both case.
During the test it was noted that the flow rate in feed compartment cannot be increased after attaining certain maximum value; 19 psi at 2.2 L/min for water and 16 psi at 1.8 L/min for KCl.
It was also noticed that there was not a significant effect of temperature in the relation of pressure and flow rate in each compartment. However, the different pressures were observed for the same flow rate in the feed and recovery compartments. At flow rate of 2 L/min, a pressure of 17.5, 12 and 9.6 psi was observed in the case of water solution for feed, !!"! and
!!"! compartments respectively. Similarly, in the case of KCl solution, a pressure of 14, 9.5
and 7.5 psi was found at 1.5 L/min for feed, !!"! and !!"! compartments respectively. The
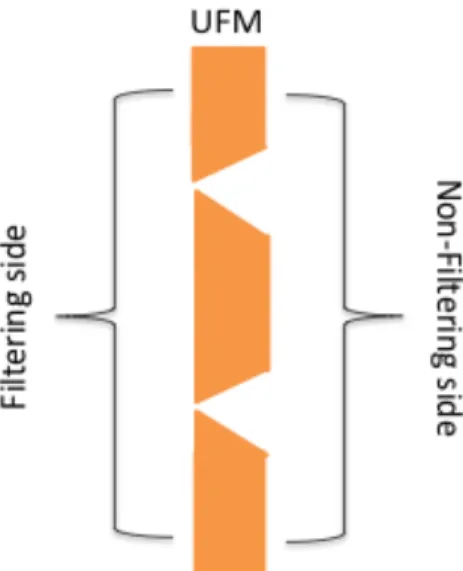
variation in compartmental pressure can be explained due to the presence of different membranes in the configuration and their tendency of loss of charge. Feed stream passes through two ultrafiltration membranes. Ultrafiltration membranes used were asymmetric membrane (as shown in Figure 4.1a). The filtering side of UFMs is smoother than non-filtering side and it is assumed that the presence of roughness in non-non-filtering side affects the flow tendency along the membrane (Suwal et al, 2014). Consequently, this leads to a loss of charge and impact the flow-pressure relation in the compartments. The difference in compartmental pressure may also be due to the compactness of membranes, that is uneven inter-spacing among the membranes.
!
Figure 4.1a A schematic representation of non-symmetric UFM.
Furthermore, it was preferred to maintain the same pressure in feed and recovery compartments to avoid the formation of a transmembrane pressure (TMP). Therefore, the mean pressure of 10 psi was chosen to avoid bubble formation inside the tube of solution flow (in case of lower pressure) and to minimize the external leakage from the cell (in the presence of higher pressure). A room temperature was chosen considering no significant effect of temperature in pressure and flow relation which can also minimize the energy cost. The flow rates required to maintain the pressure of 10 psi at 27℃ (room temperature) in feed, !!"! and !
!"! compartments were found to be 1.08! ± 0.02, 1.63! ± !0.10 and 2.00! ± 0.05
(a) Water (d) KCl
(b) (e)
(c) (f)
Figure 4.1b Evolution of pressure as a function of flow rate in feed compartment (a,d), !!"! (b, e) and !!"! (c, f) done only with de-ionized water (a, b, c) and KCl solution (d, e, f) at temperature, T= 37 , 27 and 17℃. !!"! : anionic peptides recovery
compartment, !!"! : cationic peptides recovery compartment.
!
!
!
Fe
ed
!c
om
pa
rt
m
en
t!
!
!" !!co
m
pa
rt
m
en
t!
!
!" !!co
m
pa
rt
m
en
t!
4.1.2 Preliminary tests to study electrodialytic parameters (Case III)
The section below described the preliminary experiments carried out with BiPro hydrolysate as feed solution. A constant pressure of 10 psi was maintained by adjusting the respective flow rates for different compartments as discussed in the previous section (4.1.1).
4.1.2.1 Limiting current density
I-V curve (Figure 4.2) was used to find the limiting current density for these conditions of experiment. The limiting current density was found at 12 V. The experiment was carried out under the limiting current density at 10 V to avoid water-splitting which has a consequence in energy loss due to water splitting rather than ion transport. In addition, water splitting can change in pH of respective compartment, increase in membrane resistance and change in membrane properties, for instance, OH- can degrade AEM.
A constant pH (data not shown) observed in the feed compartment during the experiment also revealed that the applied current was smaller than limiting current density [65].
4.1.2.2 Evolution of current intensity
Figure 4.3 showed the current intensity increased linearly (R2=0.9979), from initial average value of 0.23! ± 0.02!! to final average value of 0. 33! ± 0.01!!, during the experimental period of 60 minutes.
Figure 4.3 Change in current intensity with time during experiment of 60 minute at pH 6 and
T= 27℃.
4.1.2.3 Solution electrical conductivity
Figure 4.4 represents the changes in solution electrical conductivity in feed (Figure 4.4a) and !!"! compartments (Figure 4.4b) during the 60 minutes of EDUF treatment. The solution
conductivity increased linearly in feed (R2=0.994) and !
!"
! (R2=0.951) compartments: conductivities increased significantly as a function of time from 0.93 ± 0.11 to 1.85 ± 0.08 mS/cm (slope= 0.97) and from 2.49 ± 0.16 to 3.00 ± 0.13 mS/cm (slope= 2.43), respectively, while it decreased in !!"! (data not shown) soon after the voltage was applied to EDUF cell. The conductivity in !!"! was maintained constant at initial value of 2.33 ± 0.05
mS/cm by adding KCl solution (100 g/L) as explained by Suwal et al.[66] since it does not allow increase in local resistance in the cell. In contrast, Poulin et al.[8] has found that the conductivity of !!"! decreased over time, regardless the number of stacks used. Unlike the
current configuration, Poulin et al. [67] had used one UFM (20 kDa) sandwiched between two IEMs that resulted in demineralization of the !!"! compartment at pH 5. Doyen et al.[68]
also reported the decrease in !!"! conductivity using two UFM (50 kDa) sandwiched between
two IEMs at pH 7.8. Though the electrodialytic parameters were different between present and previous studies but the difference in conductivities of feed and recovery compartment mainly can be described with respect to cell stacking. In this study, the configuration of EDUF cell with 13 repetitions of the stack was used while the previous study was made with one single unit. Figure 6 also showed that the conductivity in feed increased by two-fold compared to !!"! than their respective initial value. This can be explained since two ions (!!
and !"!) migrated to feed compartment from ! !" ! and !
!"! compartments respectively, while
only !"! ion remains in ! !"
! since it could not pass through the CEM resulting in its
accumulation and hence to an increase in conductivity. This is also the reason of the increase in current intensity (Figure 4.3) with time during EDUF treatment.
(a)
(b)
Figure 4.4 Evolution of conductivity in feed (a) and !!!" compartment (b) during 60 min-
EDUF treatment at pH 6, constant voltage of 10 V and at room temperature.
4.1.2.4 Evolution of peptide concentrations in !!"! and ! !"
! recovery compartments
Figure 4.5 represents the concentration of peptides in !!!" and !!"! compartments. The peptides concentration in both compartment increased during the treatment of 60 minutes. However the final concentration of peptides in !!"! is two-fold higher than in !
!"! with values
of 196.7 ± 86.7!!"/!" and 84.8 ± 26.9!!"/!" respectively which correspond to peptide migration rates of 0.57 ± 0.25!!/!!ℎ and 0.29 ± 0.09!!/!!ℎ . The difference can be
explained by the fact that a tryptic hydrolysis of !-Lg generates mostly anionic peptides at pH 7.8 [68][69][70] which induces rapid and higher migration rates. Furthermore, the membrane and peptides interaction can also influence the migration rate of peptides. Since the charge of the peptides and membrane surface varies according to the experimental pH. Following these results, a further experimental design was developed to study the effect of electric field conditions, DC, PEF and RP on EDUF peptide migration rates.
Figure 4.5 Concentration of anionic and cationic peptides as a function of time at pH 6,
constant voltage of 10 V and at room temperature.
4.2 Effect of application of PEF and RP conditions on peptide migration and selectivity 4.2.1 I-V curve
!
Figure 4.6 shows the current intensity as a function of voltage before performing an experiment under the conditions of DC, PEF and RP. The limiting current density is observed once again at 10 V. It is due to the presence of electric field as a driving force that reduced the possibility of deposition of uncharged peptides on UFMs unlike the pressure driven processes [8]. Hence, it theoretically means that there was no membrane fouling. As a result, the limiting current density was unchanged even after three repetitions of each condition were carried out.
Figure 4.6 I-V curve before performing DC, PEF and RP experimental conditions. DC: direct
current, PEF: pulsed electric field, RP: reverse polarity.
4.2.2 Evolution of conductivities
Whatever the experimental conditions, the conductivity in feed solution increased linearly with time as shown in Figure 4.7a. 3 g of NaCl was added in feed compartment before starting the experiments in order to increase the initial feed conductivity. Addition of salt in feed also increased the initial current intensity due to the global distribution of conductivity through the feed channels and hence to maintain the constant electric field. As the treatment proceeded the conductivity in feed compartment linearly increased during the 60 min treatment under DC (R2=0.9806), PEF (R2=0.9886) and RP (R2=0.9834) conditions. The increase in feed conductivity can be explained as previously by !! and !"! migration into
the feed compartment from !!"! and !
!"! compartments, respectively. The same tendency had
been found by Doyen et al. [68] even when a single unit was used. Nevertheless, the final feed conductivities for DC, PEF and RP were 3.27 ± 0.49, 2.74 ± 0.02 and 2.65 ± 0.06 mS/cm respectively, but the conductivity is half time higher in DC than PEF and RP. The reason of slower increase in conductivity is due to the pulse and pause effect generated by PEF and reversing the polarity in RP condition. Also, it can be seen in Figure 4.7a where the linear plot of PEF and RP are not so apart with no such significant changes through the treatment period. As a result the movement of ions from recovery compartment to feed compartment are controlled in the case of PEF and RP.
(a)
(b)
Figure 4.7 Evolution of conductivity in feed (a) and !!!" compartment (b) under DC, PEF
and RP experimental conditions at pH 6. !!!": anionic peptides recovery
compartment, DC: direct current, PEF: pulsed electric field, RP: reverse polarity.
The change in conductivity in anionic recovery compartment during the treatment of 60 min is shown in Figure 4.7b. The conductivity in anionic recovery compartment increased rapidly compared to feed compartment. Likewise the conductivity in feed compartment, the final
conductivity under DC current is higher than PEF and RP in anionic recovery compartment. The final conductivity under DC, PEF and RP conditions are reported as 3.76 ± 0.17, 3.34 ± 0.53 and 3.42 ± 0.18 mS/cm, respectively. The rapid increase in conductivity in anionic recovery compartment can be explained by obstruction of movement of Cl- ion from the feed compartment towards the counter electrodes but the presence of CEM on pathway retained the Cl- in anionic recovery compartment. However the PEF and RP conditions have similar linear trend due to the effect of electric field.
4.2.3 Total peptide migration in anionic and cationic compartments
The electrodialytic conditions have affected the final concentration of peptides in anionic and cationic peptide recovery compartments resulting in difference in migration rates (Figure 4.8 and 4.9).
Figure 4.8 Evolution of peptides concentration in the !!!" under PEF, DC and RP conditions
during EDUF treatment at pH 6. !!!": anionic peptide recovery compartment, DC:
direct current, PEF: pulsed electric field, RP: reverse polarity.
A linear trend of peptides concentration in A!!" was attained during the EDUF treatment. It
was observed that peptides migration under DC condition is relatively higher than PEF and RP condition as similar to the trend of conductivity in anionic compartment (Figure 4.7b). The migration rate of peptides in anionic recovery compartment under DC, PEF and RP condition is presented in Table 4.1. Though the peptides migration rate is larger under DC, but PEF and RP showed lower standard deviation. The concentration of peptide in cationic