D
Environmentally
friendly photoanodes
for solar water
splitting
Paula Virgínia Barros Quitério
Doutoramento em Física
Departamento de Física e Astronomia 2020
Orientador
Prof. João Pedro de Esteves de Araújo, FCUP
Coorientador
Dra. Célia Tavares de Sousa, FCUP
Coorientador
Environmentally friendly photoanodes
for solar water splitting
Supervisor: Prof. João Pedro de Esteves de Araújo, FCUP
Co-Supervisor: Dr. Célia Tavares de Sousa, FCUP
Prof. Adélio Mendes, FEUP
Thesis submitted to the Faculty of Sciences of the University of Porto in partial
fulfilment of the requirements for the degree of Doctor in Physics
Department of Physics and Astronomy
Faculty of Sciences of the University of Porto
Funding:
This PhD work was supported by the Fundação para a Ciência e a Tecnologia
(Portuguese Agency for Research) fellowship SFRH/BD/110698/2015, and
STSM grant Marie Sklodowska-Curie Grant Agreement No. 734801, within
the Magnamed Project.
To my mother and my father,
To my sisters and nephews,
To Zé.
À minha mãe e ao meu pai,
Às minhas irmãs e meus sobrinhos,
Ao Zé.
ix
I would like to express my deepest gratitude to everyone who supported me during this thesis, to all of those without whom it wouldn´t have been possible. For all the guidance, help, support, friendship, I am truly thankful. I really hope I am not forgetting anyone.
I would like to sincerely thank my supervisor, Professor João Pedro Araújo for everything, for the opportunity of being part of such a wonderful and prestigious research group, for welcoming me so well (since 2012), as a family, for all the consideration, trust, friendship, help and support during all these years, and for making this work possible.
To my co-supervisor Professor Adélio Mendes, who so kindly welcomed me in his group, for his dedication and support, and for allowing me the opportunity to work in the area of photoelectrochemical cells and to learn about it, I am deeply grateful.
To my co-supervisor Professor Célia Sousa, a fantastic person and supervisor, with a unique and exceptional sense of humour, truly kind and friendly, I must thank her for all the support, dedication and opportunities through all these years and especially during this thesis, for making this work possible. For the enormous friendship, teaching, professional advices, and trust deposited in my work, my gratitude goes beyond words. I would like to thank Arlete Apolinário for being such a good and genuine friend. I must thank her for all the constant support and dedication and for her endless patience during those times (many times) I showed up by her office door with interminable doubts. For all your help, guidance, concern and support my gratitude goes beyond words, and therefore, I also dedicate this work to her.
To David Navas for friendship, good mood and all the support. A special thanks for all the uninterrupted hours at synchrotron and most importantly, for the opportunity to be there!!
I would like to express thanks to Professors Klebert Pirota and Fanny Beron for their hospitality and availability in receiving our team at Unicamp. It was a great experience and an excellent opportunity to learn within this collaboration specialized in alumina and magnetic materials. Also, a big thanks for all help, support, friendship and kindness from Rahul, Alex and Marcus. To Vivian and Suellen for being such great hostesses in Brazil, for all friendship, help and support, and for the great moments sharing a “pastel da feira”, “coxinha” or “bolo de leite ninho”. A special thanks to Suellen for being up all night (and several nights) at synchrotron with me!! To Professor Gustavo, Junior, Daniela and
Santiago from LNLS, also to Marlene and Natalia from LNLS laboratory, who welcomed us so well, for all the technical support and help with XAFS that so much improved the work developed in this thesis, I am deeply grateful. A special thanks to Lucas Rodrigues, who so kindly helped with the XAFS data.
I also want to thank the members of the jury, Professor Olga Caballero, Professor Aurelio Hierro, Professor Bernardo Almeida and Professor José Luís dos Santos for their availability and for taking the time to read this thesis.
I also have to appreciate the CEMUP´s team, especially to Rui Rocha, for his dedication during the SEM sessions, friendship, good mood and above all, professionalism. Also, to Professor Carlos Sá, Daniela Silva and Ana Queirós, for their kindness and support. A special acknowledgment for the opportunity to participate in the SEM sessions with the students at each Summer school.
I would like to thank to Professor Bernardo Almeida for receiving us so well at Minho University, allowing me the opportunity to learn and use the PLD system, and also for his sympathy and kindness. Also, a special thanks to Vivian for her support with PLD.
Also, to Professor Pedro Tavares from UTAD that so kindly teach and helped me with the XRD refinements.
I must express my gratitude to the LEPABE-FEUP team, especially to Paula Dias, João Azevedo for all the support, availability, kindness, and all the help with measurements and technical support with equipment’s at LEPABE. Also, to Tânia Lopes, Luísa Andrade, Mafalda Pereira and Filipe Moisés, I am very thankful for the help, support with the measurements and for their sympathy.
To Sérgio Magalhães, I would like to thank his great dedication to this work, support, help, friendship and kindness to explain such a difficult technique, RBS, that highly improved this work. And to Professor Eduardo Alves for the opportunity of collaboration, his kind words and support.
To Engenheiro Francisco for his dedication, patience, friendship and for all the important knowledge that always transmitted each time (lots) that I had to bother him. To Isabel Alves for her enormous dedication, friendship, patience, promptitude, and efficiency in solving each problem, even when it was not her matter. To Dra. Armanda for her kindness, dedication, promptitude and professionalism. To Fernando for his patience and hard work that put on each autoclave and small pieces I had to ask him to optimize this work. To Florbela, Dona Armanda, Dona Cristina, Dona Filomena, Pedro, Hernani, Dra. Maria, Ângela, Sr. José, Sr. Rui and all security staff, Dona Sandra and cleaning staff, and all the FCUP collaborators who so kindly helped and supported me through all these years.
To all IFIMUP Professors: João Ventura, Armandina Lopes, André Pereira, Agostinho Moreira, Abílio Almeida, Hélder Crespo for their kindness, collaboration, help, friendship and team-spirit. Also, to Professor Moreira and Professor Bessa for their sympathy and kindness.
I am also thankful to former members Maria Susano, Mónica Cerquido, Mariana Proença, Aurélio Hierro, Maria Paz, Pedro Sampaio, Ana Gomes, Vanji, Bolaji, Mourad, Majid, Inês Figueiredo, Nathalie, Joel Puga, Bernardo, Marcelo, Sílvio, Teresa Carvalho, Diogo Costa, Sara Piano, Iuliia, Alvita, Pedro Resende, Ricardo Teixeira and Tiago Leal for their help, support, friendship and kindness.
To all my dear IFIMUP colleagues for their friendship, help support, collaboration, and good moments: Pedrito Rodrigues, Cátia Rodrigues, Suellen Moraes, Ana Pires, Ana Silva, Catarina Dias, Rui Vilarinho, Vivian, João Horta, Gonçalo, Bogdan, Sofia Teixeira, Ricardo Magalhães, Ana Tresguerres, Sofia Caspani, Ludgero, Simão, João Fradet, João Cabaço, Pedro Machado, José Pedro, Mariana Gomes, Manjunath, Rita Veloso, Francisca, Ana Rita, Margarida, Joana, Rui Costa, Mariana Rocha, Leandro Martins, Miguel Canhota, Neenu, Maryam, Jamal, Henrique, and the nanosolar team Afonso, Francisco and Nuno.
To my good friends from other research groups Catarina Cosme, Claúdio Gomes, Vasco, Jisha, Niaz, Robert, André, Balaji, Abbas, Duarte Viveiros, Joana Paiva, Rita Ribeiro and Nuno Pereira, thanks for your true friendship, dedication and support. A special thanks to Catarina Cosme for being such a good friend, always so kind, for being there for me, for the comforting words, even so far away.
To the pilates class, especially to Catarina (for “dragged” me to classes), Isabel, Cristina, Ana, Constança, a big thanks for the friendship and good moments, to “Mestre” Leandro and to “Mestre” Rafael for their friendship and dedication.
To the Mulherendo association, in particular to Susana Fonseca for the excellent work, help and support. To Dr. Hélder Ferreira for all the medical help, without which it would have been very difficult to carry out this PhD, and for the words of encouragement in each consultation “Paulita, how is the PhD going?”. Thank you very much for your dedication to the SNS.
À minha irmã Tina, por seres um pilar na minha vida, por seres uma verdadeira fonte de inspiração, pela amizade e sorrisos, por me dares força e me ajudares a levantar cada vez que me vou abaixo. Apesar de estares longe, nunca me fazes sentir só. À minha irmã Irene, pelo carinho, enorme amizade, dedicação e todo o apoio durante todos estes anos, um grande beijinho. Aos meus cunhados, Jorge e Zé Couto pelo apoio e amizade; um obrigado especial ao Zé Couto e à Dona Ana por toda a ajuda, hospitalidade e apoio que me deram ao longo de todos estes anos de doutoramento.
Aos meus queridos sobrinhos, Joaninha e Jorgito, pela vossa amizade, carinho, por serem tão bons miúdos, e ao meu querido sobrinho e afilhado Gustavo, obrigada por seres tão fixe, seres meu amigo, seres genuíno e poder contar contigo. Sou uma tia muito orgulhosa!! Um agradecimento especial aos meus pequeninos patudos Bolinha, Chico e Quico, obrigado por aparecerem na minha vida, por me encherem de sorrisos e pelos vossos carinhos genuínos. Ao Zé, especialmente por me aturares há tanto tempo (lol), pela tua dedicação, por nunca me deixares ir abaixo, pelo carinho, amizade, e todo o teu apoio, a minha gratidão vai para além das palavras. Aos meus queridos pais, Mariana e Nicolau por serem os grandes pilares da minha vida, pelos sacrifícios, amor incondicional, carinho, compreensão, amizade, por estarem sempre ao meu lado, por poder contar sempre convosco nos bons e maus momentos. Um infinito obrigado.
xiii
O hidrogénio (H2) tem-se tornado uma solução energética de extrema relevância,
devido à necessidade de encontrar uma alternativa para as necessidades energéticas globais e resolver os problemas ambientais associados ao uso dos combustíveis fósseis, representando um combustível limpo e de baixo custo. As células fotoeletroquímicas (PEC) para produzir H2 diretamente a partir de recursos sustentáveis
e limpos, como luz solar e a água, usando semiconductores fotoativos, têm-se tornado uma das formas alternativas mais esperançosas de converter energia solar em energia química. Os avanços rápidos na nanotecnologia permitiram a produção e o desenvolvimento de nanoestruturas que podem atender a esse tipo de demanda.
Um dos maiores desafios é encontrar um semicondutor adequado, que cumpra todos os requisitos para formar um dispositivo fotoeletroquímico sustentável, que reúna eficiência, baixo custo, estabilidade, não-toxicidade e que seja escalável. Entre várias possibilidades existentes, materiais como o óxido de ferro hematite (-Fe2O3), trióxido
de tungsténio (WO3) e dióxido de titânio (TiO2) têm atraído cada vez mais atenção por
reunirem excelentes propriedades.
O uso da configuração 1D com uma elevada organização, como é o caso dos nanotubos (NTs) ou nanofios (NWs), permite uma separação de cargas eficiente e o transporte de eletrões no fotoelétrodo. Para obter essas nanoestruturas, a escolha do método de síntese é também um factor determinante na viabilidade dos dispositivos PEC.
O método hidrotérmico e a anodização electroquímica têm mostrado ser formas simples e de baixo custo para obter nanoestruturas com diferentes morfologias. Neste trabalho de doutoramento, nanoestruturas tais como NTs e NWs de -Fe2O3, e
nanoplacas de WO3 foram produzidas por método hidrotérmico, e NTs de -Fe2O3 e de
TiO2 foram produzidos por anodização. As propriedades morfológicas, estruturais, óticas
e fotoeletroquímicas das nanoestruturas produzidas foram sistematicamente caracterizadas.
A hematite é um material não tóxico, com alta estabilidade química e pequeno hiato energético (2.2 eV), que absorve luz até 600 nm. No entanto, a hematite apresenta várias limitações de desempenho nas células PEC, como a baixa condutividade eletrónica e dos vazios, que levam a perdas de eficiência significativas devido à elevada recombinação de pares lacunas-eletrões. Os NWs de hematite, devido a uma maior
área superficial fotoativa e caminhos mais diretos para o transporte de cargas no fotoânodo, têm sido amplamente explorados na literatura, principalmente numa perspetiva de caracterização fotoeletroquímica. Aqui, explorámos a compreensão físico-química dos NWs de hematite produzidos por método hidrotérmico, seguido pela aplicação de diferentes condições de recozimento, uma etapa considerada crítica para obter a fase de hematite e aperfeiçoar a sua condutividade e cristalinidade. O tempo de recozimento, geralmente um parâmetro desvalorizado, é de particular interesse, pois permite o uso de temperaturas mais baixas (como 600 ºC) com substratos de óxido de estanho dopado com flúor (FTO) consideravelmente mais baratos, com interesse à escala industrial dos dispositivos PEC. As melhores conversões energia solar para corrente, j ~0.9 mA·cm-2 [a 1.45 V vs. RHE (elétrodo de hidrogénio reversível)], foram
obtidas para os NTs de hematite recozidos a 550 ºC (2 h) com um recozimento curto adicional a 800 ºC. No entanto, foi obtida uma foto-performance de ~0.7 mA·cm-2 para
os NTs de hematite recozidos a 600 ºC com tempo prolongado (48 h), valor 35 vezes superior ao obtido com 3 h de recozimento. Nestas condições de maior temperatura e maior tempo de recozimento, os fotoânodos de hematite apresentaram propriedades melhoradas que beneficiam a foto-eficiência, tais como maior cristalinidade e ordenação de ligações atómicas, e uma maior difusão de Sn do substrato FTO, que leva ao aumento da condutividade.
A dopagem intencional da hematite, usando o elemento Ti, é um dos caminhos mais promissores para o melhoramento da eficiência PEC. Neste trabalho, os NWs de hematite dopados com Ti foram fabricados por método hidrotérmico. Investigou-se não apenas o efeito do Ti, mas também a influência da temperatura de recozimento, comparando com os NWs de hematite sem dopante. Neste trabalho, os maiores valores de j ~1.27 mA·cm-2 (a 1.45 V
RHE) foram obtidos com a dopagem de Ti e o recozimento
adicional a 800 ºC, um aumento significativo em comparação com os valores mais baixos de j obtidos com os fotoânodos sem dopante nas mesmas condições de recozimento. Além disso, estes fotoânodos mostraram-se estáveis durante 2 h de medições de fotocorrente contínuas (a 1.23 VRHE). Uma estratégia diferente para
melhorar a condutividade da hematite foi através da incorporação de Sn. Numa colaboração entre o IFIMUP e o IST-CTN (Lisboa), foi possível usar a técnica de implantação iónica (não amplamente disponível) e estudar diferentes fluências e o seu efeito nas propriedades dos NWs de hematite. A fluência revelou afetar significativamente as características morfológicas e estruturais dos NWs de hematite, mas é um caminho promissor para a melhoria da eficiência PEC.
O método hidrotérmico também pôde ser usado para produzir NTs de hematite com sucesso. No entanto, estas nanoestruturas não nucleiam diretamente no FTO, como
acontece com os NWs, formando-se apenas em solução. Em vez disso, cresceram no FTO novas estruturas com morfologias de agulha e esféricas, revelando propriedades interessantes. Comparativamente aos NWs de hematite obtidos a 550 ºC (j = 0.01 mA·cm-2), as nanoagulhas/esferas produziram j ~0.1 mA·cm-2 nas mesmas condições.
Adicionalmente, os NTs formados em solução foram usados para revestir o FTO, testando o uso de polímeros. No entanto, a baixa adesão ao substrato leva ao desprendimento e aos baixos valores de j. Mesmo assim, estas nanoestruturas constituem um trabalho promissor a ser posteriormente desenvolvido.
Outra maneira simples e de baixo custo para o fabrico de NTs de hematite é por anodização eletroquímica, através da qual a forma das nanoestruturas pode ser controlada com precisão. Aqui, explorámos a fabricação de NTs de hematite por anodização rápida de folhas de Fe. Foi estimado o efeito do potencial de anodização nas características morfológicas, como comprimento, espessura da parede, diâmetro dos poros, distância entre poros e porosidade dos NTs. Foi estabelecida uma relação entre as curvas de carga de anodização, o comprimento dos NTs e a porosidade. O regime ideal de anodização para um crescimento mais rápido e organizado de NTs foi encontrado para potenciais de anodização de 20 até 60 V (em que NTs longos com ~4,6 µm podem crescer em apenas 5 minutos), com interesse prático para aplicações PEC. Um valor de fotocorrente de ~0.5 mA·cm-2 (1.23 V
RHE) foi obtido para os fotoânodos
anodizados a 20 V, apresentando um melhor regime de porosidade.
Com uma maior mobilidade de eletrões e comprimentos de difusão de portadores de carga mais longos comparativamente à hematite, o WO3 também é considerado um
material promissor para a separação PEC de água. Aqui, os fotoânodos de WO3 foram
preparados usando várias camadas de nanoplacas obtidas por etapas sequenciais de processos hidrotérmicos e de recozimento. O número de camadas foi testado até atingir uma limitação no desempenho da fotocorrente j. Foi alcançada uma melhoria de j de 0.56 para 0.96 mA·cm-2 (a 1.45 V
RHE), respectivamente de 1 para 5 camadas.
Os NTs de TiO2 possuem propriedades físico-químicas únicas, tornando-os um
material versátil para várias aplicações, permitindo um amplo uso em ambos dispositivos PEC e células solares sensibilizadas com corante (DSC). No IFIMUP, existe um forte conhecimento estabelecido nos últimos anos na nanofabricação de matrizes de alumina nanoporosa e NTs de TiO2. No entanto, ainda existem algumas questões em aberto, em
particular a reutilização de eletrólitos entre anodizações, com interesse para as aplicações industriais. Estudou-se o efeito da re-utilização de eletrólitos em anodizações com diferentes potenciais na morfologia dos NTs (diâmetro e taxa de crescimento), correlacionada com as curvas de anodização. A presença de morfologia estriada (ribs),
aqui obtida com a re-utilização sucessiva do eletrólito, foi reportada pelo seu interesse prático nas aplicações DCS e PEC.
Finalmente, incluímos um capítulo com o trabalho em curso, onde foram desenvolvidos fotoânodos promissores: filmes finos de ferro depositados diretamente no FTO através das técnicas de feixe de eletrões e deposição por feixe de iões. Estes filmes, com espessuras médias na ordem dos 500 nm, são depois utilizados para a formação de NTs de óxido de ferro por anodização. Num outro trabalho, a deposição de filmes finos de Fe (~122 nm) por deposição a laser pulsado também originou valores de
j promissores na ordem dos 0.34 mA·cm-2 (a 1.45 V
RHE). Pretendemos dar continuidade
a este trabalho no futuro, através da otimização das condições de deposição e utilização de dopantes, como Sn ou Ti.
Palavras-chave: Colheita de energia solar, Células fotoeletroquímicas, Semicondutor, Hematite, Trióxido de tungsténio, Dióxido de titânio, Nanofios, Nanotubos, Nanoplacas, Hidrotérmico, Anodização eletroquímica.
xvii
Hydrogen (H2) energy has become of upmost importance due to the imperative
requirements of solving the global energy demand and environmental problems related with the use of fossil fuels, representing a clean and low-cost fuel. Photoelectrochemical (PEC) cells for directly producing H2 from sustainable and clean resources such as
sunlight and water, using photoactive semiconductors are becoming one of the most hopeful alternative ways for converting solar energy into chemical energy. The quick advances in nanotechnology allowed the production and development of nanostructures that can address this kind of demand.
One of the major challenges is to find a suitable semiconductor that fulfills all the requirements for a sustainable PEC device, one that encounters efficiency, low-cost, stability, nontoxicity and scalability. Among several possibilities, materials such as iron oxide hematite (-Fe2O3), tungsten trioxide (WO3) and titanium dioxide (TiO2) have been
attracted increasing attention for gathering outstanding properties.
The use of highly ordered 1D configuration, such as nanotubes (NTs) or nanowires (NWs), allows an efficient charge separation and electron transport inside the photoelectrode. In order to obtain these nanostructures, the choice of the synthesis method is also key factor for the viability of PEC devices.
Hydrothermal method and electrochemical anodization have shown to be simple and low-cost ways to obtain nanostructures with different morphologies. In this PhD work, nanostructures such as -Fe2O3 NWs and NTs, and WO3 nanoplates were produced by
hydrothermal method, while NTs of -Fe2O3 and TiO2 were produced by anodization.
The morphological, structural, optical and photoelectrochemical properties of the produced nanostructures were systematically characterized.
Hematite is a non-toxic material, with high chemical stability and small band gap (2.2 eV), which absorbs light up to 600 nm. However, hematite presents several limitations to PEC´s photoperformance, such as poor conductivity and small hole diffusion length, which lead to significant efficiency losses due to the high electron-hole recombination. Hematite NWs, due to enhanced photoactive surface area, have been widely explored in literature, mainly in a perspective of PEC characterization. Here, we explored the physical-chemical insights of hematite NWs produced by hydrothermal method, followed by different annealing conditions, a critical step to obtain the hematite phase and enhance its conductivity and crystallinity. Annealing time, usually an overlooked
parameter, is of particular interest, since it allows the use of lower temperature (600 ºC) with considerably cheaper fluorine-doped tin oxide (FTO) substrates, important to the scale-up of PEC devices. The best solar-to-current conversions, j ~0.9 mA·cm-2 [at 1.45
V vs. RHE (reversible hydrogen electrode)], were attained for hematite NWs annealed at 550 ºC (2 h) with additional short annealing at high 800 ºC. Nevertheless, a photoperformance ~0.7 mA·cm-2 was also attained for hematite NWs annealed at 600 ºC
with prolonged time (48 h), 35 times higher than sample annealed for 3 h. Under conditions of higher temperature and longer annealing time, the hematite photoanodes showed improved properties that benefit the photoperformance, such as higher crystallinity, enhanced bond ordering, and higher Sn diffusion from FTO substrate, which leads to increased conductivity.
The intentional doping of hematite, using Ti element, is one of the most promising routes towards the PEC´s efficiency enhancement. In this work, hematite NWs doped with Ti were fabricated by hydrothermal method. It was investigated not only the effect of Ti-doping but also the influence of annealing temperature, comparing with hematite NWs without dopant. Highest j value of ~1.27 mA·cm-2 (at 1.45 V
RHE) was obtained with
Ti doping and additional annealing at 800 ºC, a significant increase comparatively with lower j values for photoanodes without dopant with the same annealing conditions. Also, these photoanodes revealed to be stable under 2 h of continuous j measurements (at 1.23 VRHE). A different strategy to improve the hematite´s conductivity was achieved by
incorporation of Sn element. Within a collaboration between IFIMUP and IST-CTN (Lisbon), it was possible to use ion implantation technique (not widely available), and study different fluences and its effect on the properties of hematite NWs. It revealed to significantly affect the morphological and structural features of hematite NWs, but to be a promising way towards the PEC efficiency improvement.
Hydrothermal method was also used to successfully produce hematite NTs. However, these nanostructures did not nucleate upon FTO, as happen with NWs, but were formed in the precursor solution. Instead, new structures with needle and spherical morphologies were grown on the FTO surface, revealing interesting properties. Comparatively with hematite NWs obtained at 550 ºC (j = 0.01 mA·cm-2), the nanoneedles/spheres yielded j
~0.1 mA·cm-2 in the same conditions. Additionally, the NTs formed in solution were
coated on FTO, by testing the use of polymers. However, poor adhesion to substrate lead to detachment and low j values. Nevertheless, these nanostructures constitute a promising work to be further developed.
Hematite nanotubes (NTs) were also fabricated by using another simple and low-cost approach, the electrochemical anodization, in which the shape of NTs can be effectively controlled. Here, a fast anodization of Fe foils was performed. The effect of the
anodization potential in the morphological features, such as length, wall thickness, pore diameter, interpore distance and porosity of the NTs was estimated. A relation between the anodization charge curves, NTs length and porosity was established. The optimum anodization regime for a faster and organized growth of NTs was found for bias voltage from 20 V up to 60 V (in which long nanotubes with ~4.6 µm can grow in just 5 minutes), with practical interest for PEC applications. A j ~0.5 mA·cm-2 (1.23 V
RHE) was achieved
for the 20 V photoanodes that presented an improved porosity regime.
With higher electron mobility and longer charge carrier diffusion lengths comparatively with hematite, WO3 is also considered a promising material for PEC water splitting. Here,
WO3 photoanodes were designed using several layers of nanoplates obtained by
sequential steps of hydrothermal and annealing processes. The number of layers were tested up to a limitation of j performance was achieved. A j improvement, from 0.56 to 0.96 mA·cm-2 (at 1.45 V
RHE) respectively for 1 to 5 layers, was achieved.
TiO2 NTs have unique physical-chemical properties, making them a versatile material
to several applications, allowing a broad use in both dye-sensitized solar cels (DSC) and PEC devices. At IFIMUP, there is a strong know-how established in the recent years in the nanofabrication of alumina nanopores and titania NTs, specifically by Ti anodization. However, there are still some open issues, namely the electrolyte re-utilization between anodizations with interest for industrial applications. It was studied the effect of electrolyte re-use at different bias voltages on the NTs morphology (diameter and growth rate), correlated with the anodization curves. The presence of ribs morphology, here obtained with successive electrolyte re-use, was reported for its practical interest in DCS and PEC´s applications.
Finally, we include ongoing work, with other promising photoanodes developed by using thin films of iron deposited directly on the FTO using electron beam and ion beam deposition techniques. These films (with thicknesses ~500 nm) are then used to form iron oxide NTs by anodization. In another study, the deposition of thin Fe films (~122 nm) by pulsed laser deposition gave rise to promising j values in the order of 0.34 mA·cm-2
(at 1.45 VRHE). Promising photoanodes will be expected, by optimizing the deposition and
annealing conditions and the incorporation of dopants, such as Sn or Ti.
Keywords: Solar energy harvesting, Photoelectrochemical cells, Semiconductor, Hematite, Tungsten trioxide, Titanium dioxide, Nanowires, Nanotubes, Nanoplates, Hydrothermal, Electrochemical anodization.
xxi
Table of Contents
Acknowledgements ... ix
Resumo ... xiii
Abstract... xvii
Table of Contents ... xxi
List of Figures ... xxv
List of Abbreviations and Symbols ... xxxvii
Thesis Outline ... 1
Chapter 1. Introduction ... 5
1.1. Solar Energy Harvesting ... 7
1.2. Hydrogen fuel production and applications ... 8
1.3. Photoelectrochemical (PEC) cells for water splitting: basic working principles ... 10
1.4. Semiconductor materials for PEC cells ... 13
1.4.1. Sustainable materials by bottom-up approaches ... 14
1.4.1.1. Hematite ... 16
1.4.1.1.1. Hematite physical properties ... 18
1.4.1.1.2. Hematite nanostructures ... 22
1.4.1.1.2.1. Hematite nanowires ... 25
1.4.1.1.2.2. Hematite nanotubes ... 27
1.4.1.2. Tungsten trioxide ... 38
1.4.1.2.1. Tungsten trioxide physical properties ... 40
1.4.1.2.2. Tungsten trioxide nanostructures ... 41
1.4.1.2.2.1. Hydrothermal synthesis ... 44
1.4.1.3. Titanium dioxide ... 46
1.4.1.3.1. Titanium dioxide physical properties ... 48
1.4.1.3.2. Titanium dioxide nanotubes ... 49
Chapter 2. Experimental Techniques ... 53
2.1. Materials, Reagents and Samples Preparation ... 55
2.1.1. Material and Reagents ... 55
2.1.2. Samples preparation ... 56
2.2.1. Hydrothermal method ... 57 2.2.2. Electrochemical Anodization ... 59 2.2.3. Thin films deposition ... 60 2.2.3.1. Electron-beam evaporation ... 60 2.2.3.2. Ion beam Deposition ... 61 2.2.3.3. Pulsed Laser Deposition ... 62 2.3. Characterization Techniques ... 64 2.3.1. Morphological Characterization ... 64 2.3.1.1. Scanning Electron Microscopy... 64 2.3.1.1.1. Energy Dispersive X-Ray Spectroscopy ... 66 2.3.2. Structural Characterization ... 67 2.3.2.1. X-Ray Diffraction ... 67 2.3.2.2. Rutherford Backscattering Spectrometry ... 70 2.3.2.3. X-ray Absorption Fine Structure (XAFS) ... 72 2.3.2.3.1. X-ray Absorption Near the Edge Structure (XANES) ... 74 2.3.2.3.2. Extended X-ray Absorption Fine Structure (EXAFS) ... 75 2.3.2.4. Raman scattering ... 77 2.3.3. Photoelectrochemical characterization ... 78 2.3.3.1. j-V curves ... 78 2.3.3.2. Intrinsic Solar to Chemical Conversion Efficiency ... 80 2.3.4. Optical absorption... 80 Chapter 3. Photoelectrochemical Water Splitting: Thermal Annealing Challenges on Hematite Nanowires ... 83 3.1. Overview ... 85 3.2. Experimental details ... 87 3.2.1. Hydrothermal synthesis ... 87 3.3. Results and Discussion ... 88 3.3.1. Photoelectrochemical performance ... 88 3.3.2. Morphological characterization ... 94 3.3.3. Structural characterization ... 96 3.3.4. Optical characterization ... 106 3.4. Conclusions ... 111 Chapter 4. Doping and implantation strategies for hematite nanowires ... 113 4.1. Titanium doping by hydrothermal method ... 115 4.1.1. Overview ... 115 4.1.2. Experimental details ... 116
4.1.3. Results ... 117 4.2. Sn implantation on hematite nanowires ... 127 4.2.1. Overview ... 127 4.2.2. Experimental details ... 128 4.2.3. Results and discussion ... 129 4.3. Conclusions ... 136 Chapter 5. The Insights of Hydrothermal and Anodic Growth of Iron Oxide
Nanotubes ... 139 5.1. Nanotubes by hydrothermal method ... 141 5.1.1. Overview ... 141 5.1.2. Experimental details ... 142 5.1.3. Results and discussion ... 143 5.2. Nanotubes by electrochemical anodization ... 151 5.2.1. Overview ... 151 5.2.2. Experimental details ... 153 5.2.3. Morphological and Structural characterization ... 154 5.2.4. Anodization curves vs. growth rate regimes ... 157 5.2.5. Porosity ... 161 5.2.6. Structural characterization ... 162 5.2.7. Photoelectrochemical characterizations ... 164 5.3. Conclusions ... 166 Chapter 6. Hydrothermal growth of WO3 nanoplates multilayers ... 169
6.1. Overview ... 171 6.2. Experimental details ... 172 6.3. Results and discussion ... 173 6.3.1. Photoelectrochemical performance ... 173 6.3.2. Morphological characterization ... 175 6.3.3. Structural characterization ... 179 6.3.4. Optical characterization ... 181 6.4. Conclusions ... 182 Chapter 7. The effect of electrolyte re-utilization in the growth rate and
morphology of TiO2 nanotubes ... 185
7.1. Overview ... 187 7.2. Experimental details ... 189 7.3. Results and discussion ... 190 7.4. Conclusions ... 195
Chapter 8. Work in Progress ... 197 8.1. Thin films deposition by e-beam evaporation and ion beam deposition .. 199 8.2. Pulsed laser deposition ... 203 8.3. Conclusions and future perspectives ... 205 Chapter 9. Main Conclusions and Perspectives ... 207 9.1. Main Conclusions ... 209 9.2. Perspectives ... 214 Publications related to the PhD work ... 217 Bibliography ... 221
xxv
List of Figures
Figure 1.1. Three routes for conversion of sunlight into fuel or electricity: photosynthesis (left), photoelectrochemical cells (center) and photovoltaics (right). The semiconductor material is represented in blue color and the metallic electrode in green color. (Reprinted with permission of [10]. Copyright © 2001)... 8 Figure 1.2. (a) Scheme of a fuel cell, where hydrogen and oxygen are used to generate electric current to supply the automobile engine (Reprinted with permission of [11]. Copyright © 2012). (b) The new fuel cell vehicle from Toyota, the Mirai model [12]. ... 9 Figure 1.3. Map of solar irradiation in European countries (extracted from [15]). ... 10 Figure 1.4. Schematic illustration of a photoelectrochemical cell, with a n-type semiconductor (hematite). The main water splitting reactions are represented. ... 12 Figure 1.5. Band edge positions of several semiconductors in contact with aqueous electrolyte at pH = 0. Superior and inferior dashed lines indicate respectively the water reduction and oxidation. (Reproduced from Ref. [8], with permission from The Royal Society of Chemistry). ... 14 Figure 1.6. Main pillars of PEC cells sustainability. ... 15 Figure 1.7. Schematic illustration of WO3, -Fe2O3 and TiO2 nanostructured
photoanodes fabricated by hydrothermal and anodization methods. ... 16 Figure 1.8. Schematic illustration of the unit cell of hematite with octahedral face-sharing (left). The magnification (right) represents one face-sharing dimer (Fe2O9), with longer
(yellow) and shorter (brown) Fe-O bonds resulting from the repulsion between the Fe3+
cations (Reprinted with permission from [65]. Copyright © 2010 American Chemical Society). ... 19 Figure 1.9. (a) Spin order in hematite below and above the Morin temperature (TM)
(Reprinted with permission of [42]. Copyright © 2003 Wiley‐VCH Verlag GmbH & Co. KGaA); (b) Magnetic temperature transitions in bulk hematite. ... 20 Figure 1.10. j-V curve of an ideal hematite photoanode [under AM 1.5G 100 mW.cm-2
simulated sunlight (Adapted from [82]. Copyright © 2010 WILEY‐VCH Verlag GmbH & Co. KGaA, Weinheim). ... 21 Figure 1.11. SEM images and respective schemes of different hematite nanostructures grown on the FTO coated glass substrate showing the different morphologies used for PEC water splitting (Reproduced from Ref. [8] with permission from The Royal Society of Chemistry). ... 23 Figure 1.12. (a) Schematic diagram of planar-type photoanodes (thin films) compared with nanostructured hematite (nanowires) (Reproduced from Ref. [8] with permission from The Royal Society of Chemistry). (b) Scheme of electron and hole moves through Fe2O3 nanotube arrays used for H2 generation; comparing with nanoparticles (NPs),
trapping and e--h+ recombination (Reprinted with permission from [89]. Copyright © 2009
American Chemical Society)... 25 Figure 1.13. (a) SEM image of self-assembled hematite nanowires (NWs) grown on fluorine-doped tin oxide (FTO) glass substrate (Adapted with permission from [91]. Copyright © 2001 American Chemical Society). (b) Current density-potential of hematite photoelectrodes with surface modification by photochemical deposited NiFeOx, evidencing a low onset potential [Adapted with permission from [116]. Copyright © 2015, The Author(s)]. (c) Schematic diagram of a photoelectrochemical cell; the photoanode consists in a Pt-doped crystalline hematite thin film with worm-like nanostructure, modified with Co-Pi as an oxygen evolution co-catalyst on its surface [Adapted with permission from [111]. Copyright © 2013, The Author(s)]. ... 27 Figure 1.14. Typical anodization curve for iron (plot of current density vs. time; anodization conditions: 30 V in an ethylene glycol solution containing 0.5 wt% NH4F and
3 vol% H2O); scheme of the four stages of oxide NTs growth corresponding to the
anodization curve transients (Adapted with permission from [89]. Copyright © 2009 American Chemical Society)... 29 Figure 1.15. SEM images of Fe2O3 NTs arrays prepared by anodization of iron in EGWF
solution, at 50 V for 15 min. (a) Top view of the NTs and (b) cross-sectional view of the NTs with about 1.5 m thickness (Republished with permission of © 2009 IOP Publishing, from [83]; permission conveyed through Copyright Clearance Center,Inc). ... 31 Figure 1.16. SEM images of Fe2O3 NTs arrays prepared by anodization of iron in EG
solution + 0.5 wt % NH4F + 3.0% H2O, at 50 V for 180 s at 45 ºC. (a) Top view of the NTs
morphology and (b) cross-sectional view of the NTs with about 2.7 m thickness (Reprinted with permission from [90]. Copyright © 2009 American Chemical Society). 32 Figure 1.17. TEM images of Fe2O3 NTs obtained at 220 °C along the reaction time: (a)
2 h, (b) 8 h, (c) 12 h, and (d) 48 h; (e) schematic illustration of the tube-formation mechanism (from [143]). SEM images of the hematite Fe2O3 NTs with sulfate precursor
prepared with reaction times of (f) 1 h, (g) 24 h and (h) 48 h; (i) XRD spectra of as-prepared hematite tube-in-tube nanostructures (Reprinted with permission from [144]. Copyright © 2007 American Chemical Society). ... 38 Figure 1.18. Scheme of a tandem cell for solar water splitting, with two photocatalytic systems (WO3 and dye-sensitized TiO2 cell) (Reprinted by permission from: Nature [154],
Copyright © 2001, Nature Publishing Group). ... 39 Figure 1.19. (a) Unit cells for the WO3 different phases. (b) WO3 cubic perovskite crystal
structure (Reproduced from [151] with permission from The Royal Society of Chemistry). ... 40 Figure 1.20. SEM images of several WO3 commercial powders, and respective
photoanodes prepared by doctor-blading and after annealing (left). Photocurrents as high as 3.5 mA·cm−2 were obtained, further improved using CH3SO3H electrolyte (right).
(Adapted with permission from [170]. © 2016 WILEY‐VCH Verlag GmbH & Co. KGaA, Weinheim)... 42
Figure 1.21. SEM and TEM images of different nanostructured morphologies of WO3
prepared by hydrothermal method (Reproduced with permission from [148]. Copyright © 2011 WILEY‐VCH Verlag GmbH & Co. KGaA, Weinheim). ... 45 Figure 1.22. Different nanostructures obtained by hydrothermal method: (a) WO3
nanoplate-like array film grown directly on FTO substrate (Reproduced from Ref. [162] with permission from The Royal Society of Chemistry); (b) WO3 nanorods, as-prepared
and annealed with different temperatures (Adapted from Ref. [182] with permission from The Royal Society of Chemistry). ... 46 Figure 1.23. (a) Scheme of a typical dye-sensitized solar cell (DSC) device with a TiO2
photoanode (Reprinted from [194], Copyright © 2012, with permission from Elsevier). (b) Sony prototypes of DSCs, showing appealing variety of colors and designs [196]. ... 47 Figure 1.24. (a) Representations of the structural phases of TiO2: anatase, rutile, and
brookite (Reprinted with permission from [197]. Copyright © 2010 American Chemical Society). ... 48 Figure 1.25. (a) SEM image of TiO2 nanotubes grown at 40 V in DMSO containing 2%
HF and (b) Photocurrent density of 45 µm long nanotubes and corresponding photoconversion, with the maximum value of 16.25% (Adapted with permission from [118]. Copyright © 2006 American Chemical Society). ... 50 Figure 1.26. (a) STEM and (b) SEM images of TiO2 NTs, illustrating the geometrical
parameters: pore diameter (Dp), oxide barrier layer (δb), interpore distance (Dint), outer
diameter (Douter) ([1] - Reproduced by permission of The Royal Society of Chemistry). 51
Figure 2.1. Teflon stainless-steel autoclave for hydrothermal synthesis. ... 58 Figure 2.2. Anodization set-up implemented at IFIMUP-IN (left) and schematic figure (right). ... 59 Figure 2.3. Electron-beam evaporation system used for Fe thin films deposition. ... 61 Figure 2.4. (a) Ion beam deposition (IBD) system at clean-room CEMUP and (b) respective schematic representation (Extracted from [220]). ... 62 Figure 2.5. Schematic representation of pulsed laser deposition system (Reprinted by permission from: Springer Nature [218], Copyright © 2015 Springer-Verlag Berlin Heidelberg). ... 63 Figure 2.6. (a) Scheme of the scanning electron microscope (SEM) components (Adapted from [225], Copyright © 1992 Butterworth-Heinemann, with permission from Elsevier) and (b) cross-section of the different kinds of signals generated by the electron-beam interaction with the sample (Adapted from [227]). ... 65 Figure 2.7. Scanning Electron Microscope, model Quanta 400FEG ESEM/EDAX Genesis X4M, at the CEMUP center from University of Porto (Extracted from [229]). . 66 Figure 2.8. Schematic representation of the Bragg’s relation (Adapted from [234]). .... 68 Figure 2.9. Rigaku® SmartLab XRD (at IFIMUP). On the right, the main components on the inside of the equipment (X-ray tube, a sample holder and an X-ray detector). ... 69 Figure 2.10. Schematic representation of the Grazing Angle X-Ray Diffraction (GAXRD) measurements of hematite NWs samples. ... 69
Figure 2.11. XRD diffractograms of α-Fe2O3 samples annealed at 800 ºC with different
ω angle. ... 70 Figure 2.12. Conceptual layout of a scattering experiment: a beam of alpha particles (4He+) impinges perpendicularly on a target, if sample target is thin, the beam is
transmitted through the thin target with only very little loss and only slightly altered direction of particles. But if the sample is thick, only the particles scattered backward by angles of more than 90° from the incident direction can be detected (Reprinted from [236], Copyright © 1978 ACADEMIC PRESS, INC., with permission from Elsevier). ... 71 Figure 2.13. Schemes representing (a) the photoelectric effect, in which a core level electron is promoted out of the atom, after X-ray absorption and (b) X-ray Absorption measurements; (c) Typical spectrum of XAFS μ(E) for FeO, with the XANES and EXAFS regions identified. (Adapted from [244]). ... 73 Figure 2.14. (a) General overview of synchrotron beam-lines at LNLS and (b) particular overview of XAFS2 beamline. ... 74 Figure 2.15. (a) Scheme and (b) picture of XAFS measurements set-up. ... 75 Figure 2.16. μ0(E) - smooth background function of μ(E), and the edge-step Δμ0(E0)
(Extracted from [244]). ... 76 Figure 2.17. (a) Isolated EXAFS 𝜒(k) for FeO and (b) the k-weighted XAFS k2 𝜒(k).
(Extracted from [244]). ... 76 Figure 2.18. (a) Stokes Raman scattering (ω > ωR). (b) Anti-Stokes Raman scattering
(ω < ωR). (c) Example of Raman-scattering spectrum representing the vibrational
frequencies of a certain molecule (Reproduced from [249] with permission of Cambridge University Press through PLSclear). ... 78 Figure 2.19. (a) Schematic representation of j-V measurement system (Adapted from [86]). Pictures of j-V measurements using a solar simulator Class B, under (b) dark and (c) 1-sun simulated light. ... 79 Figure 3.1. (a) Yellow film layer of iron oxyhydroxide (FeOOH) NWs formed on the top of FTO substrates after hydrothermal process; (b) conversion of FeOOH into hematite (orange film) after the annealing treatment. ... 88 Figure 3.2. j-V characteristic curves for α-Fe2O3 samples with different annealing steps:
(a) set #1 – samples prepared with different temperatures (600-825 °C) for 20 min; (b) set #2: samples prepared with different time (5-25 min) at 800 ºC; (c) set #3 – samples prepared with different time (3-72 h) at 600 °C; (d) set #4: samples prepared with two-step annealing, 550 ºC for 2 h followed by 20 min at 800 ºC, with different heating ramps in the first step: 1-10 ºC, without ramp (WR); (e) set #5 – samples prepared with two-step annealing, 550 °C for 2 h followed by 20 min at 600-825 °C. ... 90 Figure 3.3. Scheme illustrating the difference between (a) back and (b) front-side illumination on a thin film photoanode (adapted from [16]). ... 90 Figure 3.4. (a) j at 1.45 VRHE and (b) Vonset for hematite photoanodes from sets #1, #3
Figure 3.5. (a) j-V curves for the 800 ºC and 48 h photoanodes, obtained in the dark (dashed lines) and simulated solar illumination (solid lines) and the respective photocurrent, Jphoto; (b) photocurrent (Jphoto) as a function of the photopotential (Vphoto);
(c) intrinsic photovoltaic power (Plight) as a function of Vphoto; (d) ISTC efficiencies as a
function of Jphoto. In the secondary y axis on the right, it is plotted the potential (Ulight)
applied to the photoanode under light. ... 93 Figure 3.6. SEM images of (a) FeOOH NWs after the hydrothermal synthesis; (b) illustrative measurement of α-Fe2O3 NWs diameter (D) and (c) cross-section image with
illustrative measurement of NWs thickness (L); α-Fe2O3 NWs with different annealing
temperatures of (d) 550 °C, (e) 700 °C and (e) 800 °C, and different annealing times of (g) 6 h, (h) 24 h and (i) 48 h. In Figures 3 (e), (f), (h) and (i) it is shown the demarked contours (in red) of euhedral structures. ... 95 Figure 3.7. (a) Diameter (D) and (b) thickness (L) of α-Fe2O3 NWs as function of
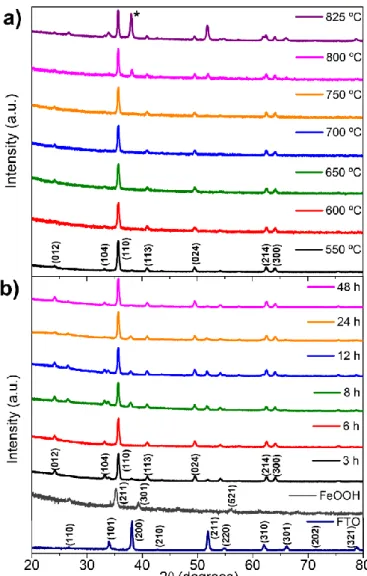
annealing temperature (550-800 °C) and time (3-48 h). ... 95 Figure 3.8. XRD spectra of α-Fe2O3 samples annealed with different (a) temperature
(550-800 °C) and (b) time (3-48 h). The * symbol indicates FTO peak. ... 97 Figure 3.9. XRD refinement spectra of preferential orientation (110) of α-Fe2O3 samples
annealed with different (a) temperatures and (b) time. Insets shows higher magnification of peak (104) refinements. ... 97 Figure 3.10. Linear fits using the Williamson-Hall relationship for representative samples from each annealing set (temperature and time). ... 98 Figure 3.11. Results of photocurrent density (j), crystallite size (DXRD) and NWs diameter
(D) of α-Fe2O3 samples annealed with different (a) temperature and (b) time. ... 99
Figure 3.12. XANES spectra of Fe-oxide references: α-Fe2O3, -Fe2O3 and Fe3O4 (insets
showing in detail the pre-edge and edge peaks). ... 100 Figure 3.13. XANES spectra of hematite NWs with different annealing (a) temperature and (b) time; (c) detail of the pre-edge peaks for hematite NWs with different annealing (c) temperature and d) time. All spectra are compared with the -Fe2O3 reference
powder... 101 Figure 3.14. K3-weigthed Fourier-transforms of Fe K-edge EXAFS functions for hematite
NWs with different annealing (a) temperature and (b) time. ... 102 Figure 3.15. Maximum intensity of peaks Fe-O and Fe-M (from k3-weighted Fourier
transforms of EXAFS functions for Fe k-edge) for hematite NWs with different annealing (a) temperature and (b) time. ... 102 Figure 3.16. RBS spectra of (a) FTO substrate and (b) α-Fe2O3 NWs annealed at 550
°C, 600 °C and 800 °C, and respective fits. ... 105 Figure 3.17. (a) Sn % × simulated thickness determined by RBS fits for samples with 550 °C, 600 °C and 800 °C; b) Voids % (from first layer ~100-200 nm) determined by RBS fits for samples with 550 °C, 600 °C and 800 °C, in comparison with NWs diameter (D). ... 106 Figure 3.18. UV-vis absorption spectra of hematite NWs with different annealing (a) temperature and (b) time. ... 107
Figure 3.19. Comparison between the thickness determined by SEM cross-section images (L) and the thickness estimated by UV-vis absorption (LUV-vis) for hematite NWs
synthesized with different annealing (a) temperature and (b) time. ... 108 Figure 3.20. Porosity (P), calculated from SEM analysis of NWs thickness (L) and thickness from spectrophotometric analysis (LUV-vis), for samples with different (a)
temperature and (b) time, comparing with photocurrent density (j); optical band gap for hematite NWs with different annealing (c) temperature and (d) time. ... 110 Figure 3.21. SEM cross-sectional image of hematite NWs with delimited bulk (dashed white line) and nanowires (reddish) areas. ... 110 Figure 4.1. SEM images of (a) FeOOH NWs after hydrothermal synthesis, α-Fe2O3 NWs
with (b) one-step and (c) two-step annealing (inset exemplifies the diameter, D, measurements). (d) Ti-doped FeOOH NWs after hydrothermal synthesis (inset shows a cross-section image illustrating the thickness L measurements), Ti doped α-Fe2O3 NWs
with (e) one-step and (f) two-step annealing. ... 118 Figure 4.2 α-Fe2O3 NWs (a) diameter (D) and (b) thickness (L) as a function of annealing
temperature, for undoped and Ti doped samples. ... 119 Figure 4.3. XRD diffractograms of non-doped and Ti-doped hematite nanowires, obtained using Bragg-Brentano measurements. ... 120 Figure 4.4. XRD diffractograms of as-prepared hydrothermal FeOOH nanowires (NWs), undoped and Ti-doped hematite NWs, obtained using grazing incidence angle measurements. The spectrum of F:SnO2 (cassiterite) layer from FTO substrate is also
shown. ... 121 Figure 4.5. Raman spectra of undoped and Ti-doped hematite photoelectrodes. ... 122 Figure 4.6. (a) UV-vis absorption spectra and (b) Tauc plots, (αhν)1/2 vs. hν, of undoped
and Ti-doped hematite NWs photoelectrodes. ... 123 Figure 4.7. j-V characteristic curves for undoped and Ti doped α-Fe2O3 samples with
one-step and two-step annealing. ... 124 Figure 4.8. (a) Photocurrent stability test for Ti-doped α-Fe2O3 sample; and (b)
respective j-V curves before and after the stability test. ... 125 Figure 4.9. (a) j-V curves for the Ti-600 ºC, 800 ºC and Ti-800 ºC photoanodes, obtained in the dark (dashed lines) and simulated solar illumination (solid lines) and the respective photocurrent, Jphoto; (b) photocurrent (Jphoto) as a function of the photopotential (Vphoto);
(c) intrinsic photovoltaic power (Plight) as a function of Vphoto; (d) ISTC efficiencies as a
function of Jphoto. In the secondary y axis on the right, it is plotted the potential (Ulight)
applied to the photoanode under light. ... 127 Figure 4.10. Image depicting the result of ion range determination, obtained by SRIM simulation software [284]... 129 Figure 4.11. SEM top images of hematite NWs samples (a) as-implanted with a fluence 1015 ion·cm-2 and (b) after annealing at 550 ºC; (c) as-implanted with a fluence 1017
Figure 4.12. XRD spectra for hematite nanowires implanted with lower and higher Sn fluences: as-implanted and with the second annealing at 550 ºC. Reference hematite, FTO substrate and control sample (hematite NW annealed at 550 ºC for 2 h, without implantation) spectra are also represented. ... 132 Figure 4.13. RBS spectra of α-Fe2O3 (a) control sample (first annealing at 550 °C; 2 h),
(b) as-implanted with low fluence (1015 ions·cm-2) and (c) as-implanted with high fluence
(1017 ions·cm-2). ... 133
Figure 4.14. j-V curves for hematite nanowires as implanted and after the second annealing in (a) front-illumination and (b) back-illumination. ... 135 Figure 4.15. (a) Absorption spectra and (b) Tauc plots, for hematite nanowires as-implanted (with Sn 1015 and 1017 atoms·cm-2) and after the second annealing, comparing
with NWs without implantation. ... 136 Figure 5.1. Iron oxide hydrothermal films deposited on FTO, with and with sulfate (SO4)
precursor reagent, (a) at 220 ºC for 48 h and (b) 220 ºC for 72 h. In each figure, the samples on the right correspond to samples with sulfate precursor. ... 144 Figure 5.2. SEM image of iron oxide nanotubes obtained by hydrothermal method and laid on the top of FTO. ... 144 Figure 5.3. SEM images of iron oxide NTs obtained by hydrothermal method and dispersed on solution, (a) without and (b) with sulfate ion reagent. ... 145 Figure 5.4. Nanotubes coated on the top of FTO substrate: annealed at 550 ºC (a) without sulfate and (b) with sulfate; annealed at 800 ºC (c) without sulfate and (d) with sulfate. ... 146 Figure 5.5. SEM images of nanotubes coated on the top of FTO substrate: annealed at 550 ºC (a) without sulfate and (b) with sulfate; (c) without sulfate, annealed at 800 ºC and (d) with sulfate, annealed at 800 ºC. ... 147 Figure 5.6. SEM images of iron oxide nanostructures obtained by hydrothermal method: (a) nanoneedles and (b) nanospheres, produced respectively without and with sulfate reagent; corresponding cross-sectional images of (c) nanoneedles and (d) nanospheres. ... 148 Figure 5.7. XRD spectra of iron oxide nanotubes (a) formed in suspension with and without SO4; (b) nanoneedles and nanospheres annealed at 550 °C for 2 h. The * symbol
indicates FTO peaks. ... 149 Figure 5.8. Photocurrent density-voltage curves, under dark and 1 sun, of (a) Fe2O3
nanoneedles and nanospheres, and (b) nanotubes with sulfate, all grown by hydrothermal method and annealed at 550°C in air. The nanotubes were obtained in hydrothermal dispersion and were coated on FTO with a doctor-blade. ... 150 Figure 5.9. Top-view SEM images of the Fe2O3 nanotubes (NTs) anodized at (a) 10 V,
(b) 20 V, (c) 30 V, (d) 40 V, (e) 50, (f) 60 V, (g) 70 V, (h) 90 V and (i) 100 V. ... 154 Figure 5.10. Top-view SEM images of the Fe2O3 nanotubes (NTs) anodized at (a) and
(b) 20 V, (c) 30 V, (d) 40 V, (e) 50, (f) 60 V, (g) 70 V and (h)100 V, after annealing at 550 ºC for 2 h. ... 155
Figure 5.11. Interpore distance (Dint), pore diameter (Dp) and wall thickness (W) of Fe2O3
nanotubes as function of applied voltage (Vanod). ... 156
Figure 5.12. SEM cross-section images from Fe2O3 NTs anodized with (a) 30 V, (b) 50
V, (c) 60 V, (d) 70 V, (e) 90 V and (f) 100 V. ... 157 Figure 5.13. (a) Anodization curves monitored during the growth of Fe2O3 NTs arrays,
with variable voltage in the range of 10-100 V; (b) current density mean values (correspondent to stage IV) as a function of the applied voltage (V); (c) charge curves [Q(t) integration of anodization curves] and (d) final charge values, Q, for each Fe2O3
NTs anodized with different voltage. ... 158 Figure 5.14. Fe2O3 NTs arrays thickness estimated from the charge (Q) curves, LQ, and
from SEM cross-sectional images, LSEM, with variable anodization voltage. ... 161
Figure 5.15. (a) Variation of the porosity (P) of Fe2O3 NTs arrays with potential (V). (b)
Relation between nanotubes expected thickness taken from charge curves (LQ) and
porosity (P), in comparison with LSEM effective thickness. ... 162
Figure 5.16. XRD patterns of Fe2O3 NTs arrays anodized at 20-100 V and after
annealing at 550°C in air. The hematite reference and the as-anodized NTs at 60 V (without annealing), are shown for comparison. ... 163 Figure 5.17. Photocurrent density curves, under dark and 1 sun, of Fe2O3 NTs arrays
anodized at 20-100 V, followed by annealing at 550°C in air. ... 164 Figure 5.18. Relation between the photocurrent j (1.45 VRHE) with (a) porosity P, (b)
thickness L, (c) diameter D and (d) wall thickness W of the -Fe2O3 nanotubes (NTs),
anodized at 20-100 V. ... 165 Figure 6.1. j-V characteristic curves for WO3 samples: (a) 1st group (temperature) –
samples prepared with different hydrothermal temperatures (80, 90, 100, 120 and 140 °C) for 12h and with 1 layer; (b) 2nd group (number of layers) – samples prepared with
several layers (1 to 6 layers), i.e. sequential steps of hydrothermal growth, each step (1 layer) during 12 h at 90 °C; (c) 3rd group (time) – samples prepared with different
hydrothermal time (12, 24, 48 and 72 h) at 90 °C with 1 layer; (d) temperature, number of layers and time hydrothermal parameters as a function of j at 1.45 VRHE for the different
groups of samples. ... 174 Figure 6.2. SEM images of the WO3 samples 1st group (temperature) – samples
prepared with different hydrothermal temperatures (80, 90, 100, 120 and 140 °C) for 12 h and 1 layer (a)-(e) top-views and (f)-(k) cross-sectional views. ... 176 Figure 6.3. SEM images of the WO3 samples 2nd group (number of layers) – samples
prepared with several layers [1 to 6 layers, (a) to (f)], i.e. sequential steps of hydrothermal growth, each step (1 layer) during 12 h at 90 °C; top-view insets (higher magnification images). ... 177 Figure 6.4. SEM images of the WO3 samples 2nd group (number of layers) – samples
prepared with several layers [1 - 6 layers, (a) to (f)], i.e. sequential steps of hydrothermal growth, each step (1 layer) during 12 h at 90 °C; cross-sectional views. ... 177
Figure 6.5. SEM images of the WO3 samples 3rd group (time) – samples prepared with
different hydrothermal time (12, 24, 48 and 72 h) at 90 °C with 1 layer; (a)-(d) top-views and (e)-(h) cross-sectional views. ... 178 Figure 6.6. WO3 photoelectrodes thickness (L) as a function of the hydrothermal
parameters: temperature (1st Group), number of layers (2nd Group) and time (3rd Group);
average L extracted from cross-section views of the SEM images. ... 179 Figure 6.7. X-ray diffraction patterns spectra of WO3 photoelectrodes in parallel-beam
focusing method (from top to bottom): 2nd group (number of layers) – samples prepared
with several layers (1 to 6 layers), i.e. sequential steps of hydrothermal growth, each step (1 layer) during 12 h at 90 °C; 3rd group (time) – samples prepared with different
hydrothermal time (12 and 72 h) at 90 °C with 1 layer; The FTO glass substrate spectrum is presented. The diffraction peaks and the corresponding reflections for orthorhombic corresponds to monoclinic WO3 phase (Reference JCPDS 01-083-0950). ... 180
Figure 6.8. UV-vis absorption spectra and the Tauc plots (Eg is the band-gap) of the WO3
photoanodes: (a) and (c) 2nd group (number of layers) – samples prepared with several
layers (1 to 6 layers), i.e. sequential steps of hydrothermal growth, each step (1 layer) during 12 h at 90 °C; (b) and (d) 3rd group (time) – samples prepared with different
hydrothermal time (12 and 72 h) at 90 °C with 1 layer. ... 182 Figure. 7.1. (a) Anodization curves during the growth of TiO2 NT arrays for different
values of bias voltage. (b) Mean value of current density as a function of the applied voltage. (c) Anodization curves for 1st, 2nd and 3rd electrolyte use (for an applied voltage
of 60 V). ... 191 Figure. 7.2. (a) Diameter and (b) length of the TiO2 NTs as a function of the applied
voltage for fresh and re-used electrolytes (for 3 h of anodization). ... 193 Figure. 7.3. SEM images of TiO2 NTs bottom and cross-sectional view (inset), anodized
for 3 hours at 60 V with fresh electrolyte (1st use), representing the measurements for
diameter and length parameters. ... 193 Figure. 7.4. Cross-sectional view of TiO2 NTs obtained by potentiostatic anodization at
60 V and (a) first electrolyte use, (b) second electrolyte use and (c) third electrolyte use. ... 194 Figure 8.1. (a) Optical microscope image and (b) SEM image of as-deposited Fe thin film, revealing several holes and an inhomogeneous deposition. (c) FTO with Fe thin film deposited, showing against-light the holes in the film. ... 200 Figure 8.2. (a) Anodization curves of the Fe thin film anodized at 20 V for 14 min; SEM images of (b) the resulting anodized film, with signs of film detachment, and (c) irregular anodized areas without nanopores. ... 200 Figure 8.3. FTO with Fe thin film deposited by ion beam deposition, showing against-light a homogeneous deposition. ... 201 Figure 8.4. Anodization curves (current density evolution with time) of Fe films with different temperatures. ... 202 Figure 8.5. (a) Fe films after anodization at 35 ºC. (b) SEM images of Fe2O3 NTs. .. 202
Figure 8.7. SEM images of thin films deposited by PLD deposition: (a) with energy of 250 mJ, top-view and (b) cross-sectional view; (c) with energy of 400 mJ, top-view. (d) Top view of FTO substrate. ... 204 Figure 8.8. Fe thin films deposited by PLD after annealing at 550 ºC for 2 h, followed by 800 ºC for 20 min. ... 204 Figure 8.9. Current density-voltage curves of PLD film, measured in the dark and under 1 sun-simulated light. ... 205
xxxv
List of Tables
Table 1.1. Comparison between the experimental conditions, correspondent morphological features and PEC results, reported in literature for Fe electrochemical anodization (performed using ethylene glycol solution containing NH4F and H2O). ... 34
Table 2.1. Conditions used during ion beam deposition. ... 62 Table 2.2. Conditions used during pulsed laser deposition (PLD) of Fe on FTO substrates. ... 63 Table 3.1. Sets of samples prepared with different annealing conditions. ... 88 Table 3.2. Lattice parameters (a, b, c and Vcell) and microstrain (ε) obtained by structural
refinement of XRD; Structural Debye Waller factor (σ2) parameter obtained by EXAFS
fits using Artemis software. ... 103 Table 3.3. Absorption (at 440 and 531 nm), L (SEM) and LUV-vis for samples with different
annealing temperature and time. ... 111 Table 3.4. Optical band gap for hematite NWs with different annealing temperature and time. ... 111 Table 4.1. Crystallite size (DXRD) and microstrain (ε) for hematite NWs with and without
Ti-dopant. ... 122 Table 4.2. Optical band gap for hematite NWs with and without Ti-dopant.... 124 Table 4.3. Diameter (D) and thickness (L) for hematite NWs without and with Sn-implantation ... 131 Table 4.4. Parameters resulting from RBS data simulation of Sn as-implanted photoelectrode with 1017 ions·cm-2. ... 134
Table 4.5. Optical band gap for hematite NWs without and with Sn-implantation. ... 136 Table 5.1. Diameter (D) and thickness (L) of nanoneedles and nanospheres grown on FTO by hydrothermal method... 148 Table 6.1. Groups of WO3 samples prepared with different hydrothermal conditions ...
xxxvii
List of Abbreviations and Symbols
BB, Bragg-Brentano
BSE, backscattered electrons BZ, Brillouin zone
c, Speed of light
CB, Conduction band CE, Counter electrode
D, Diameter
𝑑ℎ𝑘𝑙, plane spacing
Dint, Interpore distance
Dout, Outer diameter
DSC, Dye-sensitized solar cells
Dp, Pore diameter
DXRD, Crystallite size
e-, electron
E, Electric field
EDS, Energy dispersive X-ray spectroscopy
Eg, Band gap
EG, ethylene glycol
EXAFS, Extended X-Ray Absorption Fine Structure
F, Faraday constant FF, Fill-factor
FTO, Fluorine-doped tin oxide FWHM, Full width at half maximum
h, Planck constant
h+, hole
HCPA, Hexagonal close-packed arrays
I0, X-ray intensity incident on a sample
I, X-ray intensity transmitted through the sample
IBD, Ion beam deposition
IPCE, Incident photon-to-current conversion efficiency ISTC, Intrinsic solar to chemical conversion
j, Photocurrent density janod, Current density
JPhoto, Photocurrent density
jmin, Current density minimum
jmax, Current density maximum
L, Length/Thickness
MEA, Membrane Electrode Assembly NPs, Nanoparticles
NTs, Nanotubes NWs, Nanowires
OER, Oxygen Evolution Reaction PAA, Porous anodic alumina PB, Parallel beam
PEC, Photoelectrochemical
PEM, Proton Exchange Membrane PLD, Pulsed Laser Deposition
Plight, intrinsic photovoltaic power
P, Porosity
PV, Photovoltaic
PVD, Physical vapor deposition
Q, Charge
RE, Reference electrode
RBS, Rutherford Backscattering Spectrometry RHE, Reversible hydrogen electrode
RT, Room temperature
SCE, Standard calomel electrode SE, Secondary electrons
SEM, Scanning Electron Microscopy
SRIM, Stopping and Range of Ions in Matter TC, Curie temperature
TM, Morin transition
UV, Ultra-violet
Udark, Potential necessary to reach the same current in dark
V, Voltage
Vanod, Anodization voltage
Vcell, Volume of the unit cell
Vonset, Onset potential
VPhoto, Photopotential
VRHE, Voltage vs. RHE (reversible hydrogen electrode)
w, Full width at half-maximum (FWHM) of Bragg peaks W, Wall thickness
WE, Working electrode
XAFS, X-ray absorption fine structure
XANES, X-ray absorption near the edge structure XPS, X-ray photoelectron spectroscopy
XRD, X-ray diffraction
ΔEº, Standard electric potential ΔGº, Standard Gibbs free energy
θ, Diffraction angle ηel, Electrolysis efficiency
σ2, Debye–Waller factor
, Wavelength of irradiation
ε, Microstrain
δb, Oxide barrier layer
, Frequency
μ, Absorption coefficient
𝜒(k), Oscillations as a function of the photo-electron wave number
, Viscosity
ωvib, Vibrational frequencies of the molecules
ωR, Frequency of photon emitted by a sample


![Figure 1.17. TEM images of Fe 2 O 3 NTs obtained at 220 °C along the reaction time: (a) 2 h, (b) 8 h, (c) 12 h, and (d) 48 h; (e) schematic illustration of the tube-formation mechanism (from [143])](https://thumb-eu.123doks.com/thumbv2/123dok_br/16011034.1103821/78.892.128.749.105.505/figure-images-obtained-reaction-schematic-illustration-formation-mechanism.webp)
![Figure 1.18. Scheme of a tandem cell for solar water splitting, with two photocatalytic systems (WO 3 and dye-sensitized TiO 2 cell) (Reprinted by permission from: Nature [154], Copyright © 2001, Nature Publishing Group).](https://thumb-eu.123doks.com/thumbv2/123dok_br/16011034.1103821/79.892.296.602.635.995/figure-splitting-photocatalytic-sensitized-reprinted-permission-copyright-publishing.webp)