Interplay between the potential of photovoltaic systems and
1
agricultural land use
2
Luís Dias*, João Pedro Gouveia, Paulo Lourenço, Júlia Seixas 3
4
CENSE – Center for Environmental and Sustainability Research, NOVA School of Science 5
and Technology, NOVA University Lisbon 6
7
*Corresponding author. Address: CENSE – Center for Environmental and Sustainability 8
Research, NOVA School of Science and Technology, NOVA University Lisbon 2829-516 9
Caparica, Portugal 10
Tel.:+351 21 294 83 74
11
E-mail address: [email protected] (Dias, L.) 12
13
Highlights
14• Technical potential for utility-scale solar PV projects in rural areas is assessed. 15
• Agriculture and nature conservation land use shorten solar PV farms potential. 16
• Limited PV potential ca still cover substantial shares of local annual electricity consumption. 17
• 1 MW CPV projects show the highest land-use efficiency and productivity. 18
• PV contributes significantly to region energy independence. 19
20
Abstract
21The recent decrease in solar photovoltaic (PV) investment cost has transformed the 22
attractiveness of the technology. Southern Europe has one of the highest levels of solar radiation 23
in the world, and policy makers are very keen to take full advantage of this resource for 24
electricity and heat production. However, physiographic characteristics and specific land uses 25
(e.g. agro-forestry and nature conservation) present important spatial constraints. This paper 26
proposes a methodology for the evaluation of utility-scale solar PV projects’ (>1 MW) technical 27
potential. The municipality of Évora (Portugal) was used as a case study, considering 28
topographical features and spatial planning regulations. Three compatible scenarios for solar 29
PV farms and other competing land uses were studied. The assessment was carried out using a 30
geographic information system and statistical tools. It was conducted for four sizes of PV 31
project (1, 10, 20 and 30 MW) consisting of two different technology types: concentrated PV 32
and crystalline-silicon tracking PV. Concentrated PV 1 MW projects were found to have greater 33
adaptability for use in available areas dispersed throughout the territory, while preserving land 34
for agriculture and nature conservation. The scenario with land primacy for agricultural 35
purposes reduced PV technical potential by more than half (from 2494 to 1116 MW). 36
Nevertheless, the remaining potential was sufficient to cover substantial shares of local annual 37
electricity consumption. The results provided support for future spatial planning regulations 38
and local sustainable energy action plans. 39
Keywords
41Solar Photovoltaic Potential; Competing Land Uses; Geographic Information System, Agro-42
Forestry; Nature Conservation 43
44
1. Introduction
45Solar photovoltaic (PV) technologies are seen worldwide as an essential part of any power 46
sector technology portfolio aiming for climate change mitigation and energy security (e.g. 47
AMPERE, 2015; Greenpeace, 2015; IEA, 2017, Hawken et al., 2017). PV contribution to 48
electricity generation has increased in numerous countries: e.g. 7% of Germany’s net electricity 49
consumption in 2014 (EEA, 2016; Wirth, 2015), 8% in Italy, 3.8% in Spain, and 2.5% in Japan 50
(IEA-PVPS, 2015; Jäger-Waldau, 2016). Total worldwide PV-installed capacity reached 177 51
GW in 2014 (IEA-PVPS, 2015) and 219 GW in 2015 (IRENA, 2017). This value is expected 52
to increase to 1519 GW in 2040 corresponding to an average annual growth rate of 9.3% (from 53
2013 to 2040) for a global average temperature increase of 2ºC (IEA, 2015). 54
The solar energy received by the Earth in one day (120000 Terawatts) has the capacity to meet 55
global energy demand for 20 years (Chu & Meisen, 2011). This potential is especially evident 56
in the case study region (see following section 2.1) with a high number of daylight hours (2200 57
to 3000 in the Iberian Peninsula) and high daily irradiance (5000 W/m2/day). The Southern
58
Iberian Peninsula has the highest level of global horizontal irradiation (GHI) in Europe (Figure 59
1). Despite the region’s high solar resource availability, its exploitation is still considerably 60
untapped. This fact is amplified when compared with the PV-installation capacity of countries 61
with fewer available solar resources. For example, Germany in 2014 was the world leader in 62
PV installed capacity (IEA-PVPS, 2015). In 2015, China and Japan overtook Germany’s pole-63
position (IEA, 2017; Jäger-Waldau, 2016). 64
From an economic perspective, the cost of PV systems has declined significantly in the last 65
decade. In various countries, grid parity1 was reached in 2013 (IEA, 2014). The levelised costs
66
of electricity (LCOE) for solar PV (large, ground-mounted) reached 8 ct€/kWh at the end of 67
2016 in Germany. Moreover, the energy payback time for Concentrator Photovoltaic (CPV) 68
systems in southern Europe is now less than one year (Fraunhofer, 2017). 69
1 Grid parity refers to the moment when an alternative energy source can produce power at a levelized cost of
70
Figure 1 - Global horizontal irradiation (GHI) in Europe and Portugal. The star in the map on the left
71
denotes the location of the case study region (municipality of Évora) (Solargis, 2018).
72
The LCOE for solar PV (large, ground-mounted) in Portugal in 2014 was lower than for a 73
combined cycle powerplant (90 €/MWh and 91.30 €/MWh, respectively), considering a 7% 74
discount rate (IEA/NEA, 2015). In Portugal the breakthrough of PV technology occurred in 75
2008 with the installation of 47 MW of capacity. Of this, 37 MW were utility-scale facilities 76
(compared with only 15 MW in 2007) and 10 MW were micro-generation2 systems. The total
77
PV installation capacity reached 852 MW in 2017, from which 395 MW were utility-scale 78
projects (DGEG, 2015a; DGEG, 2018). Current installed capacity lags behind the objectives 79
set out in the National Renewable Energy Action Plan (NREAP): 720 MW in 2020 (PNAER, 80
2013), 2.7 GW in 2030 (Seixas et al., 2014), and 9.3 GW in 2050 (Seixas et al., 2012). The 81
under-developed PV market gold mine in this region exemplifies the importance of solar PV 82
technical potential assessments. Nevertheless, the consideration of competing land uses was 83
necessary, as it may restrict the large deployment of PV projects. 84
Renewable energy technical potential refers to the available energy resource, while considering 85
various determinants, such as technology conversion efficiency, technical limitations, the 86
available land to install it upon, and ancillary features (Resch et al., 2008). For most resources, 87
the technical potential is dynamic, meaning that if technological efficiency can be improved, 88
so can technical potential. 89
Different methodologies and tools have been used to assess the technical potential of utility-90
scale solar PV projects in diverse regions (Vieira et al., 2016). Janke (2010) used multicriteria 91
methods in a geographic information system (GIS) model to determine which land cover classes 92
had high solar resource potential and which areas were suitable for wind and solar farms. Arán 93
Carrión et al. (2008) and Uyan (2013) applied a decision-support system for the selection of 94
optimal sites for large and grid-connected PV plants, considering land use, agricultural land, 95
and protected areas. Gunderson et al. (2014) used a fuzzy logic approach to study potential sites 96
in the Black Sea region suitable for PV power plants. Sliz-Szkliniarz (2013) quantified the 97
2 Micro generation – Decree-Law n. º 363/2007, November 2nd, updated by the Decree-Law n. º 118-A/2010,
potentials of different renewable energy sources for electricity generation (RES-E) to explore 98
potential planning issues associated with the development. Although methods to assess the 99
technical potential of utility-scale solar PV projects are standard procedures, little attention was 100
given to possible conflicts between PV plants and agro-forestry production. In this manner, 101
Sacchelli et al. (2016) conducted a comprehensive literature review on PV energy versus food 102
production trade-offs. The impact of the PV systems’ economic profitability was related to local 103
characteristics and crop yields. The local characteristics included the disposal of non-irrigated 104
arable land and the presence of constraints, particularly landscape maintenance, morphological 105
variables, and the specialization index. Important work has been carried out on this topic, but 106
significant improvement in understanding potential conflicts at the micro-scale is needed. 107
Detailed analysis into the local interplay between policies, land uses, and solar PV technical 108
potential is essential. In an assessment of the 28 member States in Europe, Perpiña Castillo et 109
al. (2016) focused on the regional potential for solar power generation, highlighting the absence 110
of similar studies to compare and validate results. 111
Innovative solutions to overcome this challenge are increasing. Dinesh and Pearce (2016) and 112
Dupraz et al. (2011) analysed the concept of co-developing the same land area for both solar 113
PV power and conventional agriculture. Although the conclusion proved that the concept was 114
a viable solution for locations with intense competition for land resources, it was restricted to 115
shade-tolerant crops. 116
Solar energy potential assessments in urban Portugal have increased, specifically on building 117
roofs and façades (Brito et al., 2012; Redweik et al., 2013). However, no assessment has been 118
made focusing on utility-scale PV. Spatial regulations constrain the eligible areas and 119
consequent PV project implementation levels. Additionally, it is necessary to consider the PV 120
project’s compatibility with agricultural land and nature conservation areas. Within this work, 121
nature conservation refers to preservation-based natural habitats and ecosystem protection land 122
use, especially from human exploitation (further details in section 2.2.1). 123
The overall objective of this paper is to present the technical solar PV power potential at the 124
utility-scale level, using a case study region with a high solar irradiation level and significant 125
agricultural land areas. This work also aims to analyse the competition for land use between 126
PV deployment, agro-forestry, and nature conservation. A combination of three competing 127
land-use scenarios with two different PV technologies were used: concentrated PV (CPV) and 128
crystalline-silicon tracking PV (Ci-Si track) with four project sizes (1, 10, 20 and 30 MW). 129
130 131
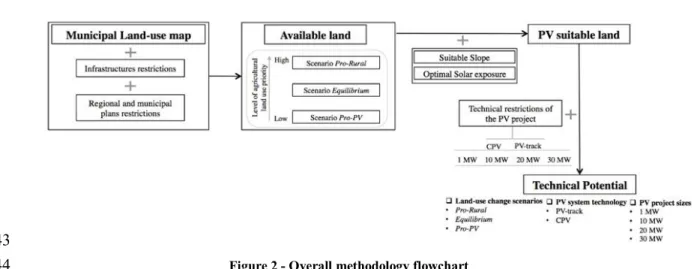
2. Methodology
132This section describes the methodology used to assess the technical potential for utility-scale 133
solar PV in a rural area in southwestern Europe – specifically Évora municipality in Portugal. 134
The framework applied to Évora municipality (section 2.1) was comprised of two main phases: 135
1) Location and quantification of suitable areas for PV system installation, considering 136
land-use regulations and competition scenarios (section 2.2); 137
2) Quantification of corresponding potential installed capacity and electricity generation, 138
accounting for two generic PV technologies and four different plant sizes (section 2.3). 139
The analysis used ArcGIS software3 to address multiple and diverse spatial and thematic
140
variables (e.g. terrain slope, protected natural areas, and solar exposure). Figure 2 presents the 141
overall methodology flowchart. 142
143
Figure 2 - Overall methodology flowchart
144 145
2.1 Case Study
146Évora municipality is located in the Alentejo region of Portugal (latitude 38°34′00″ N, 147
longitude 7°54′00″ W) covering 1307 km2 and with approximately 57000 inhabitants (INE,
148
2011). The reasons it was selected as a case study were: 149
1) It is one of the European regions with the highest solar irradiance; 150
2) It has an extensive wide open rural area of 70000 ha, covering 54% of the total area 151
(130700 ha) (CME, 2014); 152
3) The municipality is fully committed to a transition to a low carbon energy system 153
(Évora is a signatory member of the Covenant of Mayors for Climate & Energy); 154
4) It was the first city in Portugal equipped with a massive electricity smart metering 155
system (over 31000 smart meters) (EDP, 2015); 156
5) It has been used for several studies on smart cities (Simoes et al., 2018), grid 157
management, smart meter data analysis, and consumer profiles (Gouveia and Seixas, 158
2016; Gouveia et al., 2017, Gouveia et al., 2018), and solar PV rooftop assessment 159
(Moreira, 2016). 160
In 2017, there were four solar PV farms in the Évora municipality, with a combined total of 161
12.4 MW. There are two types of technologies in place. One 1.3 MW concentrated PV facility 162
has been in operation since 2014, and another 1.1 MW facility of PV cells (Cycloid unit) has 163
been operational since 2012. There were also 239 small solar PV installations (<1 MW), 164
accounting for 1.2 MW in 2014 (MEE, 2015). The Évora municipality consumed 261 GWh of 165
electricity (DGEG, 2015b) in 2013, representing only 0.5% of total national consumption. 166
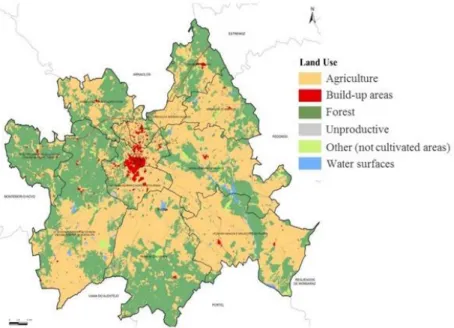
The case study region has important agro-forestry resources. The rural areas are mainly 167
cultivated with cereals, pasture and forest patches of cork and holm oak. Olive groves, 168
vineyards, and irrigated crops complete the diversity of this region (CME, 2014) (Figure 3). 169
Cork forest represents an important economic contribution to the Mediterranean region 170
(González-García et al., 2013). Portugal has the largest area of cork oak forest in the world at 171
737 ha, and 84% is within the Alentejo region (APCOR, 2014) where Évora is located. 50% of 172
total world cork production (APCOR, 2014) takes place in Alentejo, adding 30% gross value 173
to the national silvicultural and forest exploitation activities sector (INE, 2013a). The cork 174
industry also provides employment across its supply chain and stimulates the establishment of 175
companies in close proximity to the production location (Sierra-Pérez et al., 2015). 176
Likewise, vineyards are predominant in the region with relevant social-economic benefits for 177
the local population. Vineyards also provide important national income through exportation, 178
which was 725 M€ in 2013 (INE, 2013b). This type of crop generates local direct and indirect 179
employment opportunities along its production chain, as well as tourism opportunities. The 180
municipality of Évora is home to many national wine-producing brands. 181
Therefore, although the region has ideal conditions for PV deployment (demonstrated by the 182
number of projects in place and the GHI level), the agricultural and forestry land uses impose 183
competition. 184
A combination of these factors justifies the necessity for further investigation in the area. 185
186
187
Figure 3 – Évora municipality land-use map (adapted from CME (2014))
188
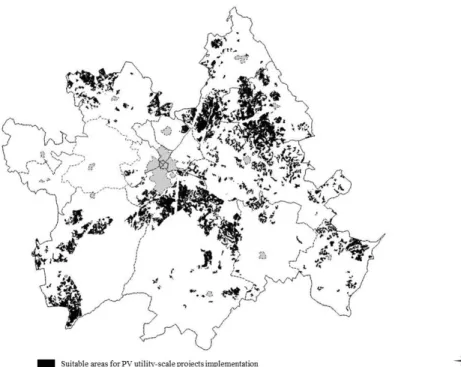
2.2 Land for Utility-Scale PV Systems
189The first step in estimating the technical potential for PV utility-scale projects is to locate and 190
quantify the available and suitable land area. Available area (Figure 4) refers to the rural land 191
with eligible characteristics for PV project installation. The determinants to identify the amount 192
of available area are: the land-use regulations in place (local planning) constraining the uses 193
and categories of land-use where the implementation of large-scale PV projects are not 194
permitted (e.g. urban areas, road and rail networks, water lines, dam reservoirs, and flood 195
zones). The suitable area is a refinement of the available area with adequate terrain conditions 196
(e.g. slope and solar exposure) (Figure 5). The following sections describe the constraints 197
(physical and regulatory) that set the basis for the potential available land area for large-scale 198
PV system installation. 199
200
Figure 4 –Available areas for PV utility-scale project implementation in the Évora municipality
201
202
Figure 5 – Suitable areas for PV utility-scale project implementation in the Évora municipality
203
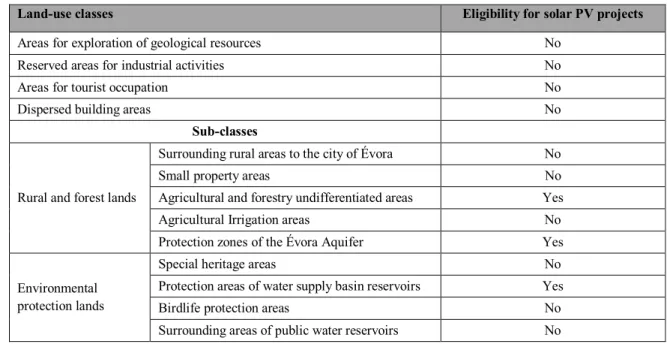
2.2.1 Land-Use Regulations 204
Municipal regulations define administrative easements and public utility land-use restrictions 205
that can limit the implementation of renewable energy exploitation projects. The municipal land 206
use plan in place for Évora (MMP, 2008; MMP, 2012) states different suitability of non-urban 207
land-use classes for the installation of PV plants, as shown in Table 1. All land-use classes 208
under protection were excluded from possible PV installation areas, except for those explicitly 209
detailing permission (e.g. Évora aquifer and water reservoirs). Protection zones not eligible for 210
PV plant installation include: 211
- agriculture and ecological reserves, 212
- protected natural areas (e.g. Natura 2000 network), 213
- protected water supply infrastructure reservoirs, 214
- electrical lines, 215
- the national road network, 216
- regional roads, and 217
- unclassified roads. 218
In the current assessment, all the spatial features with protected characteristics (e.g. water 219
bodies) were buffered by 200m to exclude possible solar projects from those areas. 220
Detailed analysis of current land-use legislation and municipal instruments concluded that only 221
some sub-classes of rural and forest lands and environmentally protected lands allow for the 222
implementation of PV projects. Within these two groups, the sub-classes agricultural and 223
forestry undifferentiated areas, protected zones of the Évora aquifer and protected areas of
224
water supply (basin reservoirs) were assumed appropriate for the potential installation of PV
225
projects. When the permission of any RES-E projects was not explicitily stated or there was no 226
legal barrier to the installation of high and medium voltage stations, the corresponding land-227
use classes were assumed to be ineligible for PV project implementation. In summary, the 228
available land for PV plants resulted from the subtraction of all the municipality land area with 229
infrastructure restrictions, including urban areas declared ineligible by regulation. 230
Table 1 – Eligibility of land-use classes for PV project installation, as stated in the municipal master plans
231
(MMP, 2008; MMP, 2012;)4
232
Land-use classes Eligibility for solar PV projects
Areas for exploration of geological resources No
Reserved areas for industrial activities No
Areas for tourist occupation No
Dispersed building areas No
Sub-classes
Rural and forest lands
Surrounding rural areas to the city of Évora No
Small property areas No
Agricultural and forestry undifferentiated areas Yes
Agricultural Irrigation areas No
Protection zones of the Évora Aquifer Yes
Environmental protection lands
Special heritage areas No
Protection areas of water supply basin reservoirs Yes
Birdlife protection areas No
Surrounding areas of public water reservoirs No 233
2.2.2 Land-Use Competition Scenarios 234
Across the selected eligible land-use classes, two additional limitation layers for PV 235
deployment were applied: agricultural crop areas and forestry lands. The agricultural and 236
forestry sectors still play an important economic and cultural role in the region, hence the level 237
of competition for land is high. Therefore, four types of agricultural crops and forestry (as 238
4 A deeper analysis of the allowed activities and infrastructures in the sub-classes under Rural and forest
lands and Environmental protection lands concluded the non-existence of restrictions regarding renewable energy technology deployment for particular land-use subclasses.
shown in Table 2) defined the ineligible lands for PV deployment, due to strategic importance 239
to the local and national economy. 240
Social economic value of specific land uses, and the percentage of land dedicated to each 241
specific use were selected as criteria to rank agricultural crops and forestry lands. The land use 242
percentage of each crop was used to quantity the potential for land conversion. This assumed 243
that greater cover percentage meant greater difficulty in adapting the land for PV system 244
installation. 245
With the remaining available land for PV system installation, three land-use competition 246
scenarios were defined by varying restriction levels. The scenarios are as follows: 247
1. Pro-PV scenario – This scenario favours intensive installation of utility-scale PV over 248
agricultural purposes. This translates into a high range of land use classifications 249
regarding agricultural and forestry lands that are available for PV system use. As 250
presented in Table 2, the agricultural and forestry lands classified as poor grassland 251
subject to trampling and as abandoned olive trees are susceptible to be substituted with
252
utility-scale PV. 253
2. Equilibrium scenario – This scenario considers a flexible, balanced land use in the 254
adoption of PV electricity generation. Croplands and forestry with current occupation 255
rates lower than 10%, thus not requiring significant terrain clearance efforts, are 256
suitable for substitution with utility-scale PV. 257
3. Pro-Rural scenario – This scenario favours agricultural production over PV for 258
electricity generation. In this sense, all types of croplands are maintained as they are, 259
except those with low economic and natural value (e.g. Poor grassland subject to 260
trampling) and those with minimal terrain adaption necessary (e.g. Soil without
261
vegetation cover). This additional restriction is of utmost relevance, due to the
262
economic importance of the agricultural sector to the case study region (national 263
agriculture added 26% gross value in 2013) (INE, 2013c). 264
265
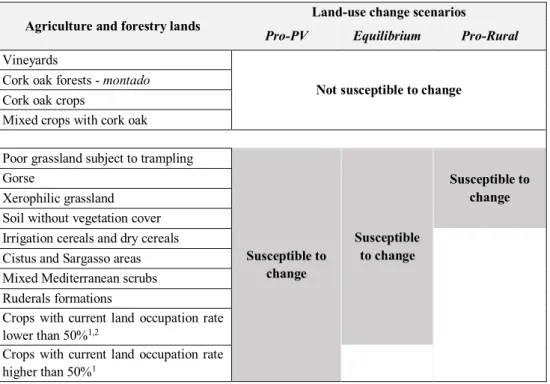
Table 2 – Agriculture and forestry lands’ susceptibility to change considered in each scenario
266
Agriculture and forestry lands Land-use change scenarios
Pro-PV Equilibrium Pro-Rural
Vineyards
Not susceptible to change
Cork oak forests - montado Cork oak crops
Mixed crops with cork oak
Poor grassland subject to trampling
Susceptible to change Susceptible to change Susceptible to change Gorse Xerophilic grassland Soil without vegetation cover
Irrigation cereals and dry cereals
Cistus and Sargasso areas
Mixed Mediterranean scrubs
Ruderals formations
Crops with current land occupation rate
lower than 50%1,2
Crops with current land occupation rate
1 Crops included: Arable irrigated crops, dryland arable crops, dryland olive trees, olive grove and vineyard 267
(dryland), irrigated olive trees, other dryland orchards, abandoned olive trees.
268
2 The Equilibrium scenario considered crops with occupation rates lower than 10%. 269
2.2.3 Suitable Areas for Utility-Scale PV Systems 270
Available land for each of the three land-use competition scenarios was then weighted by the 271
terrain features (i.e. slopes and solar exposure) rendering the land suitable for PV installation. 272
These key parameters to assess the technical feasibility of solar PV projects were expressed as 273
vector maps in ArcGIS. The optimal terrain slope was less than 3%, based on Lopez et al. 274
(2014). Using a conservative approach, optimal solar exposure was measured from the 275
southeast (135⁰) to the southwest (225⁰), although the installation of the PV panels could be 276
adjusted to a wider range of solar exposure and slopes. The outputs of the available land 277
analysis combined with these terrain features were defined as suitable areas for PV system 278
installation. 279
2.3 Technical Potential of Utility-Scale PV Systems
280The technical potential of the utility-scale PV projects was assessed considering the following 281
two PV technology types and four classes of power capacity: 282
1. Solar-PV system with single-axis tracking device and crystalline silicon solar cells (c-283
Si) (PV-track), calculated for average PV installation size (1, 10, 20, and 30 MW). The 284
c-Si-based system was chosen, as it constituted approximately 90% of global module 285
production capacity in 2014 (Metz et al., 2015) and is the most mature PV technology 286
(MIT, 2015), with low average market price and a high efficiency of 25% (NREL, 287
2015). 288
2. Concentrated-PV (CPV) system with two axes and multi-junction high-efficiency solar 289
cells for the average project size (1, 10, 20, and 30 MW). The CPV system was chosen 290
due to its high efficiency of 40% (NREL, 2015). CPV systems are also receiving 291
significant levels of investment encouragingly, even within the territory under study, 292
improving the technology’s economic feasibility. Moreover, according to Carvalho et 293
al. (2011), the CPV and the single-axis tracking system are the most profitable 294
technologies. 295
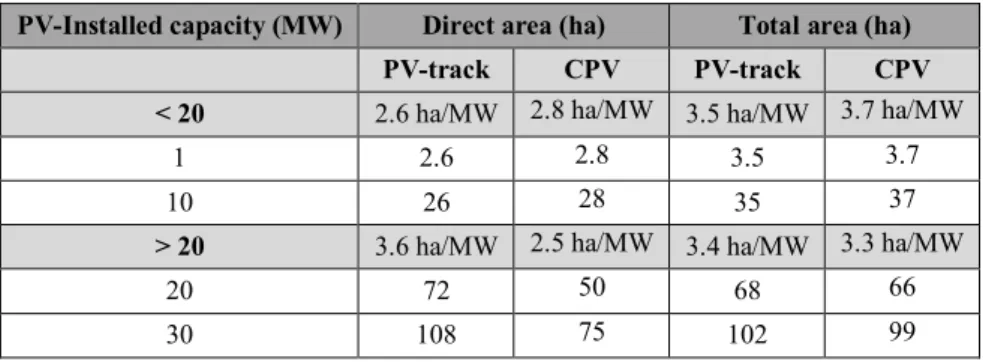
The land area required by each PV technology and system size is presented in Table 3. The 296
land area occupied by the solar panels includes the space between (direct area), as well as the 297
area required for maintenance (total area) (Ong et al., 2013). 298
Table 3 - Land area requirements for PV projects (adapted from Ong et al., 2013)
299
PV-Installed capacity (MW) Direct area (ha) Total area (ha) PV-track CPV PV-track CPV < 20 2.6 ha/MW 2.8 ha/MW 3.5 ha/MW 3.7 ha/MW
1 2.6 2.8 3.5 3.7
10 26 28 35 37
> 20 3.6 ha/MW 2.5 ha/MW 3.4 ha/MW 3.3 ha/MW
20 72 50 68 66
30 108 75 102 99
Suitable land patches for implementation of each type and power class of solar PV project were 301
determined through GIS spatial analysis. Multiple-unit projects for each power class were 302
assumed. No combinations of power capacities were considered. 303
Potential electricity generation was derived using the electricity production indicator (GWh per 304
MW installed) for each PV technology type. This indicator considered data in current facilities 305
(EDP Distribuição, 2016). The selected facilities were located in the case study region and 306
represented the two PV technologies under study: 1.88 GWh/MW for CPV and 1.63 GWh/MW 307
for PV-track. The energy output estimation by PV systems at a specific location was generated 308
through models and platforms, such as Solargis (2018) or PVGIS (2018). These models have 309
been found to slightly overestimate production when compared with actual values for in-situ 310
projects. This is due to unpredictable real conditions that are not considered in these tools (e.g. 311
module temperature, irradiation intensity, angle of solar incidence, spectral deviation from the 312
standard spectrum, shading, transmission losses, conversion losses in the inverter, and 313
operational failures) (Eltawil and Zhao, 2010; Rahman et al., 2015). Therefore, the use of real 314
electricity production data from projects in operation increased the technical potential 315
assessment’s robustness. The next section describes the results achieved. 316
317 318
3. Results
3193.1 Land Suitability for Utility-Scale PV Systems
320Excluding municipal plan restrictions and existing urbanized infrastructure, a total of 27133 ha 321
of rural area were identified as available for PV project installation. The available area 322
corresponds to 21% of Évora municipality’s total area (130900 ha). 323
The total available area was then reduced to 6951 ha when a priority for agricultural crops was 324
considered (Pro-Rural land-use competition scenario). When all croplands suitable for 325
substitution in favour of utility-scale PV projects were considered (Pro-PV land-use 326
competition scenario), the area reduced to 16711 ha. The increment in priority to agricultural 327
uses induced 38% to 74% less available area for the implementation of PV facilities for the 328
Pro-PV and Pro-Rural scenarios. The impact of restricting the available area to locations with
329
optimal slope and solar exposure (suitable area) represented a reduction of 24% of the available 330
area (equal to all land-use competition scenarios), stressing the importance of effective project 331
design. 332
Total required land by type of PV system technology, resulting from the application of the land 333
area requirements (Table 3) to the amount of suitable area for PV systems, is presented in Table 334
4. The results show that the 1MW PV-track systems under the Pro-PV scenario could occupy 335
68% of the total suitable areas. Land-use efficiency indicator (ratio between total PV system 336
required area and the total amount of suitable land area) varies depending on the type of PV 337
technology and the landscape patchiness. For the 1MW PV-track systems under the Pro-PV 338
scenario, the land-use efficiency was 68%, while for the Pro-Rural scenario it was 74%. The 339
land-use change scenario favouring agricultural crops (Pro-Rural scenario) delivered a more 340
productive land mix for the 1 MW PV-track system implementation. 30 MW projects held a 341
land-use efficiency of 1% regardless of the PV technology or the land-use scenario, resulting 342
in a high suitable land surplus. The required land was more significant for the 10 MW projects. 343
Smaller PV projects showed higher available land use efficiency, due to the capacity to occupy 344
more scattered areas throughout the territory. 345
Table 4 – Land suitability and useful areas for each land-use scenario according to PV system technology
346
and project dimension
347 Land-use competition scenarios Available land (ha) Suitable land (ha)
Total required land for solar PV projects (ha) 1 MW 10 MW 20 MW 30 MW PV-track CPV PV-track CPV PV-track CPV PV-track CPV Pro-PV 16 711 12 845 8 728 8 614 1 154 938 352 352 104 104 Equilibrium 10 887 8 308 5 716 5 619 821 713 258 258 104 104 Pro-Rural 6 951 5 244 3 905 3 852 675 556 258 258 104 104 348
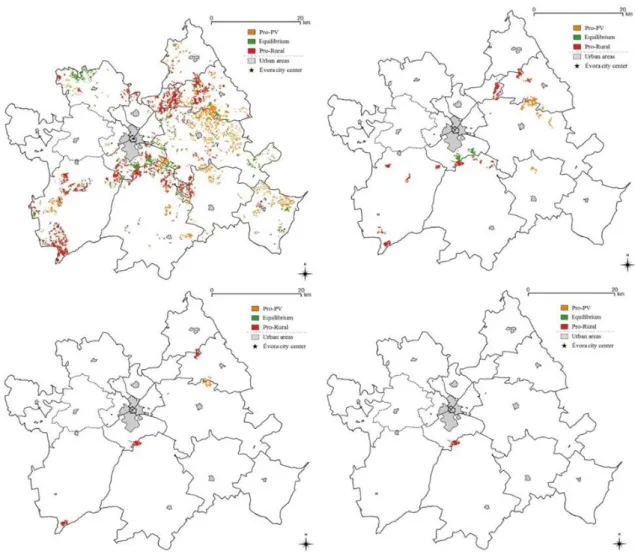
Figure 6 portrays the spatial distribution of the four power classes of PV-track system projects 349
in Évora municipality for each land-use competition scenario. The possible locations for 1 MW 350
PV projects are spread over the whole municipality with a higher concentration in the northeast. 351
The PV project predominance in the Pro-PV scenario in the northeast was demonstrated – as 352
represented in orange on the map. The more restrictive PV implementation scenario (Pro-353
rural), shown in red on the map, indicates a concentration in the northeast zone but also south
354
of Évora city. PV projects’ potential proximity to the urban city zone can enhance the benefits 355
by reducing the electricity distribution network modifications and/or extension requirements. 356
This also minimises transmission losses and additional costs. Évora municipality’s west shows 357
minimum potential for PV facility locations. This is consequence of the high "Natura 2000" 358
network protected area in that region (e.g. Monfurado site). 359
360
Figure 6 - Location of PV-track systems for each land-use competition scenario (top left – 1 MW, top right –
361
10 MW, bottom left – 20 MW, bottom right – 30 MW)
362
The potential locations for the 20 MW PV projects are practically coincident with all the 363
different land-use competition scenarios for the two types of PV technologies. It should be 364
emphasised that the suitable land for the 30 MW PV projects was primarily located south of 365
Évora’s urban area (in red on the bottom right map) and close to an existing CPV solar farm. 366
This is also supported by the conclusions drawn by Perpiña Castillo et al. (2016); i.e. in 367
Portugal, the most suitable areas match the locations of existing solar power plants. 368
These locations, 3.5 km from Évora’s urban area, have a reduced need for transport and 369
distribution power lines. This results in lower investment costs and minor electricity losses, as 370
the consumers are closer to the electricity generation sites. 371
3.2 Technical Potential of Utility-Scale PV Systems
372The potential PV utility-scale system installed capacity for each land-use competition scenario 373
is presented in Table 5. The higher land-use efficiency of the 1 MW projects translated into the 374
corresponding higher installed capacity values. In the Pro-PV scenario, the potential installed 375
capacity of 1 MW projects was five times the 2015 national PV-installed capacity (451 MW 376
(DGEG, 2015a)). It also represents 40% of the total national capacity of coal and gas power 377
plants (5890 MW), surpassing the capacity of the two coal power plants (1871 MW) (DGEG, 378
2015c). These values also correspond to more than half the national PV contribution (4500 379
MW) to attain a 100% RES-E in Portugal in 2020, as stated by Krajačić et al. (2011). For the 380
conservative Pro-Rural scenario and the 1 MW project size, the installed capacity could 381
represent over twice the 2015 national PV-installed capacity and up to 60% of the current coal 382
powerplant capacity. The results illustrate that the national targets for a PV installed capacity 383
of 720 MW in 2020 (PNAER, 2013) can be met through the available PV technical potential in 384
Évora municipality alone. This is in line with regulatory changes of rural land-use from 385
agricultural to PV systems (i.e. Pro-Rural scenario). 386
Table 5 - PV utility-scale installed capacity potential for each land-use competition scenario
387 Land-use competition scenarios PV utility-scale potential (MW) 1 MW 10 MW 20 MW 30 MW
PV-track CPV PV-track CPV PV-track CPV PV-track CPV Pro-PV 2 494 2 328 330 250 100 (5 systems) 30
Equilibrium 1 633 1 519 240 190 80 (4 systems) 30
Pro-Rural 1 116 1 041 190 150 80 (4 systems) 30 388
Although the installed capacity of CPV technology was lower than the PV-track in all land-use 389
competition scenarios, the electricity production was higher (Table 6). This is due to CPV’s 390
higher efficiency in electricity production. Table 6 also shows the productivity by unit area 391
indicator. It is possible to perceive the higher technical viability of CPV technology, as it can 392
produce more electricity with a lower installed capacity and land occupation than the PV-track. 393
Table 6 - PV utility-scale electricity production potential and productivity for each land-use change scenario
394
Land-use
change scenarios
PV utility-scale electricity production potential (GWh)
1 MW 10 MW 20 MW 30 MW
PV-track CPV PV-track CPV PV-track CPV PV-track CPV
Pro-PV 4 065 4 377 538 478 195 226 58 68
Equilibrium 2 662 2 855 383 363 142 165 58 68
Pro-Rural 1 819 1 957 315 282 142 165 58 68
PV utility-scale electricity productivity per unit area (GWh/ha)
0.47 0.51 0.47 0.51 0.55 0.64 0.56 0.65
395
Expected electricity produced through utility-scale PV systems in the case study region could 396
represent a reduction of up to 50% of national electricity imports (DGEG, 2015d). This also 397
corresponds to the existing national coal powerplant installed capacity (1871 MW). In this way, 398
the generated PV electricity may allow for an output reduction of the two national coal power 399
plants of up to 37%. This also represents a reduction of 1.7 Mt of coal imports and an economic 400
savings worth 98 M€ (coal price – 55 €/t (DGEG, 2015e)). The utility-scale PV potential under 401
a Pro-PV scenario with smaller size projects (1 MW) has the capacity to produce enough 402
electricity to cover the annual municipality’s electricity demand (261 GWh (DGEG, 2015b)). 403
Even when considering the scenario with prevailing rural land for agricultural purposes (Pro-404
rural scenario), the amount of electricity generated would still be capable of covering the
405
municipality's current electricity needs. The increase of rural land priority to agricultural uses 406
(Pro-Rural scenario) could mean a 55% reduction in electricity generated, as compared to the 407
Pro-PV scenario.
408
Results showed a high quantity of available area for PV deployment. The different restriction 409
levels on the available land area for PV plant deployment, as a proxy for competitiveness with 410
agricultural uses, had an impact of 38% to 74% less available area. When considering the 411
optimal terrain conditions for PV plant deployment (defined as suitable land area), there was 412
an additional reduction of 14% and 6% (Pro-PV and Pro-rural scenarios, respectively). The 413
addition of each PV system land requirement per project size resulted in 68% (Pro-PV scenario) 414
and 74% (Pro-Rural scenario) of the effective land area for PV systems. Although total suitable 415
land area in the more flexible scenario (Pro-PV) was higher than in the more restrictive one 416
(Pro-Rural), there were fewer locations with the necessary size for PV deployment. Thus, 417
minimising the impact of restrictive land use for agricultural activities would assist PV 418
deployment. 419
Solar farms of 1 MW (up to 2494 units) and 10 MW (up to 30 units) present further advantages, 420
due to better available land exploitation. In total, the two smaller sizes can provide a higher 421
quantity of electricity than projects of a larger size (20 MW and 30 MW). The 30 MW projects 422
offer higher levels of electricity production, but corresponding higher area requirements act as 423
a constraint for deployment. 424
425
4. Conclusion and Discussion
426PV growth rates have been high in recent years, but still require massive deployment to address 427
global and regional sustainable economic and environmental development challenges. A crucial 428
unlock factor is the identification of available optimal locations for PV utility-scale installations 429
that generate less competition with other uses. Interactions between different rural land uses 430
(energy production vs. agriculture) is a growing concern (Sacchelli et al., 2016). This paper 431
contributes to this topic through the analysis of the effects on the available technical potential 432
for PV utility-scale projects considering different competing land-use scenarios within a 433
municipality. 434
The utility-scale PV systems technical potential assessment considered PV technology’s land 435
requirements and spatial constraints under multi-level land planning instruments. By defining 436
land-use suitability to change scenarios, it was possible to assess the effect of competing uses 437
of land (agricultural vs. renewable electricity production) in a region with high solar resource 438
availability and vast rural areas. 439
Results showed that for the case study region, land use for PV utility-scale deployment can be 440
limited by other competitive land uses, such as agriculture, forestry, nature conservation, and 441
urban infrastructure. The estimated technical potential of PV utility-scale electricity generation 442
could cover 100% of the case study's electricity consumption in most scenarios. This hypothesis 443
is comparable to similar assessments; e.g. ground-mounted solar PV could cover nearly 60% 444
of Ontario’s projected peak electricity demand in 2025 (Nguyen and Pearce, 2010). 445
This study found that the competition for land between a potential massive deployment of 446
utility-scale solar PV and agro-forestry should be a vital component considered in the analysis 447
and identification of optimal locations for PV installations. This was supported in similar 448
studies (Calvert & Mabee, 2015; Sacchelli et al., 2016; Castillo et al., 2016). The impact of 449
agricultural predominance over PV system deployment could cut potential electricity 450
generation in half. Although this impact depends on regional land use particularities, the study 451
results were in line with Sacchelli et al. (2016), who noted that agricultural lands that were not 452
allowed to be used for PV energy production could reduce the potential between 24.5% 453
(Molise) and 60.9% (Calabria) in northern Italy. Moreover, the outcomes of this work provided 454
valuable information and insight into different stakeholders, namely municipal spatial planners, 455
private companies, and investors. This study could also facilitate decision-making processes 456
for the selection of sites for solar farm implementation and clean energy objectives (Calvert & 457
Mabee, 2015). 458
Several potential improvements could be addressed in future research. These include the 459
validation of scenario assumptions with local stakeholders and municipal decision makers and 460
potential inclusion of master plans land use variability. The present work also lacks the 461
attribution of ecosystem services provided by each crop type (see, for instance, Robertson et al. 462
(2014) and Förster et al. (2015) studies). By including these additional crops benefits, the 463
agricultural uses could gain more importance over PV system deployment. Nevertheless, to 464
properly balance the economic equilibrium, financial benefits of PV plants should also be 465
considered. 466
Further research toward the development of solar PV in rural areas should include the 467
complementary use of PV systems with specific agriculture studies (e.g. cork forest) (Dupraz 468
et al., 2011; Dinesh & Pearce, 2016). 469
Acknowledgments
470The work supporting this paper was partly funded by the European project InSMART – 471
Integrative Smart City Planning (EU FP7 Grant agreement no: 314164). The authors would like 472
to thank Évora municipality, namely its InSMART project team members, for providing 473
essential information. The authors would also like to thank Katherine Mahoney for her English 474
revisions at the final stage. Finally, the authors acknowledge and appreciate the support given 475
to CENSE by the Portuguese Foundation for Science and Technology through the strategic 476 project UID/AMB/04085/2013. 477 478
5. References
479AMPERE, 2014. AMPERE Database, EU FP7 AMPERE Project. Available at: 480
https://secure.iiasa.ac.at/web-481
apps/ene/AMPEREDB/dsd?Action=htmlpage&page=about#regiondefs. 482
APCOR, 2014. Cork yearbook 2014. Associação Portuguesa da Cortiça. Available at: 483
http://www.apcor.pt/wp-content/uploads/2015/07/AnuarioAPCOR2014.pdf. 484
Arán Carrión, J., Espín Estrella, A., Aznar Dols, F., Zamorano Toro, M., Rodríguez, M., 485
Ramos Ridao, A., 2008. Environmental decision-support systems for evaluating the 486
carrying capacity of land areas: Optimal site selection for grid-connected photovoltaic 487
power plants. Renew. Sustain. Energy Rev. 12, 2358–2380. 488
doi:10.1016/j.rser.2007.06.011. 489
Brito, M. C., Gomes, N., Santos, T., Tenedório, J. A., 2012. Photovoltaic potential in a Lisbon 490
suburb using LiDAR data. Sol. Energy 86, 283–288. doi:10.1016/j.solener.2011.09.031 491
Calvert, K., Mabee, W., 2015. More solar farms or more bioenergy crops? Mapping and 492
assessing potential land-use conflicts among renewable energy technologies in eastern 493
Ontario, Canada. Appl. Geogr. 56, 209–221. doi:10.1016/j.apgeog.2014.11.028. 494
Carvalho, D., Wemans, J., Lima, J., Malico, I., 2011. Photovoltaic energy mini-generation: 495
Future perspectives for Portugal. Energy Policy 39, 5465–5473. 496
doi:10.1016/j.enpol.2011.05.016. 497
Chu, Y., Meisen, P., 2011. Review and Comparison of Different Solar Energy Technologies. 498
Global Energy Network Institute (GENI). Available at: 499 https://www.geni.org/globalenergy/research/review-and-comparison-of-solar-500 technologies/Review-and-Comparison-of-Different-Solar-Technologies.pdf. 501
CME, 2014. [Municipal forest fire prevention plan 2014 – 2018] Plano municipal de defesa da 502
floresta contra incêndios 2014 – 2018 Caderno I Diagnóstico. 503
DGEG, 2015a. Renováveis. Estatísticas Rápidas. [Renewable Energy Statistics] Directorate 504
General for Energy and Geology. April 2015. 505
DGEG, 2015b. Consumo de energia elétrica por sector de atividade em 2013. [Electricity 506
conumpion by sector] Directorate General for Energy and Geology. April 2015. 507
DGEG, 2015c. Potência instalada nas centrais produtoras de energia elétrica. [Installed power 508
for electricity generation] Directorate General for Energy and Geology. April 2015. 509
DGEG, 2015d. Balanço energético nacional 2013. [National Energy Balance 2013] Directorate 510
General for Energy and Geology. June 2015. 511
DGEG, 2015e. Combustíveis fósseis. Estatísticas Rápidas. [Fossil Fuels Statistics] Directorate 512
General for Energy and Geology. June 2015. 513
DGEG, 2018. Renováveis. Estatísticas Rápidas. Directorate General for Energy and Geology. 514
September 2018. 515
Dinesh, H., Pearce, J. M., 2016. The potential of agrivoltaic systems. Renew. Sustain. Energy 516
Rev. 54, 299–308. doi:10.1016/j.rser.2015.10.024. 517
Dupraz, C., Marrou, H., Talbot, G., Dufour, L., Nogier, A., Ferard, Y., 2011. Combining solar 518
photovoltaic panels and food crops for optimising land use: Towards new agrivoltaic 519
schemes. Renew. Energy 36, 2725–2732. doi:10.1016/j.renene.2011.03.005. 520
EDP Distribuição, 2015. Data on electricity production and installed capacity of utility-scale 521
production systems PV on Évora municipality by sector and zone. EDP Distribuição S.A, 522
Lisbon, Portugal. 523
EDP, 2015. InovGrid Évora. EDP Distribution S.A. 524
EEA, 2016. Renewable energy in Europe 2016 Recent growth and knock-on effects. European 525
Environment Agency, Copenhagen, Denmark. Available at: 526
https://www.eea.europa.eu/publications/renewable-energy-in-europe-2016. 527
Eltawil, M. A., Zhao, Z., 2010. Grid-connected photovoltaic power systems: Technical and 528
potential problems - A review. Renew. Sustain. Energy Rev. 14, 112–129. 529
doi:10.1016/j.rser.2009.07.015. 530
Förster, J., Barkmann, J., Fricke, R., Hotes, S., Kleyer, M., Kobbe, S., Kübler, D., Rumbaur, 531
C., Siegmund-Schultze, M., Seppelt, R., Settele, J., Spangenberg, J. H., Tekken, V., 532
Václavík, T., Wittmer, H., 2015. Assessing ecosystem services for informing land-use 533
decisions: A problem-oriented approach. Ecol. Soc. 20. doi:10.5751/ES-07804-200331. 534
Fraunhofer (ISE), 2017. Photovoltaics Report. Fraunhofer, Institute for Solar Energy. Available 535
at:.ise.fraunhofer.de. 536
Greenpeace. (2015). World Energy [R]evolution, a sustainable world energy outlook. Retrieved 537 from: 538 http://www.greenpeace.org/international/Global/international/publications/climate/2015/ 539 EnergyRevolution2015Full.pdf 540
González-García, S., Dias, A. C., Arroja, L., 2013. Life-cycle assessment of typical Portuguese 541
cork oak woodlands. Sci. Total Environ. 452–453, 355–364. 542
doi:10.1016/j.scitotenv.2013.02.053. 543
Gouveia, J. P., Seixas, J., 2016. Unraveling electricity consumption profiles in households 544
through clusters: Combining smart meters and door-to-door surveys. Energy and 545
Buildings. 116, 666–676. 546
Gouveia, J. P., Seixas, J., Mestre, A., 2017. Daily Electricity Profiles from Smart Meters - 547
Proxies of Active Behaviour for Space Heating and Cooling. Energy, 141. 108-122 548
https://doi.org/10.1016/j.energy.2017.09.049. 549
Gouveia, J. P., Seixas, J., Long, G., 2018. Mining households' energy data to disclose fuel 550
poverty: Lessons for Southern Europe. Journal of Cleaner Production 178, 534-550. 551
https://doi.org/10.1016/j.jclepro.2018.01.021. 552
Gunderson, I., Goyette, S., Gago-Silva, A., Quiquerez, L., Lehmann, A., 2014. Climate and 553
land-use change impacts on potential solar photovoltaic power generation in the Black 554
Sea region. Environ. Sci. Policy 46. doi:http://dx.doi.org/10.1016/j.envsci.2014.04.013. 555
Hawken, P., Wilkinson, K., Frischmann, C., Allard, R., Bayuk, K., Gouveia, J. P., Mehra, M., 556
Toensmeier, E., Chissel, C., 2017. Drawdown: The Most Comprehensive Plan Ever 557
Proposed to Reverse Global Warming. Edited by Paul Hawken. Penguin Books. April 558
2017. ISBN-13: 978-0143130444. 559
IEA, 2014. Technology Roadmap: Solar Photovoltaic Energy. International Energy Agency, 560
Paris, France. 561
IEA, 2015. World Energy Outlook 2015. International Energy Agency, Paris, France. 562
doi:10.1787/weo-2014-en. 563
IEA, 2017. World Energy Outlook 2017. International Energy Agency, Paris, France. 564
doi:http://dx.doi.org/10.1787/weo-2017-en. 565
IEA and NEA, 2015. Projected Costs of Generating Electricity – edition 2015. Organisation for 566
Economic Co-operation and Development - International Energy Agency and Nuclear 567
Energy Agency. France. Retrieved from https://www.oecd-nea.org/ndd/pubs/2015/7057-568
proj-costs-electricity-2015.pdf. 569
IEA-PVPS, 2015. TRENDS 2015 in Photovoltaic Applications: Survey Report of Selected IEA 570
Countries between 1992 and 2014. 571
INE, 2013a. Contas Económicas da Silvicultura – 2013 Statistics Portugal. Avaialable at 572
/http://www.ine.pt/. 573
INE, 2013b. Estatísticas Agrícolas – 2013. Statistics Portugal. Avaialable at 574
/http://www.ine.pt/. 575
INE, 2013c. Contas Regionais para o período 2000 a 2013. Statistics Portugal. Avaialable at 576
/http://www.ine.pt/. 577
IRENA, 2017. REthinking Energy: Accelerating the global energy transformation, 578
International Renewable Energy Agency (IRENA). Available at: http://www.irena.org/-579
/media/Files/IRENA/Agency/Publication/2017/IRENA_REthinking_Energy_2017.pdf. 580
Jäger-waldau, A., 2016. PV Status Report 2016. European Commission, Joint Research Centre, 581
Directorate C, Energy Efficiency and Renewables Unit, Ispra, Italy. doi:10.2790/749737. 582
Janke, J. R., 2010. Multicriteria GIS modeling of wind and solar farms in Colorado. Renew. 583
Energy 35, 2228–2234. doi:10.1016/j.renene.2010.03.014. 584
Krajačić, G., Duić, N., Carvalho, M. D. G., 2011. How to achieve a 100% RES electricity 585
supply for Portugal? Appl. Energy 88, 508–517. doi:10.1016/j.apenergy.2010.09.006. 586
Lopez, A., Roberts, B., Heimiller, D., Blair, N., Porro, G., 2014. U. S. Renewable Energy 587
Technical Potentials: A GIS- Based Analysis 40. doi:NREL/TP-6A20-51946. 588
MEE, 2015. Renováveis na Hora - Sistema de Registo de Microprodução e Miniprodução 589
[micro and mini generation]. Ministry of Economy and Employment. Available at: 590
[http://www.renovaveisnahora.pt/web/srm]. 591
Metz, A., Demenik, G., Ritcher, A., Vlasenko, Timur, 2015. International Technology 592
Roadmap for Photovoltaic (ITRPV) Sixth Edit, 1–38. Available ta: http://www.itrpv.net/. 593
MIT, 2015. The Future of Solar Energy: An Interdisciplinary MIT Study. Cambridge, MA. 594
Available at: http://energy.mit.edu/research/future-solar-energy/. 595
MMP, 2008. [Municipal Master plan] Regulamento do Plano Diretor Municipal de Évora. 596
Diário da República no 18/2008, II série. Relatório do Plano Diretor Municipal de Évora. 597
Dezembro 2007. Estudos de Caracterização do Território do Município de Évora. 598
MMP, 2012. [Municipal Master plan Update] Alteração ao regulamento do Plano Diretor 599
Municipal de Évora. October 2012. 600
NREL, 2015. Best Research-Cell Efficiencies. National Renewable Energy Laboratory, 601
National Center for Photovoltaics. Avaliable at:
602
http://www.nrel.gov/ncpv/images/efficiency_chart.jpg. 603
Ong, S., Campbell, C., Denholm, P., Margolis, R., Heath, G., 2013. Land-Use Requirements 604
for Solar Power Plants in the United States. National Renewable Energy Laboratoru 605
(NREL). Available at: https://www.nrel.gov/docs/fy13osti/56290.pdf. 606
Perpiña Castillo, C., Batista e Silva, F., Lavalle, C., 2016. An assessment of the regional 607
potential for solar power generation in EU-28. Energy Policy 88, 86–99. 608
doi:10.1016/j.enpol.2015.10.004. 609
PNAER, 2013. Estratégia para as Energias Renováveis - PNAER 2020. [NREAP - National 610
Renewable Energy Action Plan]. Resolução do Conselho de Ministros n.o 20/2013. 611
PVGIS, 2018. Photovoltaic Geographical Information System web application. Institute for 612
Energy and Transport (IET) of the Joint Research Center (JRC). Available at: 613
http://re.jrc.ec.europa.eu/pvgis/. 614
Rahman, M.M., Hasanuzzaman, M., Rahim, N., 2015. Effects of various parameters on PV-615
module power and efficiency. Energy Convers. Manag. 103, 348–358. 616
doi:10.1016/j.enconman.2015.06.067. 617
Redweik, P., Catita, C., Brito, M., 2013. Solar energy potential on roofs and facades in an urban 618
landscape. Sol. Energy 97, 332–341. doi:10.1016/j.solener.2013.08.036. 619
Resch, G., Held, A., Faber, T., Panzer, C., Toro, F., Haas, R., 2008. Potentials and prospects 620
for renewable energies at global scale. Energy Policy 36, 4048–4056. 621
doi:10.1016/j.enpol.2008.06.029. 622
Robertson, G. P., Gross, K. L., Hamilton, S. K., Landis, D. A., Schmidt, T. M., Snapp, S. S., 623
Swinton, S. M., 2014. Farming for ecosystem services: An ecological approach to 624
production agriculture. Bioscience 64, 404–415. doi:10.1093/biosci/biu037. 625
Sacchelli, S., Garegnani, G., Geri, F., Grilli, G., Paletto, A., Zambelli, P., Ciolli, M., Vettorato, 626
D., 2016. Land Use Policy Trade-off between photovoltaic systems installation and 627
agricultural practices on arable lands : An environmental and socio-economic impact 628
analysis for Italy. Land Use Policy 56, 90–99. doi:10.1016/j.landusepol.2016.04.024. 629
Seixas, J., Fortes, P., Dias, L., Barroso, J., Martinho, S., Gouveia, J., Ferreira, F., Gomes, P., 630
Tente, H., Baptista, P., 2014. GHG Emission scenarios and technological options for 631
decarbonization in Portugal in 2020 and 2030 Study for the Portuguese Environmental 632
Agency. Lasting values, Lda and CENSE, FCT of NOVA University of Lisbon. 633
Seixas, J., Fortes, P., Dias, L., Dinis, R., Alves, B., Gouveia, J., Simões, S., 2012. Low Carbon 634
RoadMap - Portugal 2050 - Energy and Waste Greenhouse emissions, Study for the 635
Executive Committee of the Climate Change Commission. E-value, SA and FCT of 636
NOVA University of Lisbon. 637
Sierra-Pérez, J., Boschmonart-Rives, J., Gabarrell, X., 2015. Production and trade analysis in 638
the Iberian cork sector: Economic characterization of a forest industry. Resour. Conserv. 639
Recycl. 98, 55–66. doi:10.1016/j.resconrec.2015.02.011. 640
Simoes, S., Dias, L., Gouveia, J. P.; Seixas, J., De Miglio, R., Chiodi, A., Gargiulo, M., Long, 641
G., Giannakidis, G., 2018. INSMART - Insights on modelling EU cities decarbonisation 642
pathways. Energy Strategy Reviews (20), April 2018, Pp. 150–155. 643
SlizSszkliniarz, B., 2013. Land Use Policy Assessment of the renewable energy-mix and land 644
use trade-off at a regional level : A case study for the Kujawsko – Pomorskie Voivodship. 645
Land Use Policy 35, 257–270. doi:10.1016/j.landusepol.2013.05.018. 646
Solargis, 2018. PV planner. Available from: http://www.solargis.info/pvplanner. 647
Uyan, M., 2013. GIS-based solar farms site selection using analytic hierarchy process (AHP) 648
in Karapinar region Konya/Turkey. Renew. Sustain. Energy Rev. 28, 11–17. 649
doi:10.1016/j.rser.2013.07.042. 650
Vieira, R.G., Guerra, F. K. O. M. V., Vale, M. R. B. G., Araújo, M. M., 2016. Comparative 651
performance analysis between static solar panels and single-axis tracking system on a hot 652
climate region near to the equator. Renew. Sustain. Energy Rev. 64, 672–681. 653
doi:10.1016/j.rser.2016.06.089. 654
Wirth, H., 2015. Recent Facts about Photovoltaics in Germany. Freiburg. 655
Nomenclature
656 € – Euro 657 CPV – Concentrated photovoltaic 658c-Si – Crystalline silicon 659
GHI – Global horizontal irradiation 660
GIS – Geographic information system 661 GW – Gigawatt 662 GWh – Gigawatt-hour 663 ha – Hectare 664 MW – Megawatt 665 PV – Photovoltaic 666
RES-E – Renewable energy sources for electricity generation 667