An Approach Based on Fuzzy Logic, to Improve Quality
Management on Research and Development Centres
Ricardo Santos
ISEL- Instituto Superior de Engenharia de Lisboa, InstitutoPolitécnico de Lisboa University of Aveiro, Portugal GOVCOPP, University of Aveiro
[email protected]
Antonio Abreu
ISEL- Instituto Superior de Engenharia de Lisboa, InstitutoPolitécnico de Lisboa CTS Uninova, FCT, Universidade
Nova de Lisboa, Portugal
[email protected]
Vitor Anes
ISEL-Instituto Superior de Engenharia de Lisboa, Instituto Politécnico de
Lisboa, IDMEC-IST-UL, Lisboa, Portugal.
[email protected]
J. M.F. Calado
ISEL- Instituto Superior de Engenharia de Lisboa, InstitutoPolitécnico de Lisboa IDMEC-IST-UL, Lisboa,
Portugal
[email protected]
ABSTRACT
Nowadays, with globalization and with the development of emergent economies the Research and Development (R&D) Centres in Europe to survive need to achieve high levels of excellence. In this way, the use of a quality management tools, such as European Foundation for Quality Management (EFQM), can help the managers of such organizations to identify de best practices to enhance the efficiency and effectiveness. Hence, this paper presents a new approach to support managers of R&D centres in the decision-making process in achieving the aims mentioned above, which is based on the EFQM model integrated with Fuzzy Logic. The proposed approach was applied to a Portuguese R&D Centre to assess its overall performance. In order to evaluate the robustness of the proposed approach, the results achieved were compared with the results obtained through a traditional methodology based on RADAR’s Logic.
CCS CONCEPTS
• Computing Methodologies---Artificial
Intelligence---Knowledge Representation and Reasoning---Vagueness and Fuzzy Logic; 500
•Information Systems---Information Systems
Applications---Decision Support Systems; 300
Keywords
Fuzzy Logic; EFQM; Self-assessment, RADAR.
1. INTRODUCTION
Currently, there is a change in the geography of science. The R&D centres that emerge in Europe and United States after the second war and which allowed to establish these two regions as superpowers in the scientific domain are nowadays at risk due to emergence of new players in other regions. In this context, the above mention regions are likely to lose the leadership in the development of new knowledge. This change in the relocation of R&D activities implies that Europe should identify where to focus improvement efforts, coming out of its comfort zone and follows the best practices of the new players in this changing context. However, it is often referred by the managers of the R&D Centres that there is a lack of consensus about the drivers for an excellent performance of the organizations. Thus, to pursue the goal of efficiency and effectiveness in a long term, each organization must be capable of measuring its own performance, based on the ideal goals and business strategies. Then, the proposed assessment methodology aims to find answers to the following questions: What characterizes an Excellent R&D Centre? What does a R&D Centre need to be Excellent? What is the level of performance of a R&D Centre? These are the questions that many managers of R&D Centres do when discuss the issue of Excellence paradigm. Among several available methods, the European For Quality Management (EFQM) model arises in Europe in 1998, not only as a Quality Management method, that allows to attend the goals referred before, but as a method for evaluating the organization’s overall performance.
However, and given its qualitative nature, the correspondent assessment doesn’t consider all issues regarding the problem to assess, making it therefore, insufficient. Some detected issues are related with the lack of precise information about the preferences of decision-makers, which are somehow subjective, since it depends on the decision-maker himself.
Given the Fuzzy nature of the decision process, the decision maker, makes his judgment, based on specific values, instead of judging based on interval’s values. On the other hand, the self-assessment results, are partly varied and dependent on various opinions, which makes the scores of the various consultants, sometimes very different. In this sense, Fuzzy Logic can be a useful method to Permission to make digital or hard copies of all or part of this work for
personal or classroom use is granted without fee provided that copies are not made or distributed for profit or commercial advantage and that copies bear this notice and the full citation on the first page. Copyrights for components of this work owned by others than ACM must be honored. Abstracting with credit is permitted. To copy otherwise, or republish, to post on servers or to redistribute to lists, requires prior specific permission and/or a fee. Request permissions from [email protected].
ICVISP 2019, August 26–28, 2019, Vancouver, BC, Canada © 2019 Association for Computing Machinery.
ACM ISBN 978-1-4503-7625-9/19/08…$15.00 https://doi.org/10.1145/3387168.3387232
solve the problems referred above, given its flexibility and robustness, regarding its outputs, which is needed for the decision makers.
Thus, this study aims to provide a methodology where Fuzzy Logic is employed in a self-assessment process regarding a R&D Centre in a Higher Education Institution (HEI).
This paper is organized as follows: Section 2 illustrates literature review. Section 3 presents the Methodology and the obtained
results, with EFQM excellence model, Fuzzy Logic, the problem statement, as well as the proposed approach and results. The results are compared and discussed. This work ends with Section 4 that includes some concluding remarks and future work.
2. LITERATURE REVIEW
Some works have been presented, regarding the issues discussed in this paper, although mainly focused on the implementation and analysis of EFQM model in several organizations, belonging to different sectors. One example is the work of [9], regarding the
Figure 1. EFQM 2013 Model [11]
overall performance of a nuclear power plant, where it was identified strengths and areas to be improved. Based on the obtained score, as well as the analysis of those strengths and areas for improvement, it was possible to prioritize the actions to be performed.
Other similar works, can be pointed here, regarding EFQM implementation (e.g. [7]), the integration with Enterprise Resource Planning (ERP) (e.g. [8]), the comparison with other quality management systems (e.g. between ISO 9000 and EFQM [1]), among others.
Other works includes the development and application of Fuzzy Logic based on hybrid approaches, combined with AHP techniques [10-13], with TOPSIS method [6], among others. Other application fields of Fuzzy Logic could be pointed out (e.g. [2-5]). Besides the little research, regarding EFQM in the HEI’s [11-12], normally such works, are more focused in the entire HEI’s quality management system [11], instead of in one functional area, and more specifically in a R&D Centers, given its issues to attend.
3. METHODOLOGY AND RESULTS
3.1 EFQM Excellence Model
The EFQM model, is a framework, formed by nine criteria, in which five of them, are known as “enablers”, while the other four, are known as “results” (Figure.1). The first group covers what an organization performs, while the second group, refers to what an organization achieves, through the enabler’s deployment.
However, “enablers” are also improved through the feedback, achieved from “results”.
According to [12], the group “Enablers” includes leadership, strategy, people, partnerships and resources, and processes, products & services. The results’ group includes customer, people, society, and key performance. In total, there is 24 sub-criteria and 8 sub-criteria, respectively regarded to “enablers” and “results”. The main function of self-evaluation is to identify areas for improvement in the organization. We can choose to score the result of the self-assessment, even if there is no official disclosure of the score obtained, by EFQM the experts. The scoring methodology adopted is at the discretion of the organization. The expression RADAR results from the words "Results, Approaches, Deployment, Assess and Refine" (Figure.2).
Figure 2. EFQM RADAR’s logic [11].
According to the rationale of this evaluation matrix, organizations must identify the results they intend to achieve as part of their policy and strategy definition process. These results cover all dimensions of the model. Organizations, depending on their objectives, plan the approaches they need to develop (or deploy)
now and in the future, in a systematic way. Finally, it is necessary to evaluate and review the implemented approaches, monitoring the results obtained and the learning activities. Based on these measures, organizations identify, plan and implement improvements [11-12].
3.2 Problem Statement
A self-assessment was carried out by using EFQM approach, regarding a Research & Development (R&D) Centre, associated to a Portuguese Higher Education Institute (HEI).
This R&D Centre had (at the time) 2 labs, and in a total of 14 researchers (including scholars). This organization preforms research in the areas of Hydrogen Systems and Electrical Machines, which brings several needs to be attended by the R&D Centre, since there is a more diversity of stakeholders.
3.3 Performance Assessment
In a first approach, a self-assessment report was compiled by the internal quality manager of the organization.
Then, the scores, regarding each sub-criterion, criteria and the total score, were specified, based on Tables 1 a) and b) respectively.
According to [11], the EFQM method, is based on a score, which varies from 0% up to 100% (steps of 5%) and is applied regarding each element of sub-criterion, corresponding therefore, to 20 selectable options (steps of 5%).
On our approach, RADAR’s Logic method, the scoring is divided into 5 levels from 0% up to 100% (steps of 25%).
In this context, and particularly in this work, it was developed a fuzzy logic approach, where the numbers of options, was limited to five fuzzy sets, which allows to reduce the imprecision due to the imperfection of knowledge that the individual receives, through its observation from the external world for selecting the proper score.
For the definition of the correspondent membership functions, as a first approach it was used triangular functions, since it’s widely used on related literature represented by 3 parameters (a, b, c), according to the relation a < b < c, with b representing the middle point. The obtained scores can be therefore provided, as a triangular Fuzzy number, whereby consultants, define some scores for the features of sub-criterion elements, by choosing one of 5 Fuzzy sets mentioned (Table 2).
Table 2. Fuzzy sets and membership functions.
Regarding the tables for scoring Enablers and Results as well, scores were then assigned as Fuzzy numbers to each feature of RADAR’s EFQM logic (i.e., Results, Approaches, Deploy, Assess and Refine) and regarding sub criterion, criterion and total scores. The obtained scores went through a defuzzification process, by using the centroid method, to produce a quantifiable result into a Crisp value.
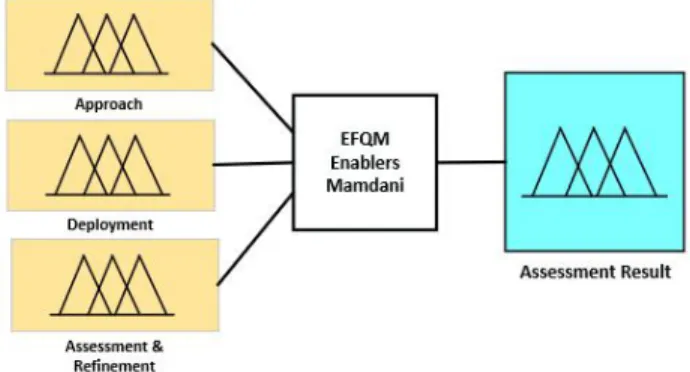
MATLAB’s software was then used to develop the model. On Figure 3, it’s presented one of the architecture’s model used, regarding the Enablers criteria.
The tables, used to score the Enablers’ criteria, is shown on Tables 1 a) and 1 b), respectively regarded to the Enablers and Results Criteria.
Both tables, were used to evaluate each one of the enablers sub-criterion elements, and according to the EFQM’s RADAR’s logic. This was done, based on the amount of collected evidence, which were identified by selecting one of 5 available options, namely; “bad”, “insufficient”, “sufficient”, “good” and “very good”.
Figure 3. One of model’s architecture used (Enablers criteria).
On Figure 4, it’s presented an example of an implementation, regarding the membership’s functions, described on Table 1, related to “Enablers criteria”.
Figure 4. Example of membership functions regarding the variable “Approach” (Enablers criteria).
The preformed calculations, regarding EFQM sub criteria scores, are shown on Table 3 a), regarding enablers and results, and by using the ‘traditional’ EFQM approach.
Table 3 b), displays the final scores, regarding the sub-criteria, correspondent to the 9 criteria used (enablers and results), by using Fuzzy Logic approach.
Figure 5, shows the difference, achieved between the two scoring methods used, by displaying each EFQM criteria, regarding both approaches.
Based on Figure.5, there are minor differences, from both methods. This becomes, even more evident, by comparing the overall scores, regarding both approaches (Table 3 a) and b), respectively). The value of the overall score, achieved from the Radar’s Logic approach, is also presented on Table 3 a), which is quite near to the correspondent value from Fuzzy’s Logic approach (Table 3b)). Strength points were identified, as well as areas for improvement, with both, resulted through the achievement of the scores, regarding EFQM sub-criteria. The value of the overall score, achieved from the Fuzzy Logic method, is also presented on Table
3 a), which is quite near to the correspondent value from
RADAR’s Logic method (Table 3b)). Strength points were identified, as well as areas for improvement,with both, resulted through the achievement of the scores, regarding EFQM sub-criteria.
Table 1. One of the proposed scoring, regarding: a) Enablers criteria b) Results criteria.
a)
b)
Figure 5. Assessment log methods for R&D center used.
3.4 Strength Points and Improvement Areas
On behalf of EFQM framework, strength points were identified, as well as areas for improvement, with both, resulted through the achievement of the scores, regarding EFQM sub-criteria.
Additionally, some forms were distributed, in order to get some relevant opinions and to help to extract the strength points, based on the score achieved before. This was done with the assistance of the elements involved on EFQM assessment, namely: R&D Center collaborators, HEI’s Quality Management Office, and external consultants as well. The strength points, as well as the areas for improvement, were then defined after some meetings take place, and based on the methods defined before.
Regarding the identified areas for improvement, it was considered sub-criterion of 1b, 4c, 5c, 6a and 8b to define the correspondent improvement actions.
Table 3. EFQM assessment for R&D center, regarding a) RADAR’s logic (EFQM) approach b) Fuzzy logic approach.
a)
b)
3.5 Improvement Actions and the
Correspondent Action Plans
Based on the improvement areas, it was defined 5 improvement actions, followed by their correspondent improvement plans as well. The improvement actions are presented on Table 4.
Based on Table 4, it’s given an example of an action plan, regarding Improvement Action No. 5, which is presented below:
• Improvement Action No. 5;
Deadline to perform the improvement action: 4 months; 4 phases were considered:
1- Project team formation,
2- Identification of cost reduction areas, 3- Analysis of results,
4- Development of a final report and conclusions; 2 implemented measures:
5- Creation of 2 capacitor banks,
6- Development of a traction system for electric vehicles.
Table 4. Assessment log for R&D center by using Fuzzy method.
4 CONCLUSIONS AND FURTHER WORK
In this work an integrated approach was proposed by implementing the EFQM model, supported by Fuzzy Logic, to improve the performance of a R&D Center.
On behalf of EFQM implementation, a self-assessment was performed by using two different methods to score sub-criteria, namely; RADAR’s Logic method and Fuzzy Logic.
Then, strength points, as well as the improvement areas, were identified in order to define the actions for improvement. A set of improvement actions were then determined, regarding each area for improvement, followed by their respective action plans. The use of EFQM Excellence Model, has revealed to be a practical tool, which can be used for carrying out self-assessment in other R&D Centers, to improve their overall performance. As an example of further development, the proposed approach can be improved in this case, by combining Fuzzy Logic, with multi criteria methods (e.g. AHP, ELECTRE, PROMETHE, among others) to prioritize the improvement areas, as well as their actions.
ACKNOWLEDGMENTS
This work was partially supported by FCT, through IDMEC, under LAETA, project UID/EMS/50022/2019.
REFERENCES
[1] A. Bayo-Moriones, J. Merino-Díaz-de-Cerio, S.A. Escamilla-de-León, R. Mary Selvam, The impact of ISO 9000 and EFQM on the use of flexible work practices, Int. J. Prod.
Econ. 130 (2011) 33–42.
[2] A. Rabbani, M. Molavi, Y. Beigzadeh, Evaluate and rank the performance of total quality management in manufacturing organizations with approach of Fuzzy ANP, Report Opin. 5 (5) (2013) 67–79.
[3] Abreu, A.; Calado, J. M. F. (2017). A fuzzy logic model to evaluate the lean level of an organization. International
Journal of Artificial Intelligence and Applications (IJAIA),
Vol.8, No.5, pp.59-75. DOI: 10.5121/ijaia.2017.8505. [4] Abreu, A.; Martins, J. D. M.; e Calado, J. M. F. (2018)
“Fuzzy logic model to support innovation risk assessment in ecosystems”. Proc. of 3th APCA International Conference on Control and Soft Computing (CONTROLO 2018), Ponta
Delgada. Açores, Portugal, 4 a 6 de junho, pp. 104-109.
[5] Abreu, A; Martins, José; Calado, João (2018). A fuzzy reasoning approach to assess innovation risk in ecosystems;
Open Engineering, Open Engineering, 8 (1), pp. 551–561,
ISSN (Online) 2391-5439, doi.org/10.1515/eng-2018-0067. [6] J. Hosseini Azabadi, Determining of Improvement Projects
Based on EFQM Excellence Model in Yazd Regional
Electric Co. B.S. Dissertation in Industrial Engineering,
Yazd University, Iran, 2006.
[7] J. Michalska, Using the EFQM excellence model to the process assessment, J. Achiev. Mater. Manuf. Eng. 27 (2) (2008) 203–206.
[8] K. Shahroudi, The application of data envelopment analysis methodology to improve the benchmarking process in the EFQM business model – case study: automotive industry of Iran, Iran. J. Optim. 1 (2009) 243–265.
[9] M.A. Mariscal, S. García Herrero, A. Toca Otero, Assessing safety culture in the Spanish nuclear industry through the use of working groups, Saf. Sci. 50 (2012) 1237–1246.
[10] N. Salehi, M. Ghajar Sepanlou, B. Jafari Gorzin, An evaluation of soil fertility using soil organic carbon,
potassium, phosphorus and salinity factors for rice cultivation by Fuzzy Logic and AHP techniques, Int. J. Agric. Crop Sci.
(IJACS) 5 (19) (2013) 2233–2241.
[11] Santos, R., & Abreu, A. (2019). Implementation of an EFQM model in a Higher Education Institution in Portugal. Recista Produção e Desenvolvimento, 5, doi:
https://doi.org/10.32358/rpd.2019.v5.365
[12] Simões Santos, Ricardo & João Pina da Costa Feliciano Abreu, António. (2019). EFQM model implementation in a Portuguese Higher Education Institution. Open Engineering. 9. 99-108. 10.1515/eng-2019-0012.
[13] U. Cebeci, Fuzzy AHP-based decision support system for selecting ERP systems in textile industry by using balanced scorecard, Expert Syst. Appl. 36 (2009) 8900–8909.
![Figure 1. EFQM 2013 Model [11]](https://thumb-eu.123doks.com/thumbv2/123dok_br/15964555.1100094/2.918.101.827.241.548/figure-efqm-model.webp)