José Pedro da Silva Gouveia Proença
Licenciado em Ciências da Engenharia Eletrotécnica e de Computadores
Web-based Interface for Tailored Time Series
Analysis and Visualization
Dissertação para obtenção do Grau de Mestre em Engenharia Eletrotécnica e de Computadores
Orientador: Doutor José Manuel Fonseca, Professor Associado com Agregação,
Faculdade de Ciências e Tecnologia da Universidade Nova de Lisboa
Co-orientador: Doutor Ricardo da Costa Branco Ribeiro Matias, In-vestigador, Fundação Champalimaud
Júri
Presidente: Doutor Rodolfo Alexandre Duarte Oliveira Arguente: Doutor Rui Manuel Leitão Santos Tavares
Web-based Interface for Tailored Time Series Analysis and Visualization Copyright © José Pedro da Silva Gouveia Proença, Faculdade de Ciências e Tecnologia, Universidade NOVA de Lisboa.
A Faculdade de Ciências e Tecnologia e a Universidade NOVA de Lisboa têm o direito, perpétuo e sem limites geográficos, de arquivar e publicar esta dissertação através de exemplares impressos reproduzidos em papel ou de forma digital, ou por qualquer outro meio conhecido ou que venha a ser inventado, e de a divulgar através de repositórios científicos e de admitir a sua cópia e distribuição com objetivos educacionais ou de inves-tigação, não comerciais, desde que seja dado crédito ao autor e editor.
For my parents who have been the force that pushes me towards knowledge and personal improvement. For my brother who’s example and courage have shown me that
achieving these goals is possible. For Ana Catarina Rato who thought me a better way to be happy.
Ac k n o w l e d g e m e n t s
Before anything else, I would like to acknowledge and thank my advisors PhD José Manuel Fonseca and PhD Ricardo da Costa Branco Ribeiro Matias, who made this project possible. To José Fonseca I would like to thank all the knowledge, sincerity and avail-ability. His advices marked me not only during this project, but throughout my whole academic course. To Ricardo Matias I would like to thank his thrust, vision and never ending eager to perform better work and achieve bigger results. Their vision and advise are the reason why this work is relevant in the field of Electrical and Computer Engineer-ing as well as that of motor skill disorders.
A strong word of acknowledgement toKinetikos and all of its working force. They were
my daily company throughout this project. I’ve learned so much from them.
I also want to thank FCT-UNL for all the efforts made for their students, not only in the multiple academic fields, but also at the human level.
Another acknowledgment to my great friend João Pedro Lopes, who accompanied me since the beginning of this journey in FCT-UNL, for his ambition and work habits made me realize that anything is possible if we give our very best.
To my family, for they shape their lives to make all of this possible. To Ana Catarina Rato, for she was always the helping hand.
A b s t r a c t
In the field of movement disorders there is a clear need for more accurate and insightful metrics to support clinicians in their decision-making process. These metrics should be easy to understand and get presented to the clinician in an intuitive way, to avoid creat-ing a wall between clinicians and their patients. This could happen if the information system that presents these metrics requires too much interaction, if it doesn’t show the relevant data for each situation or even by delaying the information collection and its processing. Clinical Decision Support Information Systems have been growing in usage and usefulness, but still, there are cases of miss-implementations, that don’t put the user in the first place, or that don’t take into consideration their workflows. This leads to less effective health care and poorly spent resources.
With this project we will produce a customizable web interface, to integrate such a system, that must have clinicians and their needs as the first priority. This interface has to be fast and intuitive, while, at the same time, present useful and clinically relevant metrics. Additional information will be presented as optional and non-intrusive, not requiring any input from the user unless he wants to interact with it.
R e s u m o
No campo das disfunções do movimento existe uma necessidade clara de métricas rele-vantes e precisas que apoiem a decisão médica. Estas métricas devem ser apresentadas aos clínicos de forma intuitiva e fácil de entender, para que não se crie uma barreira entre o paciente e o seu médico. Tal poderá acontecer se o sistema que apresentar estas métricas necessitar de demasiada interacção do utilizador, se não mostrar as informações relevantes para cada situação, ou ainda por levar a atrasos na coleção e tratamento dos dados. Os Sistemas de Informação Médica têm vindo a crescer, tanto na sua utilização como na sua utilidade, no entanto, ainda existem casos de sistemas mal implementados, que não põem o utilizador em primeiro lugar, nem têm em consideração os seus ritmos e modo de trabalho. Isto resulta num cuidado médico menos eficaz levando ao desperdício de recursos.
Neste projeto iremos produzir uma interfaceweb customizável integrada num Sistema
de Informação Médica, que terá os clínicos e as suas necessidades como primeira priori-dade. Esta interface será rápida e intuitiva, apresentando métricas e informação clinica relevante. Toda a informação adicional terá de ser apresentada como opcional e de forma não intrusiva, pelo que não poderá requerer nenhuma interacção do utilizador a não ser que o mesmo assim o deseje.
Palavras-chave: Sistemas de Informação Médica, Métricas Clínicas, Marcha, Interface Web Customizável
C o n t e n t s
List of Figures xv Glossary xvii Acronyms xix 1 Introduction 1 1.1 Goals . . . 1 1.2 Motivation . . . 1 1.3 Dissertation Framework . . . 31.3.1 Integration With Clinical Information Systems . . . 3
1.3.2 Integration With Electrical and Computer Engineering . . . 3
1.4 Dissertation Organization . . . 3
2 State of the Art 5 2.1 Introduction . . . 5
2.2 Clinical Information Systems . . . 5
2.2.1 Advantages and Disadvantages of a CIS . . . 6
2.2.2 What Needs to be Addressed When Creating a CIS . . . 8
2.3 Time-Series Analysis and Visualization . . . 9
2.3.1 Gait . . . 9
2.4 Web Interfaces . . . 13
2.4.1 Web-App . . . 14
2.4.2 Browser Technologies . . . 14
3 Pre Development 17 3.1 Features and Constraints . . . 17
3.2 Template Layout . . . 18 3.3 Informative Cards . . . 19 3.4 Design . . . 20 3.4.1 Report . . . 20 3.4.2 Cards . . . 21 3.4.3 Mobile . . . 23
C O N T E N T S 4 Development 25 4.1 Database Design . . . 25 4.1.1 Template . . . 25 4.1.2 Exam_id_Template . . . 26 4.1.3 Template_text . . . 26 4.1.4 Card . . . 26 4.1.5 Card_text . . . 26 4.1.6 Card_type . . . 27 4.1.7 Card_type_text . . . 27 4.1.8 Exam_id_card . . . 27
4.1.9 Option and Option_text . . . 27
4.1.10 Action and Action_text . . . 27
4.1.11 Link and Link_text . . . 28
4.2 Template Construction . . . 29
4.2.1 Asynchronous Calls . . . 29
4.3 Implementation of the Drag and Drop Feature. . . 31
4.4 Card Construction. . . 32
4.4.1 Scalable Vector Graphics (SVG) and D3.js Considerations . . . 32
4.4.2 D3.js Plot Implementation . . . 33
4.4.3 Developed Cards . . . 36
5 Discussion and Results 43 5.1 Report Overview. . . 43
5.1.1 Patient Admission . . . 43
5.1.2 Follow Up Sessions . . . 45
5.1.3 Discharge . . . 46
5.2 Discussion . . . 47
6 Conclusions and Future Work 51
Bibliography 53
L i s t o f F i g u r e s
2.1 Six phases of a gait cycle. Image taken from [32]. . . 11
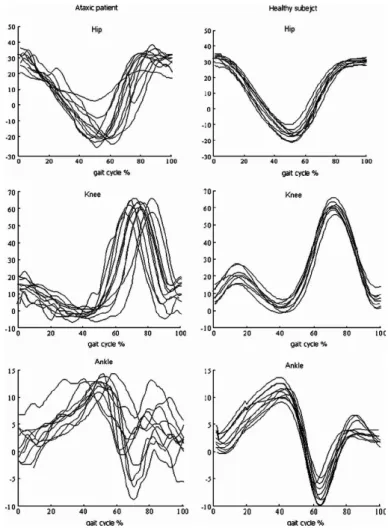
2.2 Multiple examples of gait cycles representing the hip, knee and ankle an-gle(deg) in order of the cycle’s percentage of completion. Image taken from [28]. . . 11
2.3 Example of an angle-angle plot representing knee and ankle joints during a gait cycle for a healthy population. Image taken from [30]. . . 12
2.4 Plot of the Ankle’s angle(deg) in a normal gait cycle and upper and lower bounds. Image adapted with permission from a Kinetikos’ gait report. . . 13
3.1 Example of one report template created during this project. . . 19
3.2 Detailed Report Header. . . 20
3.3 Detailed Report Header. . . 21
3.4 Collapsed Report Header. . . 21
3.5 Example of the side bar with a calendar. . . 21
3.6 Initial draftings of one of the Card Types. . . 22
3.7 Report drafts (on the top) and an example of a report by the end of this project (on the bottom). . . 23
3.8 Set of drafts for the report as viewed on a mobile browser. . . 24
4.1 Data model used for the current project. . . 28
4.2 Template while waiting for the response of the asynchronous Ajax posts made to get the clinical data. . . 30
4.3 Template canvas grid. . . 31
4.4 Template while card is being dragged. . . 32
4.5 Example of a radar plot card type. . . 34
4.6 Radar Plot coordinate system. . . 35
4.7 Example of an Interactive Line Plot type of Card. . . 36
4.8 Example of an Events Plot type of Card. . . 37
4.9 Example of an Horizontal Bar Chart type of Card.. . . 37
4.10 Example of an Large Editable Text Area type of Card. . . 38
4.11 Example of an Small Editable Text Area type of Card. . . 38
4.12 Example of a Metrics type of Card. . . 38
L i s t o f F i g u r e s
4.14 Example of a Small Text Output type of Card. . . 39
4.15 Example of a MPLD3 type of Card. . . 39
4.16 Example of a Radar Plot type of Card. . . 40
4.17 Example of a Percentage Circle type of Card. . . 40
4.18 Example of a Single Value type of Card. . . 40
4.19 Example of a Single Line Plot type of Card. . . 41
4.20 Example of a Single Line Plot With Dropdown Menu type of Card. . . 41
4.21 Example of a Video type of Card. . . 41
4.22 Example of a Link type of Card. . . 42
4.23 Example of a Files Upload type of Card. . . 42
4.24 Example of a Metrics Plot type of Card.. . . 42
5.1 Multiple report views. . . 44
5.2 Example of an hypotheticalOverall report tab.. . . 45
5.3 Example of an hypotheticalClinical Data report tab. . . . 45
5.4 Example of an hypotheticalKinematic report tab. . . . 46
5.5 Example anEvents card. . . . 46
5.6 Example of an hypotheticalClinical Data report tab. . . . 47
5.7 Example of an hypotheticalKinematic report tab, with knee flexion highlighted for both the admission(orange) and discharged(red) sessions. . . 47
G l o s s a r y
Clinical Information System Information System that enables the collection and ma-nipulation of clinical data allowing the construction of a clinical data history for each patient. This, in conjunction with the easing of health information exchange, relevant charts and possibly some artificial intelligence built right into the system, is the foundation of a good clinician deci-sion support, that this type of system aims to be.
Clinician Decision Support Decision making support, given possibly from a CIS in the form of metrics and graphs, that helps the clinician validate his or her reasoning regarding one patient. Web-App Application that runs on a browser, making use of an
Ac r o n y m s
CDS Clinical Decision Support. CIS Clinical Information System. CSS Cascading Style Sheet. DOM Document Object Model. DST Double Stance Time.
FCT Faculdade de Ciências e Tecnologia da Universidade Nova de Lisboa. FF Foot Flat. HO Hell Off. HS Heel Strike. MS Mid-Stance. MSW Mid-Swing. OS Operating System. ROM Range Of Motion. SPT Stance Phase Time. SST Single Support Time. SVG Scalable Vector Graphics. SWT Swing Time.
C
h
a
p
t
e
r
1
I n t r o d u c t i o n
In this chapter, we will first take a look at what this work goals and motivations are. In other words, what is the problem that we are trying to solve and what solution are we aiming to build. Then we will talk about this dissertation’s framework and see in what ways does it integrate into the fields of Clinical Information Systems and Electrical and Computer Engineering. Finally, we will explain how is this dissertation organized.
1.1
Goals
In the current work, we aim to build a web-based interface for tailored time series analysis and visualization. The main focus area for this web interface will be its integration on a
Clinical Information System (CIS), aimed primarily at movement disorders. This inter-face needs to be completely customizable to meet the specific needs of every physician presenting only the relevant metrics and charts. This solution will be built for the web, usingHTML5, CSS and CSS-Grid, Django, JavaScript, D3.js and a few other technologies.
It’s important to note that this work is a partnership between Faculdade de Ciências e Tecnologia da Universidade Nova de Lisboa (FCT)andKinetikos (Coimbra, Portugal) and
comes from the necessity to create a tailored user interface for theReport area of Kinetikos’
ownCIS, that puts in the hands of their users the ability to customize the reports of their patients.
1.2
Motivation
For the vast majority of diseases, there are tests and clear metrics to aid and support the decisions made by clinicians. As an example, in the case of diabetes we have the
C H A P T E R 1 . I N T R O D U C T I O N
glycohemoglobin test, that gives information about the patient’s average levels of blood glucose [22] to the clinician. That’s not so much the case, however, for movement dis-orders, where there is the need for more effective and clear metrics to assess a patient’s state and evolution. Even more, evidence-based medicine is still not easy for physicians to practice, [2] making its adoption smaller than desired [18], despite its broad support in health care.
It’s from this necessity to support clinical decisions with evidence-based data, specially in the field of movement disorders, that comes the motivation for this work. We believe that by building an intuitive web based medical report interface, to be integrated on a
CIS, we’ll be able to simplify their practices, and support their clinical decisions. This support would come, naturally, from displaying useful and accurate data, alongside with movement-related scores that represent the patient state and evolution throughout the treatments. This work gains even more relevance given the fact that movement is an essential part of life, sometimes overlooked and not subjected to good medical care in an useful time frame. For example, movement plays a major role in our physical, cognitive and social development, specially in younger ages. [9] Hence the major role of good as-sessment and diagnosis tools in the field of physiotherapy.
During this work, as we’ve seen, we’ll build a report page to display a patient’s clinical information in an intuitive way, but it’s important to understand how is this information getting collected. This is done with the help of sensors to assess lower limb 3D biome-chanics, that are placed on the patients while they move. Then, withKinetikos algorithms,
the raw sensor data that got collected, is converted both into scores and time series. Another aspect that motivates us, is that the utilization ofCIShas been, not only growing, but also increasing its usefulness in the medical environment. This type of information system enables the continuous monitoring and manipulation of a patient’s clinical data, storing all of his medical history, [3,21]. By doing so, aCIShas the ability to aid clini-cians in their work environment in a lot of ways, as diverse as charting,Clinical Decision
Support (CDS), Computerized Physician Order Entry or even the exchange of medical
information [21]. However, aCIShas to be built with the clinician in mind, taking into consideration his needs and the way he will be interacting with it. ACISmust never get in the way of a patient and his clinician.
We see then, that since in the field of movement disorders we are lacking data to support clinical decision and since CIS are gaining momentum and relevance in the clinicians way of work, there is a clear need for a highly customizableReport area, that presents
clinicians the information they want about each patient in an intuitive way, when and how they want it. A type ofCISbuilt with such abilities would mean a clear ease in the clinician interaction with the system and could lead to great improvements in the results
1 . 3 . D I S S E R TAT I O N F R A M E WO R K
regarding the patient’s rehabilitation.
For all of these reasons, we hope that the present work comes as a great move forward in the field of movement disorders, andCISin general, helping clinicians and their patients in the journey towards recovery and long-time health monitoring.
1.3
Dissertation Framework
1.3.1 Integration With Clinical Information Systems
As we’ll see in2.2.1, a well-conceivedCIScan have a great positive impact in the workflow of a clinician [21], in the one hand, by the way it handles data collection and its man-agement and, in the other hand, by the way that data is contextualized and presented, opening the door to the above-mentionedCDStechniques,1.2. Non the less, there is still a great need for better and more intuitive information systems inside clinic facilities. The two main problems of the currentCISin use, are the amount of time the clinicians lose because of systems inefficiency, and the lack of clarity in the sense that the system doesn’t reflect the workflow of the user.
With the construction of a report page that is customizable we think clinicians will be free to create a more friendlyCIS, that they can tailor to better represent their workflow. 1.3.2 Integration With Electrical and Computer Engineering
This work gains its relevance in the field of Electrical an Computer Engineering, from the fact that it consists in the development of an information system, aimed at clinicians with the intent to solve some of the problems, discussed on Subsection2.2.1, found in the currently usedCIS.
1.4
Dissertation Organization
The current Dissertation is divided in 6 chapters: By now, in this first one, we discussed our motivation and how this work integrates the fields ofCIS as well as Electrical and Computer Engineering.
Next, in the second chapter, we will explore what has already been done in the field ofCIS, time-series analysis and visualization for motor disorders and, lastly, in the field of tailored and customizable web systems. RegardingCIS, their advantages and disadvan-tages will be addressed, as well as, what, according to the community, should be the main focus points and guidelines, about the usability and built of such a system. Some aspects of what is possible when it comes to presenting data in meaningful ways, especially in a
C H A P T E R 1 . I N T R O D U C T I O N
Later, in the third chapter, the pre development phase is described. We start by clar-ifying the features and constraints of the solution that we built, to better understand our goals. The first ideas and solution concepts are also discussed, as well as all the design process.
With the forth part of this document, comes the development phase, where we talk about all the major aspects that came with the production of the report page. These aspects range from the database structure, to some Front-End concerns and decisions that needed to be made.
In Chapter 5, we get to the discussion about the results achieved with the construction of our solution. Such discussion is made with an eye on all this work features and con-straints, presented in Chapter 3, and all the information gathered throughout the State of the Art,2.
By the end of this Dissertation, we present all the conclusions that can be taken from what was created during this process, alongside some possible future work.
It is also very important to note that, this being a partnership betweenFCTandKinetikos™,
the execution of this work took place atKinetikos’ offices.
C
h
a
p
t
e
r
2
S ta t e o f t h e A rt
2.1
Introduction
In the present chapter, we will look at the current state ofCISand the technology that we’ll use to reach the goals set for this dissertation work. We will also take some time to understand what are the standard tests and representations of movement in the medical field regarding gait, since those metrics and time series will be the ones present on the final medical report produced by the end of this dissertation.
2.2
Clinical Information Systems
As stated inThe electronic medical record, safety, and critical care [5], since the year 2000 the interest in Electronic Medical Recording has been growing. With the promise of reducing deaths related to medical error, the implementation of systems that enabled Computer-ized Physician Order Entry in Intensive Care Units has given way to the creation and growth of what we perceive today as being aCIS.
As we said in 1.2 a CIS is a computer program that enables the collection, manipula-tion and visualizamanipula-tion of clinical data. This data and medical records are what makes a
CISsomething more than just a patient management tool, because they are what enables
CDS. The concept ofCDSis defined as being the process to enhance the decisions and actions made in the health environment, thus improving healthcare delivery, by using pertinent and organized clinical knowledge, alongside the patients information. [6,24] This support given to clinicians by their use of aCIS can come in four forms [6, 24], namely:
C H A P T E R 2 . S TAT E O F T H E A R T
history. It is important in this phase to make this process easy and quick, but simply, with data entry the clinician can collect all the data in a single place;
• Data Review - This support area comes in the form of the visualization of the data in an organized form. The data can be, as an example, the real time vital signs of a patient. [6] In the case of this work, the data review aspect will come in the form of the created report area, that allow clinicians to see the clinical data and metadata about each patient;
• Assessment and Understanding - We can look at the assessment of the entered data as the process of transforming it into clinical insights and information, to support clinicians as they discuss treatment options [6]. This goes a little further than just presenting the raw data to clinicians, but rather giving then real information upon which they can act. This type of assessment will also be present on the report area created during this work in the form of the displayed metrics calculated using
Kinetikos expertise and intelligence;
• User Triggered Support - Such support comes in the form of alerts to draw the clini-cian’s attention to something specific like an abnormal test result about a patient, or an examination that is due today. [6] In the current work some of this aspects were also implemented, like a small calendar where a clinician can see his appointments. These systems should also process this data, retrieving useful information, like scores and charts presenting them in meaningful ways. Some of these metrics and time-series will be covered in section2.3. In this manner, these systems can be quite useful aiding clinicians in their decision-making process. [18]
By applying these techniques to aCISaimed at motion skill disorders, we hope to improve the effectiveness and reduce the errors in health care delivery.
2.2.1 Advantages and Disadvantages of a CIS
As with all solutions, aCIScan have great advantages, but, when poorly implemented, can also have a few downsides. Let’s look at both advantages and disadvantages, taking into consideration what is said in [21], so that we have a better understanding of these systems and what areas should be taken into heavy consideration while undergoing the construction of this project.
2.2.1.1 Advantages
Regarding the advantages we have:
• Data Collection [6] - Given it’s capabilities, CIS can take in and structure large amounts of data, that can be used to provide better medical care or to study new
2 . 2 . C L I N I C A L I N F O R M AT I O N S Y S T E M S
ways of treatment. In the field of movement disorders, aCIScan allow clinicians to collect data about the patient’s motion, possible with the help of sensors, or to register values such as step length, or range of motion, and then use os of this data to retrieve clinical insights.
• Data Availability [21] - The physician has access to all the relevant data collected about it’s patients.
• Data Sharing [21] - Despite not being consensual in which manners data sharing in CIS should be done, with structured data, sharing of knowledge and useful information is made very easy. This can be extremely helpful for studies [33] and also, for a better communication between physicians, which can help inCDS. • Data Security [21] - Unlike what happens with paper logs, data collected through
a CIS, if well implemented, is stored with a great amount of security measures, including encryption of all patient records. Further, data stored in servers is usually stored with redundancy, having copies in several places around the world, so that it can always be retrieved despite server failures or natural catastrophes. In other cases, the stored files are divided into many pieces, storing each piece in different serves, making it impossible to retrieve all of the information stored, in the remote event of one of them being hacked.
• CDS [21] - When presented in meaningful ways, data about a patient’s medical history and current health state can be of great value to validate or aid a clinical decision. This data can tell if a chosen method is being successful towards patient recovery and at what rate is that recovery taking place. As discussed in the begin-ning of this chapter this support can be given in four formats, Data Entry, Data Availability, Assessment and Understanding and lastly User Triggered Support. • Implementation of Best-Practice Guidelines - ACIS can have the best-practice
guidelines integrated into the user’s workflow, thereby improving care given to the patient. [21]. By using these workflows there is less room for human error, as an example, from skipping some essential step in an examination.
2.2.1.2 Disadvantages
Looking now at the possible disadvantages regardingCIS, we have:
• Implementation Errors - Being an information system, aCIS is always prone to implementation errors, such as miscalculated metrics or confusing and not user friendly interfaces, that don’t respect their natural work flow. [21,29]
• Efficiency Decrease [21] - A system like this, if badly implemented may increase the steps that a physician has to take to accomplish a certain goal. The learning curve to specialize in the CISwork flow can be quite big, specially if it was built
C H A P T E R 2 . S TAT E O F T H E A R T
without any consideration for the physicians natural work flow. Lastly the system could be really slow or depend on the Internet’s availability or velocity.
• System Dependency - Being a computer system, aCIS needs some resources to function, such as an Internet connection or certain Hardware. If any of the compo-nents of the system fail, it might turn completely useless, making the flow of data impossible. [21].
2.2.2 What Needs to be Addressed When Creating a CIS
After the presentation ofCIS’s advantages and disadvantages, it is time to look into what the community thinks are the main focus points when starting the implementation of such a system. A lot of the points that we are about to present are intrinsically tied to the Report page that is the central part of this project.
First of all, it is very important to never forget that aCISis a system that will be used by clinicians, a lot of times during their appointments with the patients. This means that their workflows need to be addressed [2,6] and that the team building the system needs to know very well what are the main problems that need to be tackled down. In order for aCISto be good, it has to have efficient workflows and require little training to learn. [21] Secondly, this type of system needs to operate really fast. As said by Shabot, M Michael, the most important parameter for clinical users is the response time of the systems they use during their day-to-day utilization, namely subsecond response times [2, 29]. So during this project speed must be a key factor, prioritized well above all the others, even that of having a clean and beautiful design.
One point of real importance is that all the information provided to the clinician, specially that that comes from the assessment of clinical data should always be evidence based [6]. Another important attribute of a CIS is the delivery of only the relevant information where and when it’s needed. [6] This is one of the main focus points of this project, where the Report page can be tailored to fit each physician preferences. It is very important to implement all of the features in a nonintrusive way. Additional capabilities or informa-tion should appear as opinforma-tions that don’t require the user’s dismiss. They should make them self-present when the user needs them, [2] but not require any action unless the he wants to use them [29]. A good example, as stated in by Michael Shabot [29] is theCIS
used by Brigham and Women’s Hospital, named BICS. This system had an interesting feature, that consisted of showing the patient’s last measured potassium level alongside the dose level choices, when the physician ordered digoxin. This meant that the rele-vant information was present when needed, but didn’t require any interaction unless the physician choose to act upon it.
2 . 3 . T I M E - S E R I E S A N A LY S I S A N D V I S UA L I Z AT I O N
One thing that is relevant and should not be overseen in a CISis its usability [2]. The development team has to make it really easy for the clinician to act as intended with as little effort as possible. This means that the design aspect of the system must reflect the action that is intended in each state. As we said previously, if something is just additional information, it should be nonintrusive [29], but, in the case that something should not be ignored, it must be hard to ignore it [2]. To enable a betterCDS, the information must be presented in the right way [6]. This will also be a major concern in our work.
As any computer system, aCIS will most likely be subjected to iterations and adjust-ments. This need to implement new features or change some of its core aspects, one of the main ones being the physician workflow, has to be forethought so that it may be an easy process in the future. Also, the databases upon which theCDSis created, need to be constantly revised and updated. [2]
Concluding, after looking at all of these considerations we can say that the main con-cern for the creation of a CISis its speed, and a great understating of the real needs of clinicians prior to its construction. ACISbuilt with user-interfaces that have the clinician requirements in mind will show better results and be quite more effective. Ahmed A et
al. have tested just that, and concluded that user interfaces within a standard electronic
medical record that are developed with an understanding of the healthcare provider’s needs, turnout to have more advantages than the currently used interfaces, that didn’t had those concerns as a priority. [1]
2.3
Time-Series Analysis and Visualization
In what concerns our project, given that it will be designed to integrate aCISaimed at motor skill disorders, it is important to have a clear understanding of what type of time-series we’ll encounter. These time-time-series will represent certain movements of the human body, such as gait.
2.3.1 Gait
Gait can be described as being a person’s manner of ambulation or locomotion [14,16] and it involves the whole body. The standard gait cycle at a normal walking speed in-volves the lower limbs as well as the trunk and arms that are used to provide stability and balance. [16] Also during gait, the three major joints of the lower body and pelvis, are working in conjunction with the muscles to propel the body forward. [16] As for the cycle itself for one leg it is described as a repetitive pattern, composed of two major phases called stance phase and swing phase, the first one making for 60% of the cycle and the second, the remaining 40% [14,19]. During the stance phase, the foot is always in contact
C H A P T E R 2 . S TAT E O F T H E A R T
with the floor, while the swing phase goes from the initial moment where the foot spots touching the floor until it makes contact again. [23]
As we can see from figure2.1, these two phases can then be subdivided into six more detailed phases, which are: [14,16,19,23]
1. Heel Strike (HS):
• Happens when the heel makes contact with the ground; • The hip is flexed at 30° and the knee is fully extended; [14] • Marks the start of the gait cycle;
• The leg begins to receive the weight of the body; 2. Foot Flat (FF):
• At this point, we are at 10% of the full gait cycle; • The foot lays flat on the ground;
• All the body weight is placed on this leg, and we enter single limb support; • The second leg starts swing phase;
3. Mid-Stance (MS):
• Goes from 10% to 30% of the gait cycle;
• The body stops absorbing the impact on the floor, and transitions to forward propulsion; [14,16]
• Right after this point, Hip-extension begins; 4. Hell Off (HO):
• Occurs at 50% of the cycle;
• Contact between the heel and the floor ends; • Knee flexion between 0° to 5°; [14,19] 5. Toe Off (TO):
• Happens at 60% of the gait cycle; • Marks the end of the stance phase; • The knee flexes between 35º and 40°;
• The toes no longer touch the ground. [14,19];
6. Mid-Swing (MSW):
• Marks the middle of the swing phase and occurs at 87% of the cycle; 10
2 . 3 . T I M E - S E R I E S A N A LY S I S A N D V I S UA L I Z AT I O N
• The tibia is vertical and perpendicular to the ground;
After all of these phases, the cycle ends when the heel makes new contact with the ground.
Figure 2.1: Six phases of a gait cycle. Image taken from [32].
Figure 2.2: Multiple examples of gait cycles representing the hip, knee and ankle an-gle(deg) in order of the cycle’s percentage of completion. Image taken from [28].
When it comes to the representation of these events, a usual representation uses the angles of the Ankle, Knee or Hip in order of the percentage of gait cycle or time spent as showed in Figure2.2. Doing such representations, that have these large amounts of data and variables, can evidently result in a hard to read plot. So, giving into consideration
C H A P T E R 2 . S TAT E O F T H E A R T
what was discussed in 2.2.2 about the intuitiveness of a CIS, it is important that the representations presented in the final solution of this work have the ability to be zoomed or panned, and even the ability to dismiss individual lines in a plot. This concerns were present in the development phase, as can be seen in3.1or4.4.3
Another possibility is the representation of angle-angle between two of these variables, for example, ankle-knee, as we can see from figure2.3.
Figure 2.3: Example of an angle-angle plot representing knee and ankle joints during a gait cycle for a healthy population. Image taken from [30].
It is then important to understand how this type of event is found from a continuous recording of a person’s gait. The most commonly used segmentation algorithms are peak detection algorithms based on the Z-score rule. [17] As an example, the first method takes advantage of the fact that the signal recorded has semi-periodic characteristics, namely, peaks and vales, that are maximums and minimums of the signal. New and more robust methods have been presented, due to the need for algorithms less prone to signal noise. This need comes from the fact that a patient with a pathological gait usually has multiple noisy peaks, in opposition to the theoretical gait cycle, [15] thus making it harder to segment the cycles. One of these robust algorithms is the one proposed by Jiang, Shuoet al. where the algorithm makes use of interpolation in the time domain to eliminate false
peaks and detect the ones that are missing, since the cycle lengths, despite the patholo-gies, tend to be uniformly distributed. [17]
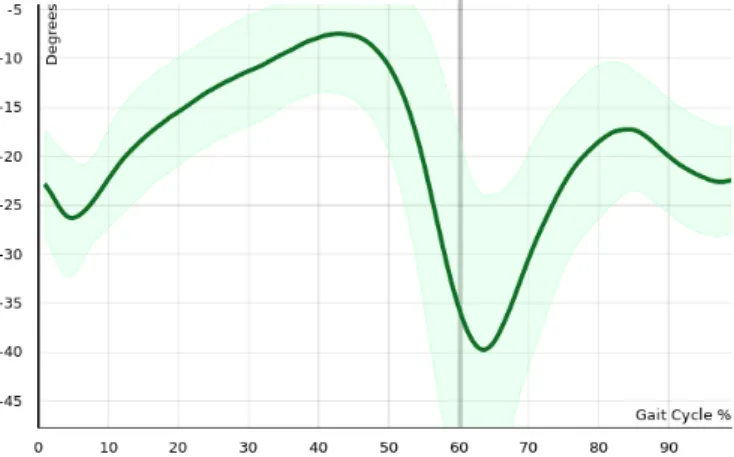
After having these gait events detected, another necessity is to calculate objective scores for a patient’s gait, which will be one of the main focus points of this project. A really in-tuitive way to do this, for example, is to normalize the obtained signal and compare with the one of normal gait accounting for the standard-deviation, calculating the percentage of time that the signal was not between the upper and lower bounds, like shown in the figure2.4.
2 . 4 . W E B I N T E R FAC E S
Figure 2.4: Plot of the Ankle’s angle(deg) in a normal gait cycle and upper and lower bounds. Image adapted with permission from a Kinetikos’ gait report.
From the detected events we can also extrapolate some temporal features, namely
Swing Time (SWT),Single Support Time (SST),Stance Phase Time (SPT)orDouble Stance Time (DST). [7] These features will then help us compare the subject to the normal range of values, attributing a score to the obtained gait cycle signal that can help the clinician make his decision or accessing the subjects evolution throughout the treatment.
SWTwill be the time passed from TOuntilHS. Related to this metric, is theSST, be-cause“in fact, one leg’sSSTis exactly the same as theSWTof the other leg”. [7] As for theSPT, this will be the time passed when the foot is touching the ground, so fromHStoTO, while inDST we calculate the time where both feet are making contact with the ground. [7] This time goes fromHSof the first leg untilTOof the second one.
In short, the main calculations that we’ll be made during this project are: [7]
SW T =T O−HS (2.1)
SSTRightLeg =SW TLef tLeg
SSTLef tLeg =SW TRightLeg
(2.2) SP T =HS−T O (2.3)
DST =SP TLef tLeg−SW TRightLeg
DST =SP TRightLeg−SW TLef tLeg
(2.4)
2.4
Web Interfaces
In this section, we’ll cover what the best options are for building our web interface and its core features. But first of all let’s dive into the reason why, at the beginning of this project, building aWeb-Appwas the chosen option.
C H A P T E R 2 . S TAT E O F T H E A R T
2.4.1 Web-App
The web browser is one of the main content consuming software, existing since the early 1990’s. It has been evolving ever since, with a lot of breakthrough moments in the most recent years. A lot of sources declared web-apps the way to go, stating that it will be the major way to interact with content in the future.
This type of application has a lot of advantages over the more traditional approach of creating a local program [13,34] that runs either on Windows, Macintosh, Linux, or any of the mobile platforms’ software, such as Android or iOS. The main advantages have to do with the fact that despite some layout differences, all web browser will show the same app, with the same features, leaving out the need to build a different app in a different language for every type of Operating System (OS). This also makes updating the app really fast, given the fact that the whole team is working on the exact same application, and, as we said in2.2.2, being able to be quickly updated is one important aspect of aCIS. Also, since there is no need to download or install any part of these type of applications, all users are always on the most up to date version.
However, there are at least two major downsides in this type of approach. The first one is that aWeb-Apprelies on the existence of an Internet connection and, in order for the application to run smoothly, it has to be a strong one. In the recent years, with the evolution of web technologies and the introduction of WiFi and 4G LTE connections, this is starting to be less and less of a problem. In the case of clinics and hospitals, the need for this type of connection is known in advance, so the contracted bandwidth should have this type of use in mind, hence making it less likely for the system to suffer from slow In-ternet. The second major downside, however, is precisely the need to have such a contract, that, to fill the needs of these systems, will have to be considerably more expensive. [13,
31,34]
2.4.2 Browser Technologies
The Web Browser as said in2.4.1has been evolving, and became one of the primary means to transmit and display information. The browser is the way into the web, and thus, the technologies behind it have been getting better and better at displaying information in intelligent and significant ways. Some of these technologies come in the form of libraries or frameworks that enable a more high-level approach to the page flow or allow the construction of really precise interactive charts, videos or 3D models. In this section, we will take a quick look at the major technologies that will help us achieve our goals during this project.
2 . 4 . W E B I N T E R FAC E S
2.4.2.1 D3.js
D3 stands for "Data-Driven Documents"and is an open-source JavaScript framework that allows the “efficient manipulation of documents based on data” [4]. This means that with D3.js it is possible to createDocument Object Model (DOM)elements to represent data in interactive ways, using only current Web standards like HTML, SVG, andCascading Style Sheet (CSS)[4]. This is extremely powerful because it also allows the manipulation of these elements in an easy and usual way. The usage of D3.js has been growing a lot, so there is a lot of feedback and help forums maintained by the Internet community. During this project, this framework will be used to produce SVG’s with various types of interactive charts.
2.4.2.2 CSS-Grid
CSS-Grid is a new and powerful set ofCSSrules that allows developers to layout any page element inside a grid. This is extremely useful and practical, finally allowing developers to think in a way that is closer to that of the designers, opening the possibility to build more interesting layouts and in a more timely fashion. Developers can now create a grid layout, including sub-grids, and then place the elements inside the desired cells or even leave some of them empty. [8,10] These rules were also created with various screen sizes or even resizable screens in mind, so adaptations and rearrangements of the layout are totally supported. This allows the developer to think and build two different grid layouts, one for desktop and one for mobile, and the correct one will be applied in the correct scenario. It is also very important to notice that this technology is already present in a large amount of browsers, including in all major ones.
2.4.2.3 Django
“Django is a high-level Python Web framework” [12] that focuses on fast and secure web development. With this framework, it is possible to use the powerful data analysis features of python, while building web platforms. This is also a really easy to understand language, making code readable and fast to produce. [35] This framework comes with a lot of built-in features, like authentication or session frameworks, making it really easy to implement them on web platforms. However Django doesn’t support real-timeWeb-App, so there is the need to use it in conjunction with other Python engines, such as Jinja2. [27,
35]. Looking directly at this work, it is relevant to note that Django is based on the Model-View-Controller, [11] thus it separates back and front end. Not only that but “Django
takes this separation one step further by separating code from the static media—images, files,CSSand JavaScript”, [11] making for a perfect integration with D3.js creating the right conditions to manipulate and present data to clinicians in an intuitive, fast and beautiful way.
C
h
a
p
t
e
r
3
P r e D e v e l o p m e n t
To start this project it is first necessary to understand all the features that we need to develop to succeed on our project. In Chapter2we could already understand what are the main aspects that compose a goodCISand what should be avoided. These concepts were already a great basis for us to drive the design phase upon. However, withKinetikos
being a company that has direct contact with clinicians, we had access to an even clearer and more relevant view of what should be present in our final design. In the next sections we will present the constraints and features of this project, as well as explain all the main concepts that are necessary to understand the development of this solution. By the end of the Chapter we will also go through the design phase, with the presentation of some mockups and drafts.
3.1
Features and Constraints
The goal of this project is, first of all, to create a report area inside of aCISthat presents clinicians with meaningful information about their patients in a intuitive and tailored way. This goal is then composed of some features and requests that are listed bellow, and came fromKinetikos expertise and feedback, as well as the research presented in Chapter
2:
• Customizable - The report area must have the ability to be tailored by each clinician, in order to display only the information that they want and in the way that they feel most comfortable with.
• Quick and Responsive - The report area, being full of data and plots, is an area that tends to be slow to load. This, however, should not be the case, given the timely fashion at which clinicians have to work. So, in this project, we should have in mind
C H A P T E R 3 . P R E D E V E L O P M E N T
that the code and the loading of all elements needs to be efficient. The same applies to all interactions inside the page, that should be quick to respond.
• Intuitive - The report needs to be intuitive and easy to understand and navigate. The learning curve should be low so that our solution is ready to be used just after a few moments of exploration by the clinician.
• Interactive - When displaying data, like plots, it’s important that the users can interact with it. This interactions could range from simply zooming and dragging, to viewing only sub selections of what’s being displayed.
• Mobile Friendly - Some clinicians voiced their frustration when trying to use their phones to navigate the systems that they use during work. So, in this project, we’ll need to prepare the report to be used on mobile, to allow the users to quickly check the information about their patients on the go.
Now that we have an even better understanding of all the objectives of this project, we can present the phases that occurred before the beginning of the report’s development.
3.2
Template Layout
One of the main ideas behind this project was to make the report page tailored for the clinician. This is important because we saw, in Subsection2.2.2, that aCISmust respect the clinician’s workflow. By being able to customize the way the report page looks and which information it presents, we think the user will be able to reflect his way of working into the report itself, thereby fulfilling this concern. In order to achieve this type of user customization, we decided to implement the concept of templates. In this case, a tem-plate will be a different tab in the report page, that will hold different types of data and is completely independent from the other tabs. The way the information is presented in these templates, as we will see in next Section,3.3, is through small cards. But, by now, the most important aspect is that each user can create and edit their own templates. In other words, clinicians will be able to create different tabs with only the data that they want to view and organize them in the way they feel more logical.
Templates are organized by the type of exam that they were created for, but they are not limited to only one type. In this manner one template can be used for multiple types of exams. Templates can then be created and edited at any time, and these changes will be stored into the database. Additionally, it is possible to have templates that are of gen-eral access and so, available to all users. These will be created byKinetikos and are not
editable by the users. A similar functionality will be given to the health institutions at which the clinicians work. They too will be able to create general access templates for all their clinicians, that can be edited only by accounts with the right clearance.
3 . 3 . I N F O R M AT I V E C A R D S
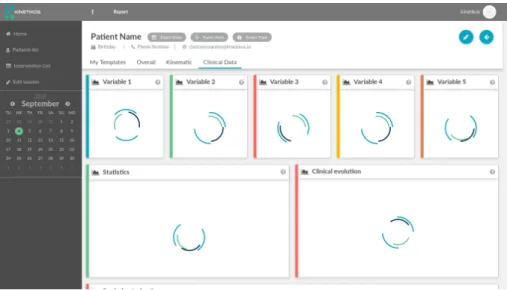
We think this will be a very successful way of enabling a more tailored and meaning-ful report, that doesn’t impose a specific workflow or methodology, but radder is open to user customization. In the Figure3.1you can see an example of a template.
Regarding the technologies used to create the templates’ layout, we decided to use the new CSS-Grid standards, discussed in the Subsection 2.4.2.2. Hence, templates will be composed of a grid with a defined number of columns and an undefined number of rows, though they all have the same dimensions. The amount of rows present in a given template is thereby defined by the number of cards present on it.
Figure 3.1: Example of one report template created during this project.
3.3
Informative Cards
To support the idea of templates, that we just presented, we needed to find a way to individualize every type of clinical data. We intended to individualize the data, not only to give clinicians the ability to add or remove information to and from the report, but also, to make it more intuitive and simple to read, which was also a concern brought up in the Section2.2.
The solution found was the creation of cards, with different purposes and data. These cards were then divided into types, that represent a singular way of displaying informa-tion, since the data can be represented in metrics or single numeric values, scores and percentages, plots, videos plain text and so many other ways. As an example we can go back to Figure3.1, where we find a first row made up of similar cards with a circular way of representing percentages. This first row is made of cards which are all of the same type, but that are completely independent from each other, meaning that they can be added or removed from the template individually. All the other cards in the figure are independent from each other, and are also of different types, since they don’t share the same look.
C H A P T E R 3 . P R E D E V E L O P M E N T
After understanding this way of showing information, it’s really easy to come to the conclusion that the templates introduced in Section3.2are nothing more than an ordered collection of cards. This order, as we’ll see in Section 4.3, is also subjected to user cus-tomization. When editing a template, users will be allowed to choose all the cards that they want from a list of all available cards, and then drag and drop them around the canvas of the template to reorganize them.
We said before, in Section2.2.2, that aCISshould be able to be quickly updated, hence that was another big concern that we had during the pre-development phase. To make our report quick and easy to fix or update, this card interface was of major importance. This is because we only need to worry about creating or changing one card and not the whole report. Building the report in this way, revealed itself as a great bet, enabling a faster and more seamless way to develop the report page.
3.4
Design
In this section we’ll discuss the design aspects of the current project, from the initial drafts to the end result.
3.4.1 Report
Let’s begin by addressing the outer part of the report, the header and the left side bar, both found on Figure3.1. In the header we will find all the metadata about the patient and the current exam, as well as some action buttons and the templates available for this type of exam in the form of tabs. The Figure bellow presents an header section explaining where each type of information goes.
Figure 3.2: Detailed Report Header.
We can observe that this is a really rich and dense area, filled with useful information. By giving it a quick look, the clinician can find all the major information about the patient and the exam that he did with him. Regarding the exam information we have the date of the exam, theExam Type, that can be Admission, Follow Up or Discharge and the Exam Area that is the area of the body where the examination took place. This layout, however,
was an iteration from another draft made for this project, which, as found in Figure3.3, had way less functionality and information, leaving a lot of unused space. This lack of functionality and wasted space were the reasons why this design got rejected.
3 . 4 . D E S I G N
Figure 3.3: Detailed Report Header.
There is also a different way to present the header, that we’ll call collapsed. This collapsed view occurs automatically, after the user scrolls beyond a certain limit, and has less information, which allows us to largely reduce its size, while still keeping the tabs and the exam information at hand. An example of this view is shown in Figure3.4.
Figure 3.4: Collapsed Report Header.
Regarding the left side bar, found of Figures3.1 and3.5, clinicians will find there some quick links. This area is a good place for the type of CDS triggered by user, as presented in Section 2.2. This is also an area prone to updates, in the sense that these links can be easily exchanged as functionalities are added to the platform. One of the ways to integrateCDSin this bar came in the for of an interactive calendar, from which clinicians can navigate through their appointments, Figure3.5. This area is also collapsi-ble, disappearing completely, so that the informative cards fill the entire width of the screen.
Figure 3.5: Example of the side bar with a calendar.
3.4.2 Cards
Looking now at the cards that compose the templates that we talked about previously, we can see that despite all the differences between them, there are some aspects that remain
C H A P T E R 3 . P R E D E V E L O P M E N T
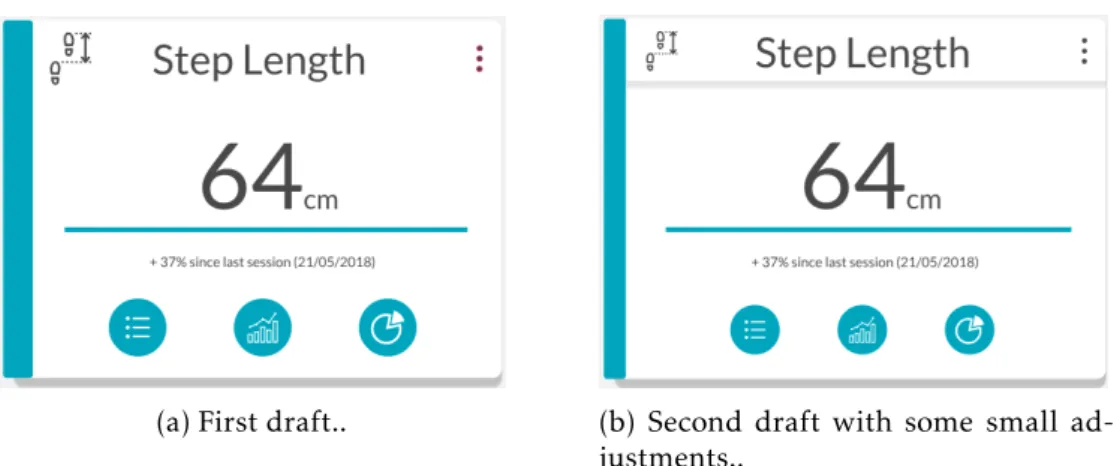
the same in every card. By maintaining a consistent design language, that keeps cards looking similar to each other, we aim to make everything more predictable and intuitive. In Figure3.6to the right, we can see one of the draftings that were the base from which we created the cards that are used in the report. In this card we can observe some elements that became common on all cards, the first one being the header. In this part we have an icon representative of the information presented and the title of the card. We have also a three dots menu that by the end of this project was replaced with a button to open a pop-up with some help information about the card itself.
Next we can see the body of the card. Is inside of here that the data and useful infor-mation is found and it can be presented in really diverse ways. However, in all cards, when there is the possibility to take some action, like zoom in on plots, or show more information, these actions are presented as blue rounded buttons on the lower part of the card.
(a) First draft.. (b) Second draft with some small ad-justments..
Figure 3.6: Initial draftings of one of the Card Types.
In the next Figures we can see some other drafts of the template compared with what ended up being implemented:
3 . 4 . D E S I G N
(a) First draft of the Report.. (b) Final draft of the Report..
(c) Report after implementation..
Figure 3.7: Report drafts (on the top) and an example of a report by the end of this project (on the bottom).
3.4.3 Mobile
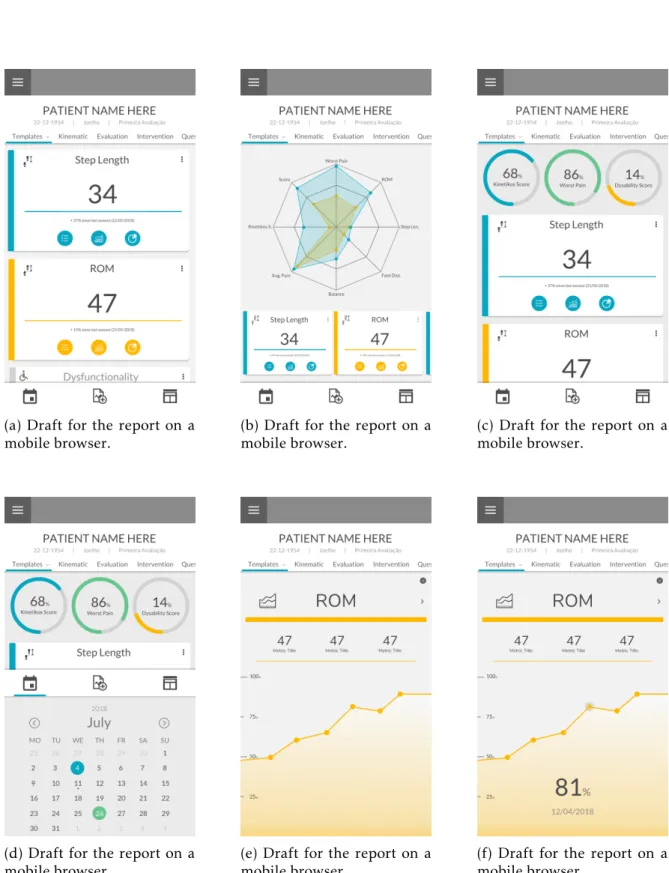
Lastly, we did some design concepts for the way the report should look on mobile phones. They are all visible in the next Figure:
Despite some of the concepts being really visually interesting, like the full screen plot in the Figures3.8e and3.8f, we ended up following the first draft, in Figure3.8a, since this one respected the design language used in the rest of the report, namely in the non-mobile version. This decision was a step in the direction of intuitiveness and simplicity, over beautiful design, like discussed in Section2.2.2.
C H A P T E R 3 . P R E D E V E L O P M E N T
(a) Draft for the report on a mobile browser.
(b) Draft for the report on a mobile browser.
(c) Draft for the report on a mobile browser.
(d) Draft for the report on a mobile browser.
(e) Draft for the report on a mobile browser.
(f) Draft for the report on a mobile browser.
Figure 3.8: Set of drafts for the report as viewed on a mobile browser.
C
h
a
p
t
e
r
4
D e v e l o p m e n t
Starting the development phase it became a priority to start building the database struc-ture. Later, some essential BackEnd functions were built, to enable the creation and management of the report templates. After this two phases we started to build the func-tions for each specific card and card type. At the same time the connection with the FrontEnd started to be created. Lastly, we built all the FrontEnd structure. These phases will be discussed in the next sections.
4.1
Database Design
Regarding the database structure, tables and respective relationships we’ll start by pre-senting all the tables and their purpose. This explanations should be seen with attention to Figure4.1, that represents the database that was created for this project.
4.1.1 Template
This table will represent the templates. It will hold the IDs of all the cards that compose the template, in the form of a list in the order that they should appear in the FrontEnd. This list could have been done using a cross reference table, like we did in all the other many to many relations throughout this project, however, doing it in this way presented a lot of advantages which led us to decide to use this strategy. They were: reducing the complexity of setting the order in which the cards should appear in a template, since the order is now just the order in which they appear in the list and not an integer value set in the relations table; enabled a quick and intuitive edition of the cards present in a template (mainly to easily update the templates created byKinetikos itself, like discussed
in Section 3.2); making saving the editions made by the user to the templates, a really simple process, given the fact that the only thing that needs to be done in the FrontEnd,
C H A P T E R 4 . D E V E L O P M E N T
is to send a JSON array of card id’s to the BackEnd that stores it as is.
In this table we can also find a name that is there just to make the database more readable and is never used on the report itself. Lastly we can see three more values,inst_id, user_id
andtype. These are responsible to define who created the template. If it was a clinician
the user and the institution ID will be filed and thetype set to 1. In the case that it was
an institution, theuser_id will be set to Null and the inst_id will be filled. The type is
then set to 2. Finally, if the template is of general access, in which case it was created by
Kinetikos, neither the user nor the institution IDs are filled and the type is set to 3.
4.1.2 Exam_id_Template
In this project, like seen on Section 3.2, templates are connected to exam types. This means that an exam type can have many templates and that a template can be used in many exam types. Given this, we need a cross reference table, which is the exam_id_template table. In this table, besides the IDs of the exam type and the template, we have an integer that represents the order in which this specific template tab should appear in the header for the reports of this exam type. This is the opposite strategy to the one taken for the cards order stored in the template table. This happened because there was no need to edit this order directly on the database.
4.1.3 Template_text
This is a very common type of table throughout this entire project. These tables are responsible to manage the text values of their parent entries. They will have the values in all available languages in the platform, by relating each entry with the corresponding language ID. For the case of templates we need a title, that will appear in the tabs, and a description that could be used in some help menu in the future.
4.1.4 Card
Within this table we will organize all the information about the cards that compose the templates. The Cards table will have a column for the card type ID, that is a Foreign Key; an icon that is a text field representing a<i> tag in HTML, to use on the card header;
a name for better database readability; and, lastly, a color, that will style the card itself and, if necessary, the elements inside of it. The color can be in whicheverCSSreadable format, includingCSSvariables, but naturally, in this last case, the variable value needs to be declared in the stylesheet.
4.1.5 Card_text
Has we stated before in the Subsection 4.1.3, this is a very common type of table. In the current case, this will store the card title and description in all languages present
4 . 1 . DATA BA S E D E S I G N
in the platform. The title value is the one presented in the header of the card, and the description is used to explain what the card does when the user is choosing new cards for a template or even as an help text when browsing the report.
4.1.6 Card_type
Card types agglomerate all cards that have a similar way of displaying information. This means, looking back at the example given in Section3.3, that all cards in the fist row of the Figure3.1are of the same type, because they all carry information in the same way. Card types, then, store a name and a description used for database readability, and the dimensions that a card of this type should occupy in the template canvas. The dimensions are represented by two integer values that set the number of rows and columns of the card. The ID of this card types is very important, for it is used on the FrontEnd to render cards in the right way.
4.1.7 Card_type_text
Like the ones before, this table will store the text values associated with card types in all available languages. These values are a title and a description, that the user will see when on the menu for choosing new cards.
4.1.8 Exam_id_card
Like the table we discussed in4.1.2, the exam_id_card will connect cards to exam_types. In this manner, we can know what cards are available for a given exam type. This will be useful when presenting the user with card choices for him to populate a template. 4.1.9 Option and Option_text
These tables are not in use in the current state of the work, but exist to enable future improvement. The idea behind these is to represent options in a three dot menu that could be situated on the right upper corner of a card. The options would have an icon, like the ones presented in4.1.4and a link, to be triggered on click. As for the Option_text, it would store the text of the option displayed on the menu.
4.1.10 Action and Action_text
The action table is another one that ended up not being used in the current project. They should represent the blue button actions that populate the inferior part of the cards, but, during the development we came to the conclusion that it didn’t made sense to store the actions in this way. This table should store a link value, however, there are a lot more types of actions, like enabling zoom, showing labels, or opening another card in full-screen. Because of this, we understood that this table wasn’t versatile enough and that it was better to create the actions based on thecard_id or the card_type_id. Finding a
C H A P T E R 4 . D E V E L O P M E N T
better approach to this problem could be a focus point for future work. In the Action_text we could store a title that appears when the user hovers the mouse on the action button.
4.1.11 Link and Link_text
Like the previous Option and Action tables, the Link table did not get any use in the final work of this project. The initial intention was for this table to store a link that would be launched when clinicians clicked the card itself, however, not only was this feature not found to be useful for almost all cards, but also, since links are dynamic, it made way more sense to call the links using Django URLs. The Link_text would store a title that became visible when the user hovered the mouse on the card itself.
Figure 4.1: Data model used for the current project. 28
4 . 2 . T E M P L AT E C O N S T R U C T I O N
4.2
Template Construction
In the current section we’ll cover the construction process of a template when a user requests it. This process, as expected, starts with the URL that leads us to a patient’s exam report page. This URL can be in one of two formats,.../report/{exam_id} or .../re-port/{exam_id}/{template_id}. In the first case, when no template ID is given, we’ll look
into the database and get the first template that the user has access to and that is available for the current exam type. The search is firstly made for user created templates, then in-stitution created templates, and only then will we search for the general access ones. The user is then redirected to the found template with a link constructed in the second format. In the case that the template_id was given on the URL we need to check if the user has access to that specific template and if it is available for the current exam type. If one of these two conditions fails, an exception is raised and aPermission Denied page is shown.
After having the ID of the template we want to present, we need the list of cards that compose this template. For each one of the cards we also need to get its metadata, namely the title, icon, color and grid dimensions.
The next step is to collect all data related to the tabs shown in the header of the re-port, like their text and link. These tabs will be arranged in accordance to the correct order, just like we discussed in4.1.2. We also need some variables to better control the look of the tabs and emphasize which is the current one being displayed.
Lastly, the only thing left to do is getting all the remaining metadata about the patient and the exam itself, to present in the report header. All of these data is sent to the FrontEnd and we use Jinja2, like stated in the Subsection2.4.2.3, to make the variables available in the HTML and JavaScript.
4.2.1 Asynchronous Calls
At this point we know how the template and cards metadata is collected and gets sent to the FrontEnd. Is time now to understand how does the clinical data that needs to be displayed on the card body gets to the FrontEnd. This is made via Ajax posts, that per-form asynchronous calls to the BackEnd. This is a very important notion in this project, because of the quick response times that we need to achieve,2.2.2. The clinical data could be fetch while loading the template, alongside all the metadata, however, this would slow down the loading of the page. This happens because all the calculations related to the kinematic data and metrics had to be made before rendering the entire page, creating a really substantial time gap between the user clicking the link that leads him to the report and its rendering. Using one Ajax post per card to get its clinical data, on the
C H A P T E R 4 . D E V E L O P M E N T
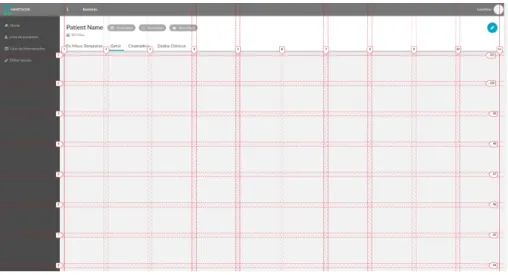
other end, enables us to completely render the page before any calculation is made. This will achieve a better user experience, by constructing the new page in phases, starting to populate the template as soon as the user launches the report. The first construction phase is responsible to build the skeleton of the report, without any data inside of the cards, as found in Figure4.2. During the second phase the cards’ body will be rendered. This will happen after the response of each Ajax post, which means that cards will get populated individually and as soon as possible, rather than only after all the calculations are done for every other card.
Making this process work in this fashion, is a more intuitive way to load the report, than to load it all at once, because the user understands at which state he’s in, since there is not an idle state, where no feedback is given. That idle time is prone to errors, because it could also led the user to perform multiple clicks on the report link possibly generating unexpected behaviors. In this way, even if the user can’t use the report immediately, he can see it getting populated and use the information as it gets rendered on the FrontEnd. It is interesting to note that in the begging of this project we made this process in three phases, rather than two just presented. The first phase consisted of the loading of the metadata about the patient and the exam and the rendering of the report header and side bar. Then the metadata about each card was fetch with an Ajax post, and only after getting the response was the data of the card fetch, with another Ajax post. This strategy proved to be flawed, since this would generate the cards inside of the template, also in an asynchronous way. That meant that for the cards to remain in the correct order inside of the template, we had to move cards around, which led to a terrible user experience.
Figure 4.2: Template while waiting for the response of the asynchronous Ajax posts made to get the clinical data.