Corrective phosphate application as a practice for reducing oxidative
stress and increasing productivity in sugarcane
1Fosfatagem como prática para redução do estresse oxidativo e ganho de
produtividade na cana-de-açúcar
Ariane Márcia de Sousa Silva2, Emídio Cantídio Almeida de Oliveira3*, Lilia Gomes Willadino4, Fernando José
Freire3 and Alexandre Tavares da Rocha5
ABSTRACT - Corrective phosphate application increases the levels of phosphorus (P) in the surface layer of the soil, stimulates plant root growth and increases the volume of soil exploited for water and nutrient uptake, which may reduce abiotic oxidative stress in sugarcane. The aim of this study was to evaluate the productivity and the response of the antioxidant enzyme system in sugarcane when grown in soil that received corrective phosphate application, using doses and sources of P of varying solubility. The experiment was conducted under field conditions in the southern Forest Zone of the State of Pernambuco, Brazil. The treatments were arranged in a randomised block design, in a (4 × 3) +1 factorial scheme with four replications. The factors consisted of a control (with no phosphate application) and the doses (50, 100, 200 and 300 kg P2O5 ha-1 ) and sources (reactive
natural phosphate, triple superphosphate and sugarcane press mud) of P applied during the pre-planting stage of the plant cane cycle. The P content of the leaf tissue was considered adequate, and was not influenced by the phosphate application. Phosphate application at an estimated dose of 150 kg P2O5ha-1 reduced antioxidant enzyme activity and increased shoot dry matter (SDM)
by 25.0% and stalk productivity by 8.5%. Superoxide dismutase (SOD) showed the highest positive correlation coefficient with the other antioxidant enzymes, and a negative correlation with SDM, and can be used to evaluate abiotic stress that promotes reductions in sugarcane productivity.
Key words:Saccharum spp.. Phosphorous. Antioxidant enzymes. Mineral nutrition.
RESUMO - A fosfatagem aumenta os teores de fósforo (P) na camada superficial do solo, estimula o crescimento das raízes das plantas e aumenta o volume de solo explorado para absorção de água e nutrientes, o que pode reduzir o estresse oxidativo abiótico na cana-de-açúcar. O objetivo deste trabalho foi avaliar a produtividade e a resposta do sistema enzimático antioxidante da cana-de-açúcar quando cultivada em solo que recebeu a fosfatagem corretiva, utilizando doses e fontes de P com solubilidade variada. O experimento foi conduzido em condições de campo na Zona da Mata Sul do Estado de Pernambuco, Brasil. Os tratamentos foram dispostos no delineamento de blocos casualizado, em esquema fatorial (4 × 3) +1, com quatro repetições. Os fatores foram constituídos do controle (sem fosfatagem), pelas doses (50, 100, 200 e 300 kg ha-1 de P
2O5) e fontes (fosfato
natural reativo, superfosfato triplo e torta de filtro) de P aplicadas em área total, no pré-plantio do ciclo de cana planta. O teor de P nos tecidos da folha foi considerado adequado e não foi influenciado pela prática da fosfatagem. A fosfatagem com a dose estimada de 150 kg ha-1 de P
2O5 reduziu a atividade das enzimas antioxidantes e aumentou em 25,0% a biomassa seca da
parte aérea (MSPA) e em 8,5% a produtividade de colmos. A superóxido dismutase (SOD) apresentou o maior coeficiente de correlação positivo com as demais enzimas antioxidantes e negativo com a MSPA, podendo ser utilizada para avaliar estresse abiótico que promoveu a redução na produtividade na cana-de-açúcar.
Palavras-chave:Saccharum spp.. Fósforo. Enzimas antioxidativas. Nutrição Mineral.
DOI: 10.5935/1806-6690.20190022 *Author for correspondence
Received for publication 09/09/2017; approved on 31/05/2018
1Parte da Dissertação do primeiro autor, apresentado ao Programa de Pós-Graduação em Ciência do Solo, Universidade Federal Rural de Pernambuco/UFRPE 2Programa de Pós-Graduação em Ciência do Solo, Universidade Federal Rural de Pernambuco/UFRPE, Recife-PE, Brasil, [email protected]
(ORCID ID 0000-0002-9461-3697)
3Departamento de Agronomia, Universidade Federal Rural de Pernambuco/UFRPE, Recife-PE, Brasil, [email protected] (ORCID ID
0000-0002-9283-7910), [email protected] (ORCID ID 0000-0002-3264-712X)
4Departamento de Biologia, Universidade Federal Rural de Pernambuco/UFRPE, Recife-PE, Brasil, [email protected] (ORCID ID
0000-0003-0491-4443)
5Unidade Acadêmica de Garanhuns, Universidade Federal Rural de Pernambuco/UFRPE, Recife-PE, Brasil, [email protected] (ORCID
INTRODUCTION
Plants under natural conditions may often be subjected to multiple stress, such as water deficit, salinity, high temperatures, brightness and a deficiency or excess of nutrients. Plant exposure to abiotic stress can lead to disturbances in physiological processes caused by the extreme generation of reactive oxygen species (ROS)
(LAWLOR, 2013; MITTLERet al., 2011). In plants under
stress, the production and accumulation of ROS, such as the
superoxide radicals (O2•-), hydrogen peroxide (H
2O2) and
the hydroxyl radical (OH•-), modifies organic molecules
and results in damage to cells and tissue, leading to cell
death (GUNESet al., 2007).
The toxic effect promoted by ROS in plant cells is suppressed or reduced by the defence mechanism that acts by activating the antioxidant enzyme system
(WILLADINOet al., 2011), which includes activation of
the enzymes superoxide dismutase (SOD), responsible for converting the superoxide radical into hydrogen peroxide; ascorbate peroxidase (APX), which eliminates hydrogen peroxide using ascorbic acid as a reducing agent; and catalase (CAT), which converts two molecules of hydrogen peroxide into water and molecular oxygen (NOCTOR; FOYER, 1998).
Among the types of abiotic stress that promote the production of ROS in plants, nutrient deficiency can affect primary metabolism and reduce cell multiplication during plant growth, leading to increases in ROS production.
Among the nutrients, Yao et al. (2011), working with
canola genotypes, found that higher concentrations of phosphorus (P) in the tissue promoted the formation of less ROS, and that P deficiency resulted in more of the toxic oxygen species being formed.
The low availability of P commonly seen in the soils of regions of tropical climate and areas of sugarcane cultivation in Brazil, can result in a reduction of up to 50% in
the growth and productivity of the plantations (VALEet al.,
2011). Sugarcane is a semi-perennial crop and remains in the field for an average of five consecutive production cycles. Even so, P is only supplied to sugarcane when planting, using a dose five times greater than the demand of the plant,
and concentrated in the row of fertiliser (OLIVEIRAet al.,
2016; SIMÕES NETOet al., 2015).
Localised phosphate fertilisation limits root growth in the region where the fertiliser is applied, which reduces the uptake of water and nutrients, and may increase abiotic stress during periods of greater water restriction. In order to increase the area of soil exploited by the roots, the practice of corrective phosphate application over the whole area during pre-planting of the plant cane makes it possible to correct the P content of the entire surface layer of the soil.
An increase in P content on the soil surface
stimulates root growth (ARRUDA et al., 2016) and
increases the volume of soil exploited for water and nutrient uptake, which may reduce abiotic stress and ROS production in the sugarcane. The aim of this research therefore, was to evaluate phosphate nutrition and oxidative stress in sugarcane leaves, as well as the production of shoot dry weight and plant cane productivity when grown in soil that received corrective phosphate application during pre-planting, using doses and sources of P of varying solubility.
MATERIAL AND METHODS
Experimental area
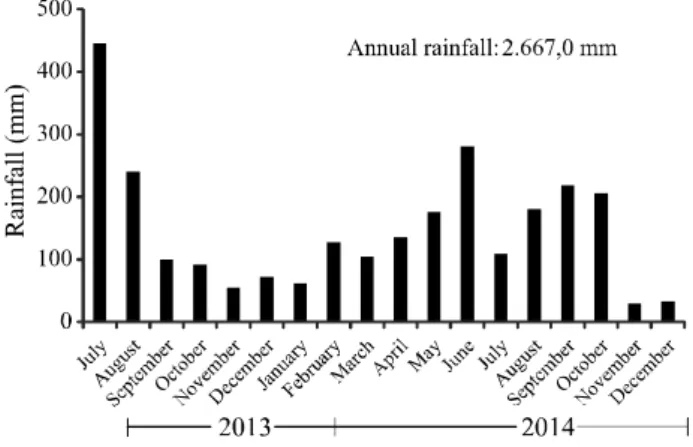
The research was conducted under field conditions from July 2013 to November 2014; the accumulated rainfall during this period was 2,667.0 mm (Figure 1). The experiment was set up in the agricultural area of Usina Cucaú, located in the district of Ribeirão, in the southern Forest Zone of the State of Pernambuco, Brazil (08°30’11.2” S and 35°17’32.7” W). According to the Köppen system, the dominant climate in the region is Tropical As’, with a rainy winter and dry summer. The soil of the experimental area was classified as Dystrophic Red-Yellow Latosol, with a loamy-clay texture (SANTOS
et al., 2013) and a predominance of kaolinite among the
clay minerals.
Figure 1 - Rainfall during the period of the experiment (July 2013 to December 2014), Ribeirão, Pernambuco, Brazil
A chemical characterisation of the soil was carried out on samples collected in the 0 to 0.2 m
layer, and gave the following results: pH (H2O) = 5.20;
OM = 30.26 g kg-1; P (Mehlich-1) = 2.0 mg dm-3; K+
(Mehlich-1) = 0.14 cmolc dm-3; Ca2+ = 3.30 cmol
Mg2+ = 0.30 cmol c dm
-3; sum of bases (SB) = 3.78 cmol
c dm -3;
Al3+ = 0.0 cmol c dm
-3; H+Al = 4.90 cmol
c dm
-3; CEC
potential
= 8.68 cmolc dm-3 and V% = 43.54%. In the physical
characterisation, 396, 174 and 430 g kg-1 clay, silt and
sand were determined respectively.
Before applying the treatments, soil acidity was
corrected by adding 2.0 Mg ha-1 limestone (CaO: 40%,
MgO: 9.96% and RPTN: 66.6%) based on increasing the base saturation to 60% in the surface layer of the soil
(RAIJet al., 1996). Then, 1.0 Mg ha-1 mineral gypsum
(CaO: 45%) was applied, calculated to raise the calcium saturation in the subsurface layer of the soil to 50% (RAIJ
et al., 1996). After application and incorporation of the
soil correctives, the treatments were applied.
The treatments were distributed in randomised blocks, using a (4 x 3) + 1 factorial scheme, with four replications, to evaluate four doses (50, 100, 200 and
300 kg P2O5 ha-1) and three sources of P of varying water
solubility: Triple Superphosphate (TS - 44% total P2O5
and 40% water-soluble P2O5); Gafsa Reactive Natural
Phosphate (RNP - 29% total P2O5 and 8.7% P2O5 soluble
in citric acid) and Sugarcane Press Mud (PM: 2.9% total
P2O5 and 60% moisture), and the control treatment without
the application of phosphate. Characterisation of the sugarcane press mud determined values of 8.0, 12.7, 7.1 and
186.0 g kg-1 N, P, K and Organic Matter in the dry matter
respectively. The additional amounts of N and K applied with the PM were adjusted for the remaining treatments using ammonium nitrate and potassium chloride.
The doses and sources of P were broadcast over the surface of the soil and then incorporated by harrow to a depth of 0.15 m. The experimental plots corresponded to 6 rows of sugarcane, 20 m in length, spaced 1.0 m apart
(120 m2). The four central rows of each plot, with a length
of 18 m, were considered the working area.
After application of the treatments, planting furrows were opened to a depth of 0.3 m and fertilisation
carried out using 25 kg ha-1 N and 120 kg P
2O5 ha -1 in
the form of monoammonium phosphate. Ninety days
after planting (DAP), 35 kg N ha-1 and 120 kg K
2O ha -1
were applied as cover fertiliser, using ammonium sulphate and potassium chloride respectively as the source. The mineral fertilisation at planting and the cover fertilisation were carried out for each treatment, and were based on
the recommendations of Raijet al. (1996). The RB867515
variety of sugarcane was used, chosen due to having the greatest cultivated area in Brazil.
Nutritional evaluation of the plants in relation to phosphorus
The P content was determined in the diagnostic leaf (leaf +1), identified as the first leaf showing a visible
collar (CAIONEet al., 2015). The leaves were randomly
collected 120 and 210 days after planting (DAP) from the working area of each plot, with 10 fully developed leaves being sampled. The central rib, base and tips of each leaf sample were discarded, with only approximately 20 to 25 cm of the medial part of the leaf blades remaining
(CAIONEet al., 2015); these were then packed into paper
bags.
In the laboratory the samples were washed with distilled water, packed into paper bags and dried in a forced circulation oven at 65 ºC to constant weight. After drying, the samples were ground in a Wiley mill for later analysis of the P content, which was extracted by nitric-perchloric digestion (ASSOCIATION OF OFFICIAL ANALYTICAL CHEMISTS, 2005) and determined by colorimetry at a wavelength of 725 nm using ascorbic acid reaction (DEFELIPO; RIBEIRO, 1996).
Determination of the enzyme activity of the antioxidant complex
At the same time that the leaves were collected for the nutritional evaluation of P, three samples of leaf +1 were also collected to evaluate the enzyme activity of the antioxidant complex. Healthy looking leaves were selected, and the central veins, bases and tips discarded, leaving only the medial area and the leaf blade.
The plant material from the leaf blade was identified, wrapped in aluminium foil and packed in liquid nitrogen while still in the field. In the laboratory, enzyme activity was determined in triplicate using 0.1 g of cold-homogenised plant material in a 100 mM potassium phosphate buffer (pH 7.5) and polyvinylpyrrolidone, centrifuged at 10,000 g for 15 min at 4 °C. The supernatant was used to prepare the extract to determine the activity of the antioxidant enzymes, superoxide dismutase (SOD), catalase (CAT) and ascorbate peroxidase (APX), following the analytical procedures described in Giannopolitis and Ries (1977), Havir and Mchale (1987) and Nakano and Asada (1981) respectively.
Production of plant biomass
At 518 DAP, at the end of the crop development cycle, shoot dry-matter production (SDM) in the plant cane was determined. For this purpose, samples of the shoots were collected, and a count taken of the plants contained in a 20-metre length of the central part of the second planting row in each experimental plot. Still in the field, the dry-leaf, green-leaf, tip and stalk fresh matter were obtained separately by weighing on an electronic balance with an accuracy of 0.02 kg, and subsamples were removed.
precision) and oven dried at 65 °C to constant weight. They were then weighed again to determine the moisture in the
material. The dry matter per plant (g plant-1) and the shoot
dry matter production (Mg ha-1) were calculated from the
number of plants per metre and the dry matter of each aerial compartment.
Productivity and technological attributes
After evaluating shoot dry-matter production, the straw was removed from the sugarcane by burning, to enable the stalks to be cut. After cutting, the stalks of the plants contained in the working area of the experimental
plots (72 m2) were separated from any remaining leaves
and weighed using a PR30-3000 digital dynamometer, with a precision of 5 kg, and the weights corrected to determine productivity in tonnes of stalks per hectare (TSH).
After weighing, 10 stalks were randomly chosen and sent to the laboratory to determine the percentage of sucrose in the stalks (PS). Sugar production per hectare (TPH) was calculated from the equation TPH = TSH x
PS/100, as per Lima Netoet al. (2013).
Statistical analysis
The data were submitted to the test for normality and homoscedasticity. When both normal and homocedastic, the data were submitted to analysis of variance (ANOVA) at a significance level of 95% by F-test, using a randomised block design in a (4 x 3) + 1 factorial arrangement, separately for each period.
When there was a significant difference by ANOVA, the data were submitted to orthogonal contrast analysis between the control treatment and the treatments with phosphate application. When there was a difference by contrast, the mean values of the qualitative data
(sources) were compared by Tukey’s test (p≤0.05).
Polynomial models were adjusted for the quantitative data (P dose).
As criterion for choosing the mathematical models,
those with the highest coefficient of determination (R2),
and significance of the equation parameters to 5% probability by t-test were selected. The variables SOD, CAT, APX, leaf +1 phosphorus content, SDM and TSH were correlated by the Pearson linear correlation index. The statistical analysis was carried out using the SAS statistical software (SAS INSTITUTE, 2011).
RESULTS AND DISCUSSION
Phosphorus content of the leaf and plant dry matter
The P content in the tissue of the sugarcane leaf shows no difference between the sources or doses of P
used in the corrective phosphate application during pre-planting (Table 1). The P content of the leaves varied
between 3.3 and 4.1 g kg-1 for the two periods under
evaluation, and can be considered adequate for the cycle of the plant cane, since they were superior to those
obtained by Santos et al. (2013), who determined as
optimal a content of from 2.5 to 2.8 g kg-1.
This result demonstrates that the plants did not present a P deficiency and that the localised phosphate mineral fertilisation carried out at the time of planting,
when 52 kg ha-1 P were added for all treatments, including
the control, met the P demand of this variety, estimated at
50 kg ha-1 P for the plant cane cycle (OLIVEIRAet al.,
2016).
Despite not promoting increases in the P content
of the leaves, the dry matter produced per plant (g plant-1)
responded positively to phosphate application, but with no difference between the sources of P (Table 1). The maximum estimated dry matter production was 865.72 g
plant-1 with an increase of 18.6% at the estimated dose
of 153 kg P2O5 ha-1 (Figure 2A). Lisboa et al. (2016)
also found no difference in the P content of the plant cane leaf after corrective phosphate application during pre-planting with two sources of P, and found a positive response in shoot biomass production with the addition
of 113 kg P2O5 ha-1 applied over the whole area, even
with the addition of 52 kg ha-1 P applied as fertiliser when
planting.
Dry matter production and plant cane productivity
Corrective phosphate application during
pre-planting increased SDM production (Mg ha-1), stalk
productivity (TSH) and sugar yield (TPH) in the plant cane (Table 1). SDM production showed a difference for the sources under test, obtaining the highest production from
the use of TS, with gains of 16.0 Mg ha-1 compared to the
RNP and PM sources. The sources showed no difference for stalk or sugar productivity, however corrective phosphate application afforded increases of 7.1 and 11.0% in TSH and TPH respectively (Table 1).
There was a difference in SDM and TSH production for the doses of P; a quadratic polynomial adjustment was obtained, with maximum estimated values of 79 and 126
Mg ha-1 respectively, at doses of 155 and 251 kg P
2O5 ha -1
(Figure 2 B; C). When compared to the plants that received P fertilisation only at planting, there were estimated
gains of up to 16 Mg ha-1 in total SDM production and
10 Mg ha-1 in stalk productivity (Figure 2 B; C), with
no change in plant cane nutrition (Table 1).
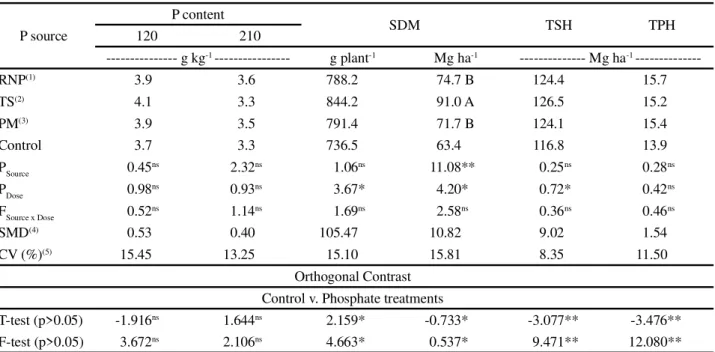
Table 1 - Leaf +1 phosphorus content at 120 and 210 DAP, shoot dry matter (SDM), tonne of stalks per hectare (TSH) and tonne of pol per hectare (TPH), in relation to the corrective application of phosphate from sources of varying solubility
Mean values followed by the same letter in a column do not differ by Tukey’s test at 5% probability.NS not significant;* and**significant at 5 e 1%
respectively by F-test. (1)RNP - reactive natural phosphate;(2)TS - triple superphosphate;(3)PM - Sugarcane Press Mud. (4)SMD – significant mean
deviation;(5)CV - coefficient of variation
P source
P content
SDM TSH TPH
120 210
--- g kg-1--- g plant-1 Mg ha-1 --- Mg ha-1
---RNP(1) 3.9 3.6 788.2 74.7 B 124.4 15.7
TS(2) 4.1 3.3 844.2 91.0 A 126.5 15.2
PM(3) 3.9 3.5 791.4 71.7 B 124.1 15.4
Control 3.7 3.3 736.5 63.4 116.8 13.9
PSource 0.45ns 2.32ns 1.06ns 11.08** 0.25ns 0.28ns
PDose 0.98ns 0.93ns 3.67* 4.20* 0.72* 0.42ns
FSource x Dose 0.52ns 1.14ns 1.69ns 2.58ns 0.36ns 0.46ns
SMD(4) 0.53 0.40 105.47 10.82 9.02 1.54
CV (%)(5) 15.45 13.25 15.10 15.81 8.35 11.50
Orthogonal Contrast Control v. Phosphate treatments
T-test (p>0.05) -1.916ns 1.644ns 2.159* -0.733* -3.077** -3.476**
F-test (p>0.05) 3.672ns 2.106ns 4.663* 0.537* 9.471** 12.080**
Figure 2 - Shoot dry matter (g plant-1) (A), Shoot dry matter (SDM) production (B) and stalk productivity (TSH) (C), in relation to
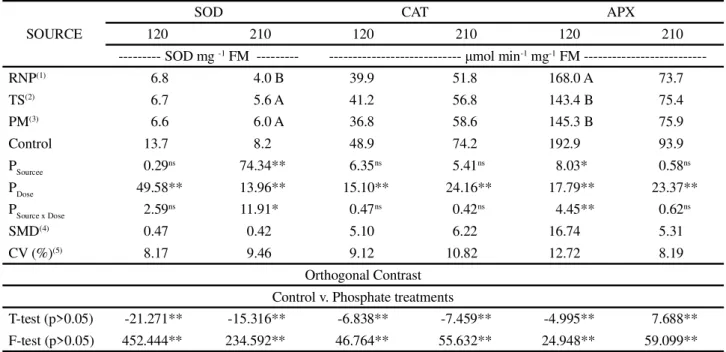
Table 2 - Enzyme activity of the antioxidant complex: superoxide dismutase (SOD), ascorbate peroxidase (APX) and catalase (CAT), as a function of the doses and sources of phosphorus applied to the soil
Mean values followed by the same letter in a column do not differ by Tukey’s test at 5% probability.* and**significant at 5 e 1% respectively
by F-test. (1)RNP - reactive natural phosphate;(2)TS - triple superphosphate;(3)PM - Sugarcane Press Mud. (4)SMD - significant mean deviation; (5)CV - coefficient of variation;NS not significant
SOURCE
SOD CAT APX
120 210 120 210 120 210
--- SOD mg-1 FM --- --- μmol min-1 mg-1 FM
---RNP(1) 6.8 4.0 B 39.9 51.8 168.0 A 73.7
TS(2) 6.7 5.6 A 41.2 56.8 143.4 B 75.4
PM(3) 6.6 6.0 A 36.8 58.6 145.3 B 75.9
Control 13.7 8.2 48.9 74.2 192.9 93.9
PSourcee 0.29ns 74.34** 6.35ns 5.41ns 8.03* 0.58ns
PDose 49.58** 13.96** 15.10** 24.16** 17.79** 23.37**
PSource x Dose 2.59ns 11.91* 0.47ns 0.42ns 4.45** 0.62ns
SMD(4) 0.47 0.42 5.10 6.22 16.74 5.31
CV (%)(5) 8.17 9.46 9.12 10.82 12.72 8.19
Orthogonal Contrast Control v. Phosphate treatments
T-test (p>0.05) -21.271** -15.316** -6.838** -7.459** -4.995** 7.688** F-test (p>0.05) 452.444** 234.592** 46.764** 55.632** 24.948** 59.099**
Albuquerque et al. (2016) also found that when using
reactive natural phosphate to correct the P content at the surface together with localised fertilisation when planting the sugarcane, there were similar increases of the order of
10 Mg ha-1 in stalk productivity.
The increase in shoot biomass production in sugarcane with the practice of phosphate application is a reflection of greater root development in the presence of P, which can increase the volume of soil being exploited by 95%, with an increase of 105% in the length and 60%
in the diameter of the roots (ARRUDA et al., 2016).
Furthermore, when the P content of the soil is corrected on the surface, the roots can explore a volume of soil beyond the fertilisation and planting rows, thereby absorbing more water and other nutrients, and reducing oxidative stress in the plant.
Enzyme activity of the oxidant complex
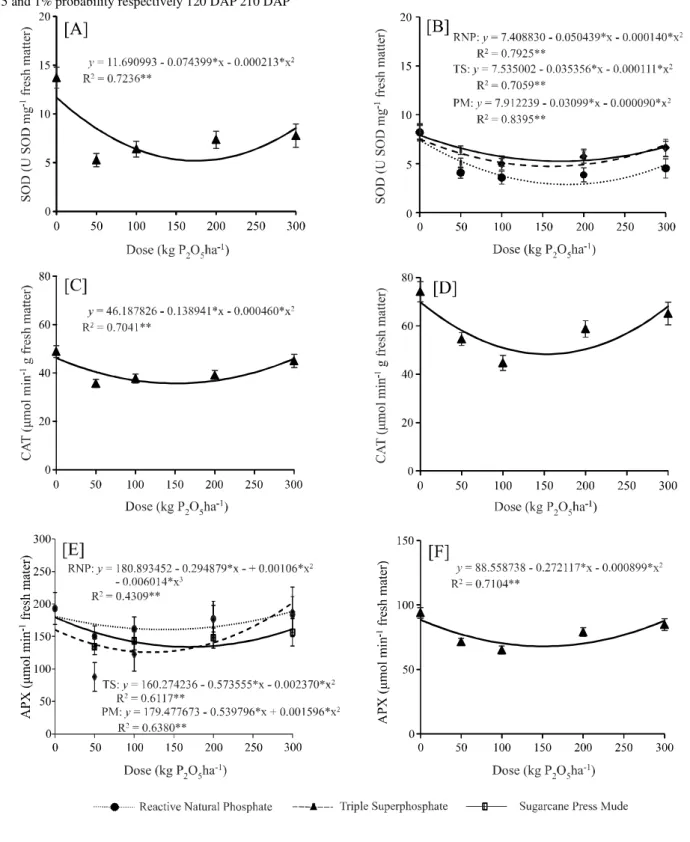
When cultivated in soil with no phosphate application, the plants showed greater activity for all the enzymes of the antioxidant complex at 120 and 210 DAP (Table 2). Enzyme activity reduced with phosphate application and adjusted to the quadratic polynomial model, showing a reduction for the doses of P (Figure 3). There was no difference in SOD activity for source at 120 DAP, and phosphate application reduced oxidative stress
by 63.7% in relation to the plants that did not receive the corrective phosphate application (Table 3; Figure 3A).
There was greater precipitation during February (Figure 1) in the second evaluation at 210 DAP, which reduced SOD activity. Even so, corrective phosphate application proved to be efficient in reducing oxidative stress in the sugarcane, with an interaction being seen between the sources and doses (Table 2). The use of RNP
promoted the lowest level SOD activity (2.9 U SOD g-1
FM), and reduced by 65.2% at a dose of 180 kg P2O5 ha-1
(Figure 3B). The TS and PM sources showed no difference,
and afforded a reduction of 39.3% (4.9 U SOD g-1 FM) at
the mean dose of 165 kg P2O5 ha-1 (Figure 3B).
There was no difference in CAT activity for the source of P, where the least amount of activity occurred
with the addition of 151 and 153 kg P2O5ha-1 (35.7 and
48.3 μmol min-1g-1 FM) at 120 and 210 DAP respectively
(Figure 3C; D), reducing the activity of this enzyme by 27.0 and 34.8% in relation to the lack of phosphate application.
The TS and PM sources used in the corrective phosphate application showed no difference for APX enzyme activity, and afforded the greatest reduction (34.9 and 30.6%) at 120 DAP, using doses of 121 and
169 kg P2O5ha-1 respectively (Figure 3E). RNP also
dose of 138 kg P2O5ha-1 (Figure 3E). At 210 DAP, the sources had no effect on the activity of the enzyme, with the
lowest activity (68.0 μmol min-1 g-1 FM) and a reduction
of 27.6% being seen using 152 kg P2O5ha-1 (Figure 3F).
The lowest level of SOD, CAT and APX activity was concentrated between the estimated doses of 121 and
180 kg P2O5ha-1, with a mean value of 150 kg P
2O5ha -1, in
a similar way to the greatest production of shoot dry matter,
Figure 3 - Activity of the SOD (A, B), CAT (C, D) and APX (E, F) enzymes as a function of corrective phosphate application with doses and sources of varying solubility, at 120 and 210 DAP. Vertical bars show the confidence interval atp<0.05. * and ** significant
CONCLUSIONS
1. Corrective phosphate application does not influence the levels of P in leaf tissue of plant cane if adequate phosphorus fertilisation is carried out when planting; however, it increases shoot dry matter in the plant by up to 25%, and stalk productivity by 8.5%, when using RNP, TS and PM as sources during pre-planting; 2. Oxidative stress in the sugarcane decreased with the
practice of phosphate application, where the lowest activity of the SOD, CAT and APX enzymes was seen at a mean dose of 150 kg P2O5ha-1;
3. High doses of P, greater than 150 kg P2O5ha-1, increased oxidative stress in the plant cane, and reduced stalk productivity and shoot dry matter production;
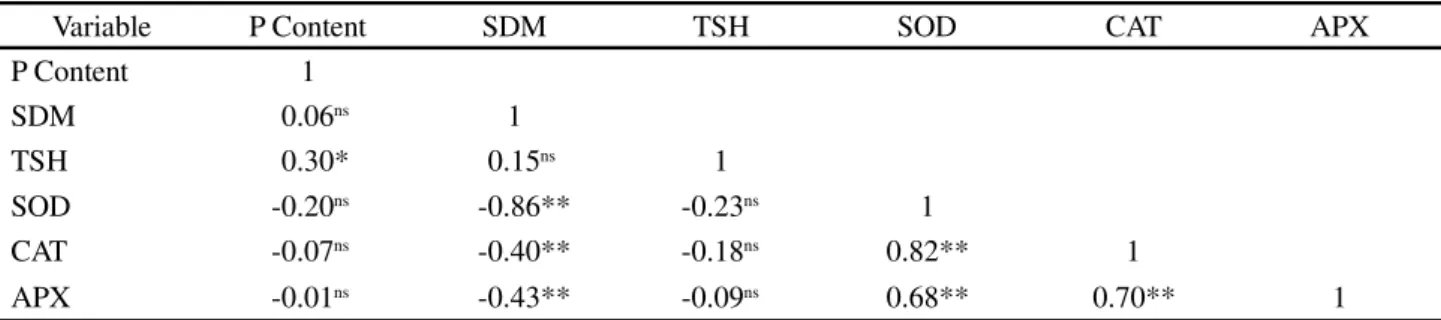
4. SOD activity showed the highest negative correlation coefficient with SDM activity, and the highest positive correlation coefficient with CAT and APX activity, which makes it possible to identify this enzyme as more sensitive in evaluating the abiotic stress that can reduce productivity in sugarcane.
REFERENCES
ALBUQUERQUE, A. W. de et al. Growth and yield of sugarcane as a function of phosphorus doses and forms of application. Revista Brasileira de Engenharia Agrícola e Ambiental, v. 20, n. 1, p. 29-35, 2016.
ARRUDA, B. et al. Biological and morphological traits of sugarcane roots in relation to phosphorus uptake. Journal of Soil Science and Plant Nutrition, v. 16. n. 4, p. 901-915, 2016. ASSOCIATION OF OFFICIAL ANALYTICAL CHEMISTS.
Official methods of analysis. 18. ed. Maryland: AOAC, 2005. 3000 p.
BOARETTO, L. F. et al. Water stress reveals differential antioxidant responses of tolerant and non-tolerant sugarcane genotypes. Plant Physiology and Biochemistry, v. 74, p. 165-175, 2014.
Table 3 - Linear correlation matrix between enzymes of the antioxidant complex (SOD, CAT and APX), leaf +1 P content, shoot dry matter (SDM) and stalk productivity (TSH)
P Content - leaf +1 phosphorus content; Shoot dry matter; SOD - superoxide dismutase; CAT-catalase; APX - ascorbate peroxidase. ** and * Significant correlation at a 1 and 5% probability respectively
Variable P Content SDM TSH SOD CAT APX
P Content 1
SDM 0.06ns 1
TSH 0.30* 0.15ns 1
SOD -0.20ns -0.86** -0.23ns 1
CAT -0.07ns -0.40** -0.18ns 0.82** 1
APX -0.01ns -0.43** -0.09ns 0.68** 0.70** 1
which was obtained at a dose of 153 kg P2O5ha-1 (Figure
2; 3). These results show that the practice of corrective phosphate application reduces oxidative stress and promotes greater sugarcane development. However, when the doses of P used in the corrective phosphate application were high, enzyme activity increased, with a decrease in shoot dry matter (Figures 2, 3), suggesting that these doses are excessive and consequently harmful.
This behaviour suggests that the excess of P resulted in new stress in the plant, with greater ROS production, as seen by Espindula (2009), who studied two wheat genotypes and found that there was an isoform of SOD in the genotypes at high doses of P that was not present at the lower doses, indicating an increase in the production of free radicals at high levels of the nutrient.
SOD is considered the first line of defence against ROS, acting against the superoxide radical and
transforming it into H2O2 and O2 (BOARETTO et al.,
2014). The H2O2 produced by SOD and other metabolic
pathways are substrates of CAT and APX that eliminate these ROS. Therefore, the same behaviour by the CAT and APX enzymes is consistent with the results for SOD, in which an increase in the activity of these enzymes was also seen at high doses of P, showing that there was an increase in CAT and APX activity due to the greater production of
H2O2 by the SOD during O2- dismutation.
CAIONE, G. et al. Response of sugarcane in a red ultisol to phosphorus rates, phophorus sources and filter cake. The Scientific World Journal, v. 2015, p. 1-10, 2015.
DEFELIPO, B. V.; RIBEIRO, A. C.Análise química do solo. Viçosa, MG: UFV, 1996. 17 p. (Boletim de extensão, 29). ESPINDULA, L. F.Respostas de deficiência de fósforo e sua relação com a tolerância ao alumínio em trigo. 2009. 164 f. Dissertação (Mestrado em Fitotecnia) - Universidade Federal do Rio Grande do Sul, Porto Alegre, 2009.
GIANNOPOLITIS, C. N.; RIES, S. K. Superoxide dismutases. I. Occurrence in higher plants.Plant Physiology, v. 59, p. 309-314, 1977.
GUNES, A. et al. Silicon mediated changes of some physiological and enzymatic parameters symptomatic for oxidative stress in spinach and tomato grown in sodic-B toxic soil.Plant Soil, v. 290, p. 103-114, 2007.
HAVIR, E. A.; MCHALE, N. A. Biochemical and developmental characterization of multiple forms of catalase in tobacco leaves. Plant Physiology, v. 84, p. 450-455, 1987.
LAWLOR, D. W. Genetic engineering to improve plant performance under drought: physiological evolution of achievements, limitations, and possibilities. Journal of Experimental Botany, v. 64, n. 1, p. 695-709, 2013.
LIMA NETO, J. F. et al. Avaliação agroindustrial e parâmetros genéticos de clones UFRPE de cana-de-açúcar no litoral norte de Pernambuco.Pesquisa Agropecuária Pernambucana, v. 18, n. 1, p. 8-13, 2013.
LISBOA, L. A. M.et al. Efeitos da fosfatagem no desenvolvimento
da cana-de-açúcar.Ciência & Tecnologia, v. 8, n. 1, p. 31-41, 2016.
MITTLER, R. et al.ROS signaling: the new wave?.Trends in Plant Science, v. 16, p. 300-309, 2011.
NAKANO, Y; ASADA, K. Hydrogen peroxide isscavenged by ascorbate-especific peroxidase in spinach chloroplasts. Plant Cell Physiology, v. 22, p. 1068-1072, 1981.
NOCTOR, G.; FOYER, C. H. Ascorbate and glutathione: keeping active oxygen under control. Annual Review Plant Physiology and Plant Molecular Biology, v. 49, p. 249-279, 1998.
OLIVEIRA, R. I. et al. Nutrient partitioning and nutritional requirement in sugarcane. Australian Journal of Crops Science, v. 10, n. 1, p. 69-75, 2016.
RAIJ, B. Vanet al.Recomendação de adubação e calagem para o Estado de São Paulo. 2. ed. Campinas: Instituto Agronômico, 1996. 285 p. (Boletim técnico, 100).
SANTOS, E. F. et al.Normal nutrient ranges for sugarcane by
the methods chm, dris and cnd and critical level by reduced normal distribution.Revista Brasileira de Ciência do Solo, v. 37, n. 6, p. 1651-1658, 2013.
SANTOS, H. G. doset al.Sistema brasileiro de classificação de solos. 3. ed. Brasilia: Embrapa, 2013. 353 p.
SAS INSTITUTE. SAS Technical Report.SAS/STAT software: changes and enhancement, release 9.1. 3. Cary, NC: SAS Institute, 2011.
SIMÕES NETO, D. E. et al.Adubação fosfatada para cana-de-açúcar em solos representativos para o cultivo da espécie no Nordeste brasileiro.Pesquisa Agropecuária Brasileira, v. 50, n. 1, p. 73-81, 2015.
VALE, D. W. et al. Omissão de macronutrientes na nutrição e no crescimento da cana-de-açúcar cultivada em solução nutritiva. Revista Brasileira de Ciência Agrária, v. 6, n. 2, p. 189-196, 2011.
WILLADINO, L. G. et al.Estresse salino em duas variedades de cana-de-açúcar: enzimas dosistema antioxidativo e fluorescência da clorofila.Revista Ciência Agronômica, v. 42, n. 2, p. 417-422, 2011.
YAO, Y. et al. Comparative proteome analysis of metabolic changes by low phosphorus stress in two Brassica napus
genotypes.Planta, v. 233, p. 523-537, 2011.